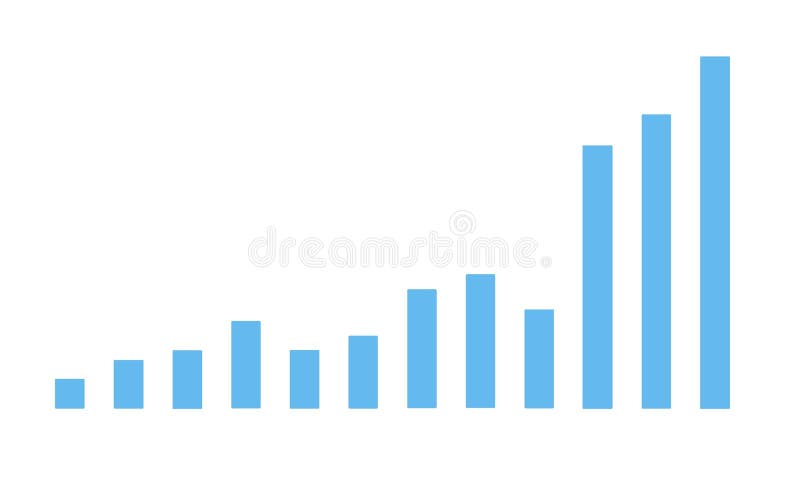
Free with trial A simple line style icon of a bar chart representing growth, data, or statistics. This graphic element is perfect for use in presentations, infographics, web design, and user interfaces. Bar chart decrease vectors Simple Line Style Bar Chart Graphic Outline Display Graph Icon. A simple line style icon of a bar chart representing growth, data, or statistics. This graphic element is perfect for use in presentations, infographics, web design, and user interfaces.
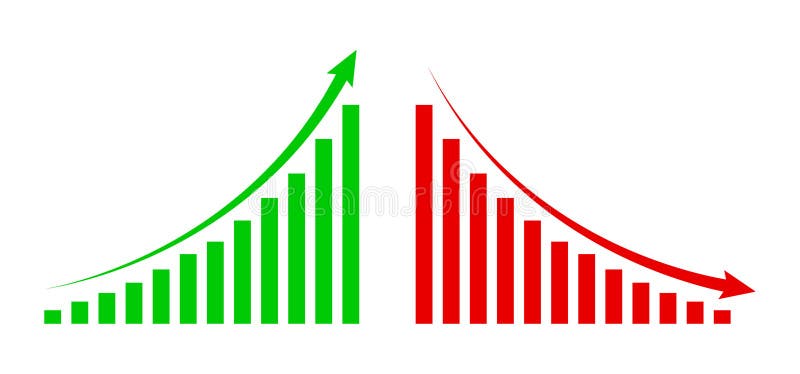
Free with trial Declining Bar Chart with Downward Arrow Representing Economic Downturn and Financial Loss. Bar chart decrease vectors Declining Bar Chart with Downward Arrow Representing Economic Downturn and Financial Loss
Free with trial Zambia flag with a declining bar chart and down arrows, symbolizing decline in data, performance, or various national indicators in the country. Bar chart decrease illustrations Flag with a declining bar chart and down arrows
Free with trial A 3D white character cheerfully presents a bar chart showing upward business growth trends, highlighting success and positive development. Bar chart decrease illustrations 3D Character Presenting Business Growth Bar Chart. A 3D white character cheerfully presents a bar chart showing upward business growth trends, highlighting success and positive development.
Free with trial A simple outline icon illustration of a bar chart diagram, used to display data analysis and performance metrics. Ideal for presentations, infographics, and dashboards. Bar chart decrease vectors Outline Simple Bar Chart Diagram Icon Graphic for Data Analysis. A simple outline icon illustration of a bar chart diagram, used to display data analysis and performance metrics. Ideal for presentations, infographics, and dashboards.
Free with trial Declining bar chart with downward arrow indicates negative trend. Bar chart decrease vectors Declining bar chart with downward arrow indicates negative trend
Free with trial This 3D illustration shows a colorful bar graph with pastel-colored cylinders on a white circular base, representing upward business growth trends. The chart includes a line graph illustrating various data points. Bar chart decrease illustrations 3D Colorful Cylindrical Bar Graph Chart Showing Business Growth. This 3D illustration shows a colorful bar graph with pastel-colored cylinders on a white circular base, representing upward business growth trends. The chart includes a line graph illustrating various data points.
Free with trial Downward Trend Bar Chart Showing Losses with a Declining Red Arrow. Bar chart decrease vectors Downward Trend Bar Chart Showing Losses with a Declining Red Arrow
Free with trial Financial bar chart icon with up and down arrow. Economic growth and decline symbol in black circle. Bar chart decrease vectors Financial bar chart with up and down arrow. Economic growth and decline symbol in black circle
Free with trial Financial concept image featuring a blue bar chart with a red downward arrow, illustrating decline, recession, or loss over time. Ideal for presentations, reports, infographics, economic forecasts, and business documentation. Clean, clear, and professional visual, created ai. Bar chart decrease illustrations Business bar chart showing financial decline with downward arrow. Financial concept image featuring a blue bar chart with a red downward arrow, illustrating decline, recession, or loss over time. Ideal for presentations, reports, infographics, economic forecasts, and business documentation. Clean, clear, and professional visual, created ai.
Free with trial Up and down graph icon in line style. Outline bar chart with uptrend and downtrend arrow symbol vector. Bar chart decrease vectors Up and down graph icon in line style. Outline bar chart with uptrend and downtrend arrow symbol
Free with trial This image features a vibrant 3D representation of a bar chart, composed of translucent, glowing blocks in shades of pink, yellow, and cyan. The bars are arranged in varying heights, suggesting growth or data representation. The background is a dark green digital grid with subtle light effects and floating particles, creating a futuristic and technological atmosphere. This visual is ideal for concepts related to finance, data analysis, technology, growth, and digital trends. Bar chart decrease illustrations Abstract 3D Bar Chart with Neon Glow on Green Digital Background. This image features a vibrant 3D representation of a bar chart, composed of translucent, glowing blocks in shades of pink, yellow, and cyan. The bars are arranged in varying heights, suggesting growth or data representation. The background is a dark green digital grid with subtle light effects and floating particles, creating a futuristic and technological atmosphere. This visual is ideal for concepts related to finance, data analysis, technology, growth, and digital trends.
Free with trial A glowing green bar chart with a data line and grid on a black background, representing financial performance. Bar chart decrease illustrations Glowing Green Bar Chart with Data Line on photo Black graph finance. A glowing green bar chart with a data line and grid on a black background, representing financial performance
Free with trial Up and down graph icon vector in circular line. Outline bar chart with uptrend and downtrend arrow symbol. Bar chart decrease vectors Up and down graph icon in circular line. Outline bar chart with uptrend and downtrend arrow symbol
Free with trial Graph up and down icon vector in circular line. Outline bar chart with arrow symbol. Analytics concept. Bar chart decrease vectors Graph up and down icon in circular line. Outline bar chart with arrow symbol. Analytics concept
Free with trial A vibrant, 3D rendered bar chart displays ascending data, symbolizing progress and achievement. The pastel-colored bars are set against a clean white background, emphasizing their visual impact and providing a professional, modern feel. Perfect for presentations or business-related projects. Bar chart decrease illustrations Colorful 3D Bar Chart Showing Growth and Success on White Background. A vibrant, 3D rendered bar chart displays ascending data, symbolizing progress and achievement. The pastel-colored bars are set against a clean white background, emphasizing their visual impact and providing a professional, modern feel. Perfect for presentations or business-related projects.
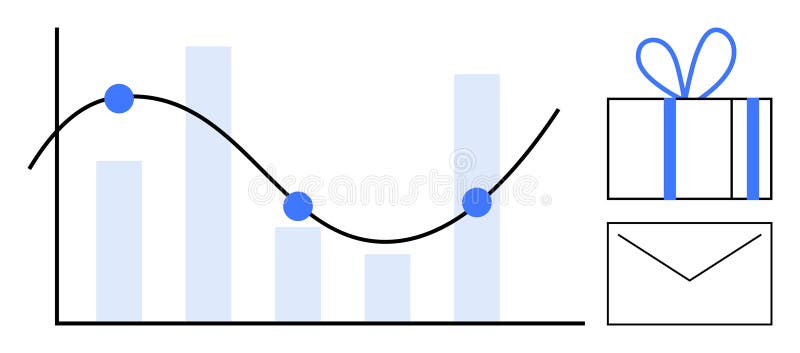
Free with trial Graph with decreasing bar chart and line graph noting key points beside a gift box and envelope. Ideal for business analysis, performance tracking, rewards programs, marketing, sales targets, client. Bar chart decrease vectors Bar Graph with Line Chart, Gift Box, and Envelope Representing Business Metrics and Rewards. Graph with decreasing bar chart and line graph noting key points beside a gift box and envelope. Ideal for business analysis, performance tracking, rewards programs, marketing, sales targets, client
Free with trial A 3D bar chart with red and green bars representing financial data trends, isolated on white background. Bar chart decrease illustrations 3d bar chart showing financial data trends isolated on white background. A 3D bar chart with red and green bars representing financial data trends, isolated on white background
Free with trial A 3D bar chart with a red line graph indicating a significant decline, isolated on a white background. Bar chart decrease illustrations Financial bar chart showing downward trend isolated on white background. A 3D bar chart with a red line graph indicating a significant decline, isolated on a white background
Free with trial A bar chart with a clear downward trend, illustrating a decline. The isolated object is presented on a clean white background. Bar chart decrease illustrations Declining bar chart showing downward trend isolated on white background. A bar chart with a clear downward trend, illustrating a decline. The isolated object is presented on a clean white background
Free with trial Line graph up and down icon in black circle. Outline bar chart with arrow symbol vector. Analytics concept. Bar chart decrease vectors Line graph up and down icon in black circle. Outline bar chart with arrow symbol. Analytics concept
Free with trial Hand Drawn Graphic Showing Decline Bar Chart with Arrow Pointing Downward. Bar chart decrease vectors Hand Drawn Graphic Showing Decline Bar Chart with Arrow Pointing Downward
Free with trial Downward arrow with SALE, bar chart displaying data trends, and dynamic stick figure. Ideal for business, marketing, analysis, economics, sales, growth statistics simple flat metaphor. Bar chart decrease illustrations Arrow pointing downward labeled SALE with bar chart and dynamic figure symbolizing action. Downward arrow with SALE, bar chart displaying data trends, and dynamic stick figure. Ideal for business, marketing, analysis, economics, sales, growth statistics simple flat metaphor
Free with trial Up and down graph chart icon. Growth increase and decrease sign. Graph or diagram with arrow going up and down. Vector. Illustration. Bar chart decrease vectors Up and down graph chart icon. Growth increase and decrease sign. Graph or diagram with arrow going up and down. Vector. Illustration
Free with trial Orange bar chart with downward arrow showing decline in industrial production. Manufacturing business downturn with economic crisis concept. Bar chart decrease illustrations Orange bar chart with downward arrow showing decline in industrial production
Free with trial Financial downturn concept. A business professional climbs tall blue bars, carrying a briefcase and analyze declining bar graph and chart using magnifying glass. Bar chart decrease vectors Financial downturn concept, businessman analyze declining bar graph and chart. Financial downturn concept. A business professional climbs tall blue bars, carrying a briefcase and analyze declining bar graph and chart using magnifying glass
Free with trial Percentage sign on the stack of coin bar chart and red graph trending downward with blur wall background on table. Economy recession crisis, inflation, stagflation, business and financial loss concept. Bar chart decrease illustrations Percentage sign on the stack of coin bar chart and red graph trending downward with blur wall background on table.
Free with trial A 3D rendered gold coin with a thick gold rim and a black circular face. On the black face, a gold bar chart is depicted, showing a downward trend with bars decreasing in height and an arrow pointing downwards. The coin is presented at an angle against a white background, symbolizing financial decline or economic loss. Bar chart decrease illustrations Gold coin with black background and gold bar chart showing decline money finance. A 3D rendered gold coin with a thick gold rim and a black circular face. On the black face, a gold bar chart is depicted, showing a downward trend with bars decreasing in height and an arrow pointing downwards. The coin is presented at an angle against a white background, symbolizing financial decline or economic loss
Free with trial This 3D render shows a calculator with a colorful bar chart made of cubes illustrating growth and success in business and finance. Perfect for presentations and infographics. Bar chart decrease illustrations Colorful 3D Calculator with Growing Bar Chart Cubes for Business and Finance. This 3D render shows a calculator with a colorful bar chart made of cubes illustrating growth and success in business and finance. Perfect for presentations and infographics.
Free with trial A whiteboard easel displays a bar graph with a downward trend and a red arrow indicating a decrease, isolated on a white background. Bar chart decrease illustrations Business bar chart showing decline isolated on white background. A whiteboard easel displays a bar graph with a downward trend and a red arrow indicating a decrease, isolated on a white background
Free with trial Hand drawn bar chart sketch with ascending and descending data patterns. Bar chart decrease vectors Hand drawn bar chart sketch with ascending and descending data patterns, AI Generative. Hand drawn bar chart sketch with ascending and descending data patterns.
Free with trial Graph going Up and Down sign with green and red arrows vector set. Flat design vector set of a concept of sales bar chart symbol icon with arrow moving down and sales bar chart with arrow moving up. Bar chart decrease vectors Graph going Up and Down sign with green and red arrows vector set. Vector set of a concept of sales bar chart symbol icon. Graph going Up and Down sign with green and red arrows vector set. Flat design vector set of a concept of sales bar chart symbol icon with arrow moving down and sales bar chart with arrow moving up.
Free with trial Graph going Up and Down with red arrows vector. Blue chart bar vector illustration concept of sales bar chart symbol icon with arrow moving down and sales bar chart with arrow moving up. Bar chart decrease vectors Graph going Up and Down with red arrows vector. Blue chart bar vector illustration concept of sales bar chart symbol icon
Free with trial Trend chart icon set. Growth and decline symbol. Up and down arrow with bar graph illustration. Bar chart decrease vectors Trend chart icon set. Growth and decline symbol. Up and down arrow with bar graph
Free with trial Graph going up and down sign financial arrows. chart increase, decrease sign with green and red arrows. vector graph with green and red arrows. Bar chart decrease vectors Graph going up and down sign financial arrows. chart increase, decrease sign with green and red arrows. vector graph
Free with trial Graph going Up and Down with green and red arrows vector. Blue chart bar vector illustration concept of sales bar chart symbol icon with arrow moving down and sales bar chart with arrow moving up. Bar chart decrease vectors Graph going Up and Down with green and red arrows vector. Blue chart bar vector illustration concept of sales bar chart symbol. Graph going Up and Down with green and red arrows vector. Blue chart bar vector illustration concept of sales bar chart symbol icon with arrow moving down and sales bar chart with arrow moving up.
Free with trial Colorful bar chart on a blue background illustrating data trends ,Generative ai. Bar chart decrease illustrations Vibrant bar chart on blue background, visualizing data trends and insights colorful. Colorful bar chart on a blue background illustrating data trends ,Generative ai
Free with trial This illustration depicts a piggy bank beside a bar chart showing a sharp decline symbolizing decreasing savings and potential economic hardship The design uses simple clean graphics to effectively communicate a message of financial downturn Ideal for articles about recession financial planning or investment risks. Bar chart decrease illustrations Declining Savings Piggy Bank and Bar Chart Showing Economic Downturn AI generated. This illustration depicts a piggy bank beside a bar chart showing a sharp decline symbolizing decreasing savings and potential economic hardship The design uses simple clean graphics to effectively communicate a message of financial downturn Ideal for articles about recession financial planning or investment risks
Free with trial A minimalist 3D bar chart rendered in white against a bright white background. The chart displays four bars of decreasing height, visually representing a sharp downward trend. A prominent white arrow, also pointing downwards, overlays the bars, emphasizing the decline. The composition is clean and abstract, suitable for representing financial or economic downturns. Bar chart decrease illustrations White 3D Bar Chart Showing a Sharp Downward Trend with Arrow on White Background graph. A minimalist 3D bar chart rendered in white against a bright white background. The chart displays four bars of decreasing height, visually representing a sharp downward trend. A prominent white arrow, also pointing downwards, overlays the bars, emphasizing the decline. The composition is clean and abstract, suitable for representing financial or economic downturns
Free with trial A minimalist bar chart is displayed on a white background. Three vertical bars of increasing height are depicted with thick black outlines. The interior of each bar features a subtle grey gradient fill, creating a sense of depth. Bar chart decrease illustrations Simple Black Outline Bar Chart with Gradient Fill on White Background graph bars. A minimalist bar chart is displayed on a white background. Three vertical bars of increasing height are depicted with thick black outlines. The interior of each bar features a subtle grey gradient fill, creating a sense of depth
Free with trial Trend chart icon in circular outline. Growth and decline symbol. Up and down arrow with bar graph illustration. Bar chart decrease vectors Trend chart icon in circular outline. Growth and decline symbol. Up and down arrow with bar graph
Free with trial Line graph up and down icon vector. Outline bar chart with arrow symbol. Analytics concept. Bar chart decrease vectors Line graph up and down icon. Outline bar chart with arrow symbol. Analytics concept
Free with trial This 3D rendering showcases a vibrant bar chart illustrating business growth and financial performance. The colorful cylinders represent data points, rising to show increasing success. A line graph adds additional information about trends over time. Bar chart decrease illustrations Colorful 3D Bar Chart with Growth Graph Showing Business Success and Financial Data. This 3D rendering showcases a vibrant bar chart illustrating business growth and financial performance. The colorful cylinders represent data points, rising to show increasing success. A line graph adds additional information about trends over time.
Free with trial Colorful bar chart on a blue background showing data analysis and statistical growth. Generative AI. Bar chart decrease illustrations Colorful bar chart on a blue background showing data analysis and statistical growth
Free with trial Tree graphic with bar graph displaying decrease in carbon emissions from wood pellets, Generated by AI. Bar chart decrease illustrations Tree graphic with bar graph displaying decrease in carbon emissions from wood pellets
Free with trial Simple Blue Analytics Diagram Bar Chart Showing Variable Data Trends on White Background � Simple Abstract Business and Analytics Infographic Illustration. Bar chart decrease illustrations Simple Blue Analytics Diagram Bar Chart Showing Variable Data Trends on White Background
Free with trial A detailed gold coin is shown against a white background. The face of the coin features a black circular inset displaying a golden bar chart with five bars of decreasing height, indicating a downward trend. A golden arrow points downwards along the trend line, reinforcing the concept of decline or loss. The coin has a ribbed edge, typical of real currency. This image represents financial decline,. Bar chart decrease illustrations Gold Coin with Black Circle Displaying Downward Bar Chart and Arrow currency finance. A detailed gold coin is shown against a white background. The face of the coin features a black circular inset displaying a golden bar chart with five bars of decreasing height, indicating a downward trend. A golden arrow points downwards along the trend line, reinforcing the concept of decline or loss. The coin has a ribbed edge, typical of real currency. This image represents financial decline,
Free with trial A red stock market decline is shown with a bar chart against a dark background. The image conveys a sense of financial crisis and economic downturn, visually representing negative trends. Bar chart decrease illustrations Red Stock Market Decline Graphic Bar Chart Financial Crisis Concept on Dark Background. A red stock market decline is shown with a bar chart against a dark background. The image conveys a sense of financial crisis and economic downturn, visually representing negative trends
Free with trial Bar chart graph. Colorful falling arrow. Financial data analysis. Vector business symbol. EPS 10. Bar chart decrease vectors Bar chart graph. Colorful falling arrow. Financial data analysis. Vector business symbol.
Free with trial A simple 3D bar chart composed of three colored cubes stands on a white background. The cubes are arranged in ascending order of height from left to right: a small blue cube, a medium yellow cube, and a tall red cube. This arrangement visually represents increasing data or progress. Bar chart decrease illustrations Colorful Bar Chart with Red, Yellow, and Blue Cubes on White Background graph statistics. A simple 3D bar chart composed of three colored cubes stands on a white background. The cubes are arranged in ascending order of height from left to right: a small blue cube, a medium yellow cube, and a tall red cube. This arrangement visually represents increasing data or progress
Free with trial A 3D rendered pink bar chart shows three bars of decreasing height, representing a downward trend. A vibrant red arrow curves downwards, starting above the tallest bar and pointing towards the right, further emphasizing the concept of decline. The entire graphic is set against a clean white background, making the pink and red elements stand out. Bar chart decrease illustrations Pink bar chart with a downward trending red arrow on a white background graph statistics. A 3D rendered pink bar chart shows three bars of decreasing height, representing a downward trend. A vibrant red arrow curves downwards, starting above the tallest bar and pointing towards the right, further emphasizing the concept of decline. The entire graphic is set against a clean white background, making the pink and red elements stand out
Free with trial A 3D rendered bar chart with yellow, pink, and teal bars stands against a light purple background. A purple magnifying glass with a yellow handle is positioned over the chart, suggesting analysis. A thin line with pink dots connects the tops of the bars, indicating a trend. Bar chart decrease illustrations 3D Bar Chart with Magnifying Glass and Trend Line on Purple Background graph statistics. A 3D rendered bar chart with yellow, pink, and teal bars stands against a light purple background. A purple magnifying glass with a yellow handle is positioned over the chart, suggesting analysis. A thin line with pink dots connects the tops of the bars, indicating a trend
Free with trial Decreasing bar chart with downward arrow illustrates economic downturn stock market trend. Bar chart decrease vectors Decreasing bar chart with downward arrow illustrates economic downturn stock market trend
Free with trial Outline bar chart icon vector with upward and downward trend arrow. Uptrend and downtrend business graph symbol in black circle. Bar chart decrease vectors Outline bar chart icon with upward and downward trend arrow. Uptrend and downtrend business graph symbol in black circle
Free with trial A 3D rendered graphic depicts a bar chart with three vertical bars of varying heights: two blue bars flanking a taller yellow bar. At the top of the yellow bar, a central yellow sphere is connected by white rods to two smaller blue spheres, resembling a molecular structure or a network. The entire graphic is isolated on a white background, suggesting concepts of data analysis, growth, and. Bar chart decrease illustrations 3D Rendered Bar Chart with Connecting Spheres Representing Data Analysis graph statistics. A 3D rendered graphic depicts a bar chart with three vertical bars of varying heights: two blue bars flanking a taller yellow bar. At the top of the yellow bar, a central yellow sphere is connected by white rods to two smaller blue spheres, resembling a molecular structure or a network. The entire graphic is isolated on a white background, suggesting concepts of data analysis, growth, and
Free with trial A 3D bar chart displays a downward trend. The bars are alternating green and pink, decreasing in height from left to right. A bright yellow arrow points downwards, crossing over the bars and emphasizing the decline. The background is a solid, light blue. Bar chart decrease illustrations Downward Trending Bar Chart with Yellow Arrow Indicating Decline on Light Blue Background. A 3D bar chart displays a downward trend. The bars are alternating green and pink, decreasing in height from left to right. A bright yellow arrow points downwards, crossing over the bars and emphasizing the decline. The background is a solid, light blue
Free with trial Crumbling bar chart made of clay or stone with broken tops and debris, symbolizing decline or instability in growth or progress. Bar chart decrease illustrations A broken bar chart made of clay or stone with a broken top and debris is a symbol of decline or instability. crumbling bar chart made of clay or stone with broken tops and debris, symbolizing decline or instability in growth or progress.
Free with trial Financial Capability Month Financial chart with 3d bar graph and line plot illustrating market trends. Bar chart decrease illustrations Financial Capability Month Financial chart with 3d bar graph and line plot illustrating market trends
Free with trial UK flag with a declining bar chart and down arrows, symbolizing decline in data, performance, or various national indicators in the country. Bar chart decrease illustrations Flag with a declining bar chart and down arrows
Free with trial Yemen flag with a declining bar chart and down arrows, symbolizing decline in data, performance, or various national indicators in the country. Bar chart decrease illustrations Flag with a declining bar chart and down arrows
Free with trial Vietnam flag with a declining bar chart and down arrows, symbolizing decline in data, performance, or various national indicators in the country. Bar chart decrease illustrations Flag with a declining bar chart and down arrows
Free with trial Venezuela flag with a declining bar chart and down arrows, symbolizing decline in data, performance, or various national indicators in the country. Bar chart decrease illustrations Flag with a declining bar chart and down arrows
Free with trial Uruguay flag with a declining bar chart and down arrows, symbolizing decline in data, performance, or various national indicators in the country. Bar chart decrease illustrations Flag with a declining bar chart and down arrows
Free with trial Uzbekistan flag with a declining bar chart and down arrows, symbolizing decline in data, performance, or various national indicators in the country. Bar chart decrease illustrations Flag with a declining bar chart and down arrows
Free with trial USA flag with a declining bar chart and down arrows, symbolizing decline in data, performance, or various national indicators in the country. Bar chart decrease illustrations Flag with a declining bar chart and down arrows
Free with trial Ukraine flag with a declining bar chart and down arrows, symbolizing decline in data, performance, or various national indicators in the country. Bar chart decrease illustrations Flag with a declining bar chart and down arrows
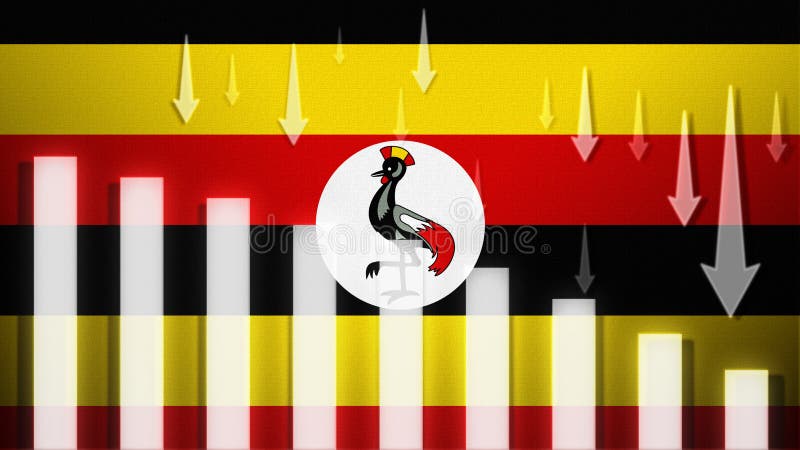
Free with trial Uganda flag with a declining bar chart and down arrows, symbolizing decline in data, performance, or various national indicators in the country. Bar chart decrease illustrations Flag with a declining bar chart and down arrows
Free with trial Taiwan flag with a declining bar chart and down arrows, symbolizing decline in data, performance, or various national indicators in the country. Bar chart decrease illustrations Flag with a declining bar chart and down arrows
Free with trial UAE flag with a declining bar chart and down arrows, symbolizing decline in data, performance, or various national indicators in the country. Bar chart decrease illustrations Flag with a declining bar chart and down arrows
Free with trial Bar chart with decreasing orange bars and a downward red arrow illustrating financial decline. Bar chart decrease vectors Bar chart with decreasing orange bars and a downward red arrow illustrating financial decline
Free with trial Trend chart icon in black circle. Growth and decline symbol. Up and down arrow with bar graph illustration. Bar chart decrease vectors Trend chart icon in black circle. Growth and decline symbol. Up and down arrow with bar graph
Free with trial Businessman pushing the cracked financial bar chart for economy recession and bankruptcy concept illustration clip art. Bar chart decrease vectors Businessman Pushing Cracked Financial Bar Chart for Economy Recession and Bankruptcy Concept Illustration. Businessman pushing the cracked financial bar chart for economy recession and bankruptcy concept illustration clip art
Free with trial Downward Chart: Declining bar graph with falling arrow indicates losses and economic downturn. Bar chart decrease vectors Downward Chart: Declining bar graph with falling arrow indicates losses and economic downturn
Free with trial Business chart icon set with graph, statistic, line and bar diagram for finance or analysis. Pie graphics with horizontal and donut layout for data growth. Vector report for trend or economy by pictogram scheme. Bar chart decrease vectors Business chart icon set with graph, statistic, line and bar diagram for finance or analysis. Pie graphics with
Free with trial Graph going Up and Down sign with blue arrows vector. Flat design vector illustration concept of sales bar chart symbol icon with arrow moving down and sales bar chart with arrow moving up. Bar chart decrease vectors Graph going Up and Down sign with blue arrows vector. Flat design vector illustration concept of sales bar chart symbol icon. Graph going Up and Down sign with blue arrows vector. Flat design vector illustration concept of sales bar chart symbol icon with arrow moving down and sales bar chart with arrow moving up.
Free with trial Businesswoman pushing cracked financial bar chart for economy recession and bankruptcy concept illustration clip art. Bar chart decrease vectors Businesswoman Pushing Cracked Financial Bar Chart for Economy Recession and Bankruptcy Concept Illustration
Free with trial 3d bar chart illustrating growth, analysis, and business progress with colorful visual representation of data ,Generative ai. Bar chart decrease illustrations 3d bar chart, visualizing growth, data analysis, and business progress for effective communication. 3d bar chart illustrating growth, analysis, and business progress with colorful visual representation of data ,Generative ai
Free with trial A red bar chart illustrating a downward trend, with bars decreasing in height and a red arrow pointing downwards, signifying decline and loss. Bar chart decrease illustrations Bar chart with downward trending arrow isolated on white background. A red bar chart illustrating a downward trend, with bars decreasing in height and a red arrow pointing downwards, signifying decline and loss
Free with trial This vibrant 3D bar chart illustrates upward trending data, perfect for presentations or reports on financial growth, market analysis, or business success. The colorful blocks represent different data points. Bar chart decrease illustrations Colorful 3D Bar Chart Showing Business Growth and Success. This vibrant 3D bar chart illustrates upward trending data, perfect for presentations or reports on financial growth, market analysis, or business success. The colorful blocks represent different data points.
Free with trial Three-dimensional rectangular bars stand side-by-side on a white background. The bars are of different heights, with the shortest on the left, a medium-height bar in the middle, and the tallest bar on the right. The bars are colored blue, pink, and orange, respectively. This arrangement visually represents a bar chart or graph, suggesting concepts of growth, data comparison, or progress. Bar chart decrease illustrations Three 3D Rendered Rectangular Bars of Varying Heights and Colors on a White Background bar chart. Three-dimensional rectangular bars stand side-by-side on a white background. The bars are of different heights, with the shortest on the left, a medium-height bar in the middle, and the tallest bar on the right. The bars are colored blue, pink, and orange, respectively. This arrangement visually represents a bar chart or graph, suggesting concepts of growth, data comparison, or progress