Free with trial Percentage sign with downward red and white arrows, financial decline, economic downturn, minimalist design, dark background, 3D render, market crash. Data analysis decrease illustrations Percentage sign with downward red and white arrows, financial decline
Free with trial Professional monitoring business expenses. Woman at desk, assessing financial charts with declining trends and dollar signs. Cost management and reduction focus. Flat vector illustration. Data analysis decrease vectors Professional monitoring business expenses. Woman at desk, assessing
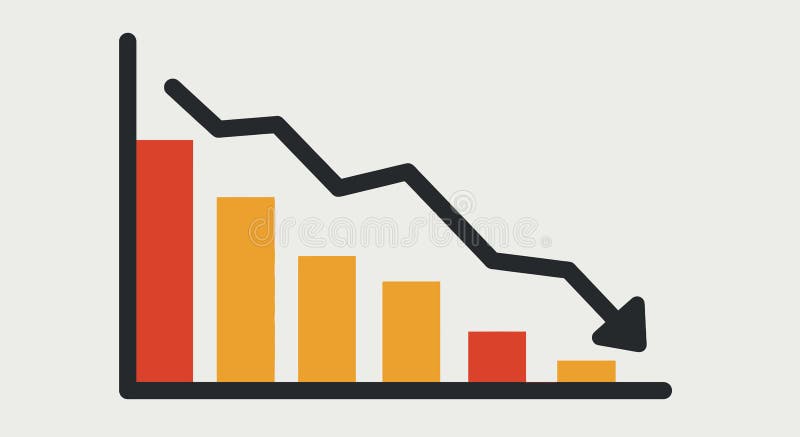
Free with trial This image shows a bar chart with a downward trend line, indicating economic decline. Vector illustration design using ai tool. Data analysis decrease vectors Economic recession chart. This image shows a bar chart with a downward trend line, indicating economic decline. Vector illustration design using ai tool.
Free with trial Percentage sign with downward red and white arrows, financial decline, economic downturn, minimalist design, dark background, 3D render, market crash. Data analysis decrease illustrations Percentage sign with downward red and white arrows, financial decline
Free with trial Percentage sign with downward red and white arrows, financial decline, economic downturn, minimalist design, dark background, 3D render, market crash. Data analysis decrease illustrations Percentage sign with downward red and white arrows, financial decline
Free with trial This abstract financial stock market trading chart with a gold arrow downtrend on a blue background conveys the concept of market volatility and uncertainty. The downward trend of the gold arrow symbolizes a decrease in stock prices or economic instability. The blue background may represent calmness or trust in the financial system despite the fluctuations. This image captures the essence of the dynamic nature of the stock market and the importance of monitoring trends for successful trading strategies. Data analysis decrease illustrations Abstract Financial Stock Market Trading Chart with Gold Arrow Downtrend on Blue Background. This abstract financial stock market trading chart with a gold arrow downtrend on a blue background conveys the concept of market volatility and uncertainty. The downward trend of the gold arrow symbolizes a decrease in stock prices or economic instability. The blue background may represent calmness or trust in the financial system despite the fluctuations. This image captures the essence of the dynamic nature of the stock market and the importance of monitoring trends for successful trading strategies.
Free with trial The visualization displays a collapsing financial bar chart, illustrating a significant decrease in financial metrics with a clean, minimalist aesthetic. Data analysis decrease illustrations Visual representation of financial decline using a collapsing bar chart in a modern design. The visualization displays a collapsing financial bar chart, illustrating a significant decrease in financial metrics with a clean, minimalist aesthetic.
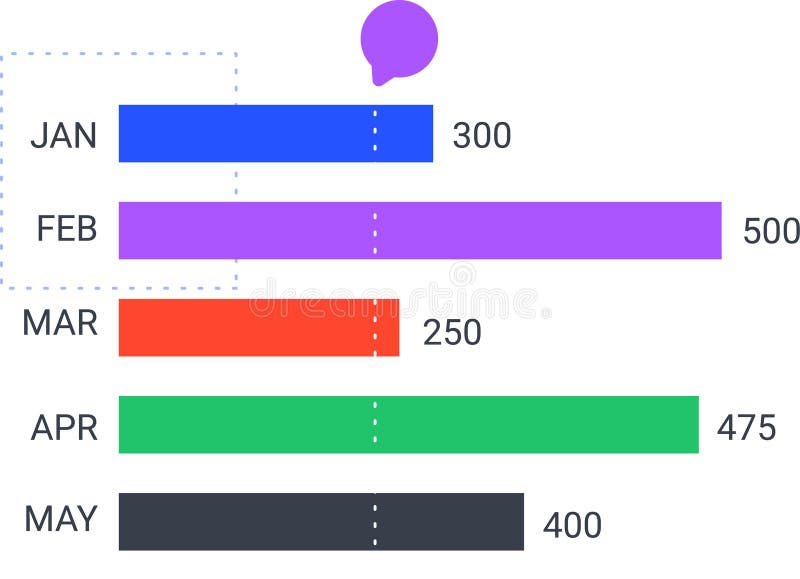
Free with trial Colorful horizontal bar chart is displaying monthly statistics from january to may, indicating trends and performance with a speech bubble above. Data analysis decrease vectors Colorful horizontal bar chart is displaying monthly statistics from january to may, indicating trends and performance
Free with trial Silhouette of a head with stock market decline graph overlay, red and black tones, digital concept of financial crisis. 3D. Data analysis decrease illustrations Silhouette of a head with stock market decline graph overlay, red and black tones, digital concept of financial crisis. 3D
Free with trial Candlestick chart line icon. Neumorphic, Orange gradient, 3d pin buttons. Analytics graph sign. Market analytics symbol. Line icons. Neumorphic buttons with outline signs. Vector. Data analysis decrease vectors Candlestick chart line icon. Analytics graph sign. Line icons. Vector. Candlestick chart line icon. Neumorphic, Orange gradient, 3d pin buttons. Analytics graph sign. Market analytics symbol. Line icons. Neumorphic buttons with outline signs. Vector
Free with trial Red 3D Percentage Symbol With Arrow Pointing Down. Price reduction percentage sign in red. Vector Illustrator. Data analysis decrease vectors Red 3D Percentage Symbol With Arrow Pointing Down. Vector Illustrator. Red 3D Percentage Symbol With Arrow Pointing Down. Price reduction percentage sign in red. Vector Illustrator.
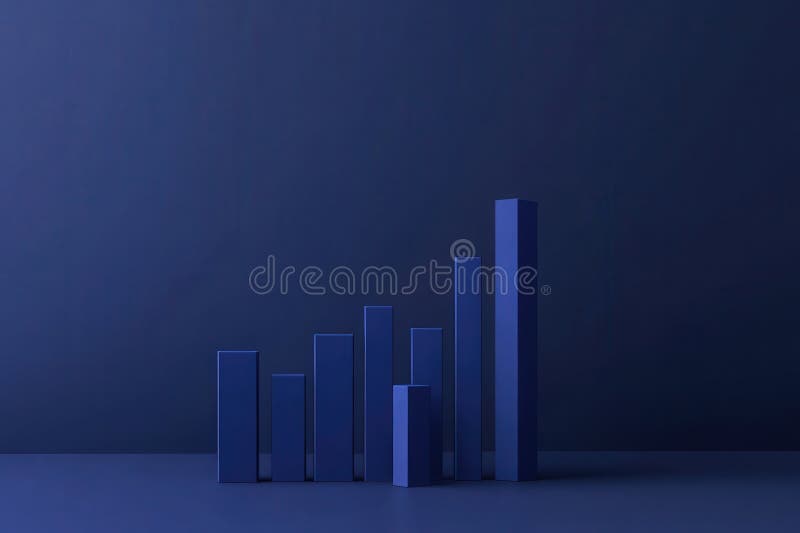
Free with trial The visual displays a clean and minimalist bar chart, illustrating a notable decrease in financial performance over a recent quarter, with a focus on dark blue tones to enhance impact. Data analysis decrease illustrations Minimalist financial bar chart showing significant decline in earnings over the past quarter. The visual displays a clean and minimalist bar chart, illustrating a notable decrease in financial performance over a recent quarter, with a focus on dark blue tones to enhance impact.
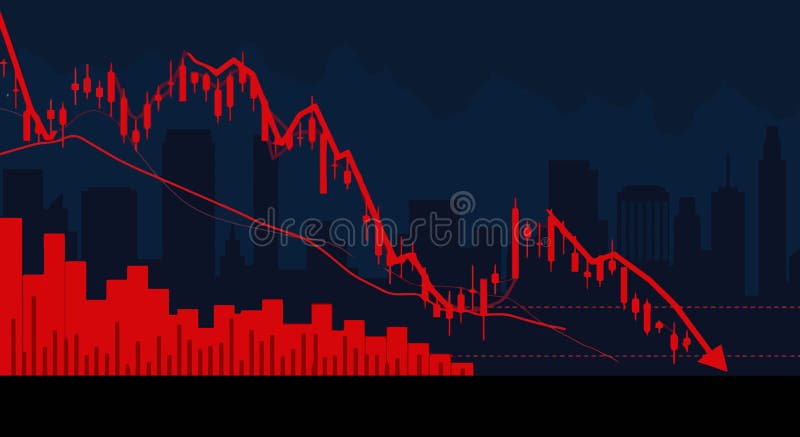
Free with trial Stock market charts depicting a downward trend, symbolizing a financial crisis, set on a dark, abstract background, illustrating the concept of economic decline. Data analysis decrease illustrations Stock market charts depicting a downward trend, symbolizing a financial crisis, set on a dark, abstract background, illustrating
Free with trial Clean red line graph shows a steep decline against white, emphasizing negative space. Data analysis decrease illustrations Minimalist red line graph showing sharp decline on white background, clean lines, negative space. Clean red line graph shows a steep decline against white, emphasizing negative space.
Free with trial Upward and downward arrows with a percentage symbol. An illustration of arrows pointing up and down, often used to represent changes, fluctuations, or progress, along with a percentage symbol. Data analysis decrease vectors Upward and Downward Arrows with Percentage, Financial Growth and Decline Concept. Upward and downward arrows with a percentage symbol. An illustration of arrows pointing up and down, often used to represent changes, fluctuations, or progress, along with a percentage symbol.
Free with trial Upward and downward arrows with a percentage symbol. An illustration of arrows pointing up and down, often used to represent changes, fluctuations, or progress, along with a percentage symbol. Data analysis decrease vectors Upward and Downward Arrows with Percentage, Financial Growth and Decline Concept. Upward and downward arrows with a percentage symbol. An illustration of arrows pointing up and down, often used to represent changes, fluctuations, or progress, along with a percentage symbol.
Free with trial Upward and downward arrows with a percentage symbol. An illustration of arrows pointing up and down, often used to represent changes, fluctuations, or progress, along with a percentage symbol. Data analysis decrease vectors Upward and Downward Arrows with Percentage, Financial Growth and Decline Concept. Upward and downward arrows with a percentage symbol. An illustration of arrows pointing up and down, often used to represent changes, fluctuations, or progress, along with a percentage symbol.
Free with trial Male and female characters beside a financial downfall chart, vector illustration on a blue background, concept of business success. Flat cartoon vector illustration. Data analysis decrease vectors Male and female characters beside a financial downfall chart, vector illustration
Free with trial A businessman presents a cost reduction concept, featuring a downward-trending graph illustrating financial success. Ideal for finance, business strategy, and marketing materials, this digital illustration conveys budget management and. Data analysis decrease illustrations Businessman presenting cost reduction concept with falling graph representing financial progress and success. A businessman presents a cost reduction concept, featuring a downward-trending graph illustrating financial success. Ideal for finance, business strategy, and marketing materials, this digital illustration conveys budget management and
Free with trial Image displaying stock market chart, rising or falling trends Generative AI. Data analysis decrease illustrations Image displaying stock market chart, rising or falling trends
Free with trial Reduction chart icon. eps. Data analysis decrease vectors Chart Icon Demonstrating Reduction in Data, Business Decline, and Statistical Analysis. Reduction chart icon.eps
Free with trial Collagen production in women based on age. Medical, healthcare infographics. Important information. Menopause problem. Editable vector illustration isolated on a white background. Horizontal banner. Data analysis decrease vectors Collagen production in women based on age. Medical, healthcare infographics.
Free with trial Image of businessman standing in modern office with hands on head looking distressed at large screen displaying fluctuating financial red charts indicating bear market. Recession, stock market concept. Data analysis decrease illustrations Image of businessman standing in modern office with hands on head looking distressed at large screen displaying fluctuating
Free with trial Minimalist black and white outline vector illustration of a simplified line graph icon for business analytics and financial performance tracking in a corporate environment. Data analysis decrease vectors Clean and straightforward icon depicting an increasing and decreasing line graph. Minimalist black and white outline vector illustration of a simplified line graph icon for business analytics and financial performance tracking in a corporate environment
Free with trial Colored outline declining coin bar chart with stack coin icon logo vector illustration design. Data analysis decrease vectors Colored outline declining coin bar chart with stack coin icon logo vector illustration design
Free with trial Abstract black trend line fractures downward on white, suggesting geometric collapse. Data analysis decrease illustrations Abstract minimalist fractured downward trend line black on white, geometric fragments suggesting collapse. Abstract black trend line fractures downward on white, suggesting geometric collapse.
Free with trial Abstract black trend line fractures downward on white, suggesting geometric collapse. Data analysis decrease illustrations Abstract minimalist fractured downward trend line black on white, geometric fragments suggesting collapse. Abstract black trend line fractures downward on white, suggesting geometric collapse.
Free with trial Abstract black trend line fractures downward on white, suggesting geometric collapse. Data analysis decrease illustrations Abstract minimalist fractured downward trend line black on white, geometric fragments suggesting collapse. Abstract black trend line fractures downward on white, suggesting geometric collapse.
Free with trial Abstract black trend line fractures downward on white, suggesting geometric collapse. Data analysis decrease illustrations Abstract minimalist fractured downward trend line black on white, geometric fragments suggesting collapse. Abstract black trend line fractures downward on white, suggesting geometric collapse.
Free with trial 3D delivery truck with arrow graph, transportation and inflation concept Generative AI. Data analysis decrease illustrations 3D delivery truck with arrow graph, transportation and inflation concept
Free with trial Business losses abstract concept vector illustration. Company leaders upset with financial statements, disappointing financial report, business documents, corporate paperwork abstract metaphor. Data analysis decrease vectors Business losses abstract concept vector illustration.
Free with trial 3D Isometric Flat Vector Illustration of Business Chart, Data and Statistic. Data analysis decrease vectors 3D Isometric Flat Vector Illustration of Business Chart
Free with trial The sales target schedule displays flat trends alongside varying performance metrics in a colorful chart Sales target schedule is trending flat. Data analysis decrease vectors The sales target schedule displays flat trends alongside varying performance metrics in a colorful chart Sales target schedule is
Free with trial A detailed circuit board displaying a red declining stock market graph, representing challenges in the semiconductor and technology sectors - AI-generated. Data analysis decrease illustrations A detailed circuit board displaying a red declining stock market graph, representing challenges in the semiconductor and
Free with trial A striking and impactful collection of illustrations depicting a stock market crash with dramatic downward trend graphs. Data analysis decrease vectors Stock market crash down graph illustration. A striking and impactful collection of illustrations depicting a stock market crash with dramatic downward trend graphs
Free with trial Multicolored graph trending downward icon. Data analysis decrease illustrations Wfh140125. Multicolored graph trending downward icon
Free with trial Vector illustration depicting financial challenges and savings strategies. Scenes show individuals interacting with money-saving tools, analyzing graphs, and managing expenses. Data analysis decrease vectors Financial Challenges and Savings Solutions. Vector illustration depicting financial challenges and savings strategies. Scenes show individuals interacting with money-saving tools, analyzing graphs, and managing expenses.
Free with trial Close-up of a red circuit board with a glowing red stock market graph, representing fluctuations in the tech and semiconductor industry - AI-generated. Data analysis decrease illustrations Close-up of a red circuit board with a glowing red stock market graph, representing fluctuations in the tech and semiconductor
Free with trial A digital financial chart with downward trending arrows, symbolizing a market crash or economic crisis on a dark background with red and blue accents. 3D Rendering. Data analysis decrease illustrations A digital financial chart with downward trending arrows, symbolizing a market crash or economic crisis on a dark background with
Free with trial Piles of gold coins in front of a digital stock market crash graph, signifying financial crisis on a dark red background, concept of investment loss. 3D Rendering. Data analysis decrease illustrations Piles of gold coins in front of a digital stock market crash graph, signifying financial crisis on a dark red background, concept
Free with trial Economic downturn trade war tariffs war recession crisis magnifying glass declining graph coins gears arrows abstract background mobile app screen Vector illustration. Data analysis decrease vectors Economic downturn trade war tariffs war recession crisis magnifying glass declining graph coins gears arrows abstract background
Free with trial Image of businessman standing in modern office with hands on head looking distressed at large screen displaying fluctuating financial red charts indicating bear market. Recession, stock market concept. Data analysis decrease illustrations Image of businessman standing in modern office with hands on head looking distressed at large screen displaying fluctuating
Free with trial Image of businessman standing in modern office with hands on head looking distressed at large screen displaying fluctuating financial red charts indicating bear market. Recession, stock market concept. Data analysis decrease illustrations Image of businessman standing in modern office with hands on head looking distressed at large screen displaying fluctuating
Free with trial 3D rendering of a declining bar chart in red with a downward arrow and floating coins, on a red grid background, symbolizing financial loss. Data analysis decrease illustrations Declining Bar Chart on Red Background. 3D Rendering. 3D rendering of a declining bar chart in red with a downward arrow and floating coins, on a red grid background, symbolizing financial loss
Free with trial Bank financial crisis trade war recession concept coins declining graph broken building gears abstract background modern website banner Vector illustration. Data analysis decrease vectors Bank financial crisis trade war recession concept coins declining graph broken building gears abstract background modern website
Free with trial Economic downturn crisis recession financial chart falling arrows magnifying glass dollar signs abstract background landing page template Vector illustration. Data analysis decrease vectors Economic downturn crisis recession financial chart falling arrows magnifying glass dollar signs abstract background landing page
Free with trial 3D Isometric Flat Vector Illustration of Economy Recession, Company Bankruptcy. Data analysis decrease vectors 3D Isometric Flat Vector Illustration of Economy Recession
Free with trial Generative AI, This 3D rendered image depicts a concept of financial decline, showcasing a descending trend of stacked gold coins against a blue background. The image features multiple stacks of gold coins, decreasing in height from left to right, symbolizing a decline in value or profit. A gold arrow graph follows the descending trend, visually representing the downward trajectory. The blue background with a. Data analysis decrease illustrations Financial decline concept - gold coins stacked in a descending trend with a falling arrow graph on blue background. Generative AI, This 3D rendered image depicts a concept of financial decline, showcasing a descending trend of stacked gold coins against a blue background. The image features multiple stacks of gold coins, decreasing in height from left to right, symbolizing a decline in value or profit. A gold arrow graph follows the descending trend, visually representing the downward trajectory. The blue background with a
Free with trial Stock market graph with blue and orange lines on dark grid background For Social Media Post Size. Data analysis decrease illustrations Stock market graph with blue and orange lines on dark grid background
Free with trial A glowing red circuit board with a declining stock market graph, symbolizing challenges in the semiconductor and tech industry - AI-generated. Data analysis decrease illustrations A glowing red circuit board with a declining stock market graph, symbolizing challenges in the semiconductor and tech industry
Free with trial A glowing red circuit board with a declining stock market graph, symbolizing challenges in the semiconductor and tech industry - AI-generated. Data analysis decrease illustrations A glowing red circuit board with a declining stock market graph, symbolizing challenges in the semiconductor and tech industry
Free with trial Calculator, coin, dollar sign, green arrows, up, down. Data analysis decrease vectors Calculator, coin, dollar sign
Free with trial Professional monitoring business expenses. Woman at desk, assessing financial charts with declining trends and dollar signs. Cost management and reduction focus. Flat vector illustration. Data analysis decrease vectors Professional monitoring business expenses. Woman
Free with trial Icon of loss function in AI featuring a computer monitor with a downward loss curve graph and the word LOSS, surrounded by circuit lines. Represents optimization process in machine learning models through minimization of error. Vector pictogram with thin black lines on a transparent background and editable line thickness. Data analysis decrease vectors Icon of loss function in AI
Free with trial Red downward trend graph with white falling blocks and coins on a dark red background. Concept of financial loss. 3D Rendering. Data analysis decrease illustrations Red downward trend graph with falling blocks and coins. 3D Rendering. Red downward trend graph with white falling blocks and coins on a dark red background. Concept of financial loss. 3D Rendering
Free with trial Blue 3D Percentage Symbol With Arrow Pointing Down on Yellow Background as Blank Banner for Displaying a Marketing Ad. Vector Illustration. Data analysis decrease vectors Blue 3D Percentage Symbol With Arrow Pointing Down on Yellow Background as Blank Banner for Displaying a Marketing Ad.
Free with trial This image shows a red line graph with a downward trend on a blue background. Vector illustration design using ai tool. Data analysis decrease vectors Financial crisis graph. This image shows a red line graph with a downward trend on a blue background. Vector illustration design using ai tool.
Free with trial This image shows a downward trend in a stock market chart with people losing money. Vector illustration design using ai tool. Data analysis decrease vectors Recession illustration. This image shows a downward trend in a stock market chart with people losing money. Vector illustration design using ai tool.
Free with trial Stacked gold coins next to a red downward arrow on a gray grid background, representing financial decline. 3D Rendering. Data analysis decrease illustrations Stack of coins with red downward arrow on grid background. 3D Rendering. Stacked gold coins next to a red downward arrow on a gray grid background, representing financial decline. 3D Rendering
Free with trial Spilled oil beside a sharply downward trending graph, generated by AI, visually represents the dramatic fall in oil prices. The image suggests instability and economic downturn within the oil market. Data analysis decrease illustrations Oil Price Crash. Spilled oil beside a sharply downward trending graph, generated by AI, visually represents the dramatic fall in oil prices. The image suggests instability and economic downturn within the oil market.
Free with trial This image shows a declining bar graph and a person reacting to a financial crisis. Vector illustration design using ai tool. Data analysis decrease vectors Economic collapse is coming. This image shows a declining bar graph and a person reacting to a financial crisis. Vector illustration design using ai tool.
Free with trial Growth layering revenue chart illustration profit income, forecast trends, metrics visualization growth layering revenue chart. Data analysis decrease illustrations Growth layering revenue chart
Free with trial Red arrows pointing downward over a world map symbolize global financial decline. Data analysis decrease vectors Global stock market crash with red falling arrows. Red arrows pointing downward over a world map symbolize global financial decline
Free with trial This image shows a declining stock market graph with red candlesticks and bars. Vector illustration design using ai tool. Data analysis decrease vectors Stock market crash recession. This image shows a declining stock market graph with red candlesticks and bars. Vector illustration design using ai tool.
Free with trial Blue and red lines show economic decline. Vector illustration design using ai tool. Data analysis decrease vectors Recession chart. Blue and red lines show economic decline. Vector illustration design using ai tool.
Free with trial Red trend arrow dropping digital tech abstract futuristic backdrop. Generative AI. Data analysis decrease illustrations Red trend arrow dropping digital tech abstract futuristic backdrop
Free with trial Stacks of golden coins arranged in ascending order, representing financial growth and investment. The background features a blurred stock market graph, symbolizing market trends and investment opportunities. The image conveys concepts of wealth accumulation, financial planning, and economic prosperity. Suitable for illustrating articles, presentations, or advertisements related to finance, investment, and business. Data analysis decrease illustrations Financial Growth and Investment
Free with trial Conceptual financial illustration of a falling stock market index. Red line graph showing sharp decline, volatility, and economic crisis point with a target circle on a dark grid background. Data analysis decrease illustrations Red stock market graph showing economic crash and financial crisis on dark background. Conceptual financial illustration of a falling stock market index. Red. Conceptual financial illustration of a falling stock market index. Red line graph showing sharp decline, volatility, and economic crisis point with a target circle on a dark grid background.
Free with trial A downward trending red arrow, generated by AI, rests on a smartphone displaying a graph, symbolizing a market decline. This visualization is a powerful representation of negative financial trends and economic downturn, ideal for illustrating news reports or financial analyses. Data analysis decrease illustrations Mobile Market Crash. A downward trending red arrow, generated by AI, rests on a smartphone displaying a graph, symbolizing a market decline. This visualization is a powerful representation of negative financial trends and economic downturn, ideal for illustrating news reports or financial analyses.
Free with trial Stock market graph with blue and orange lines showing fluctuations, on futuristic dark background grid Generative AI. Data analysis decrease illustrations Stock market graph with blue and orange lines showing fluctuations, on futuristic dark background grid
Free with trial Stock market graph with blue and orange lines showing fluctuations, on futuristic dark background grid Generative AI. Data analysis decrease illustrations Stock market graph with blue and orange lines showing fluctuations, on futuristic dark background grid
Free with trial A businessman stands with a briefcase, surrounded by declining bar charts and downward arrows. Vector art design using ai tool. Data analysis decrease vectors Stock Market Down Illustration. A businessman stands with a briefcase, surrounded by declining bar charts and downward arrows. Vector art design using ai tool.
Free with trial Investing and Trading vector concept seamless pattern in thin line style. Data analysis decrease vectors Investing and Trading vector seamless pattern in thin line style
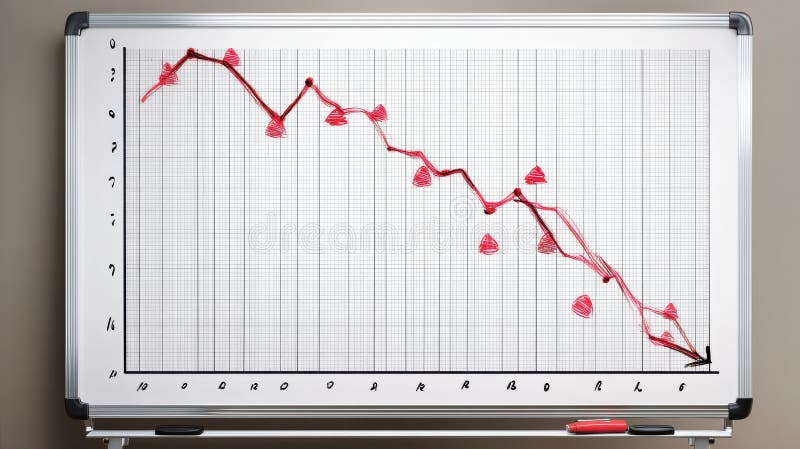
Free with trial A whiteboard displays a hand-drawn graph depicting a significant downward trend, marked by red triangles indicating decreasing values. This visual representation of a negative trend was generated by AI for illustrative purposes, possibly showcasing market decline or economic downturn. Data analysis decrease illustrations Downward Trend Graph. A whiteboard displays a hand-drawn graph depicting a significant downward trend, marked by red triangles indicating decreasing values. This visual representation of a negative trend was generated by AI for illustrative purposes, possibly showcasing market decline or economic downturn.
Free with trial This AI-generated image depicts a bar graph where the bars are covered in a melting, metallic substance, suggesting a market downturn. The dripping metal symbolizes loss and decline, generated by AI for visual representation. Data analysis decrease illustrations Melting Market Graph. This AI-generated image depicts a bar graph where the bars are covered in a melting, metallic substance, suggesting a market downturn. The dripping metal symbolizes loss and decline, generated by AI for visual representation.
Free with trial This image shows a declining bar graph with broken bars and a downward trend line. Vector illustration design using ai tool. Data analysis decrease vectors Stock market crash. This image shows a declining bar graph with broken bars and a downward trend line. Vector illustration design using ai tool.
Free with trial A blue line chart illustrates a downward trend, suggesting decline and loss and can be used to show financial or business performance. Data analysis decrease illustrations Downward Trend Chart. A blue line chart illustrates a downward trend, suggesting decline and loss and can be used to show financial or business performance
Free with trial Digital analyst showcases Bounce Rate on a comprehensive dashboard. Monitoring user retention, pinpointing site issues. Ensuring optimal user experience and web engagement. Flat vector illustration. Data analysis decrease vectors Digital analyst showcases Bounce Rate on a comprehensive dashboard
Free with trial A person analyzing stock market charts with a pointer. Vector art design using ai tool. Data analysis decrease vectors Stock Market Illustration Charts. A person analyzing stock market charts with a pointer. Vector art design using ai tool.
Free with trial A close-up of a stock market chart showing a sharp downturn. The orange line graph against a dark background with gridlines illustrates the volatility and potential risks in financial markets. The image captures the urgency and anxiety associated with market fluctuations. The "MA 1000" text is visib. Data analysis decrease illustrations Stock Market Downturn. A close-up of a stock market chart showing a sharp downturn. The orange line graph against a dark background with gridlines illustrates the volatility and potential risks in financial markets. The image captures the urgency and anxiety associated with market fluctuations. The "MA 1000" text is visib