Free with trial Falling stock exchange prices showing a financial crisis on a digital screen. Data analysis decrease illustrations Stock market crash showing falling prices on digital display in trading room. Falling stock exchange prices showing a financial crisis on a digital screen
Free with trial Downward Chart Showing Decline with Decreasing Bars and Falling Arrow. Data analysis decrease vectors Downward Chart Showing Decline with Decreasing Bars and Falling Arrow
Free with trial This image showcases a vibrant infographic with 3D bar, pie, and line charts. The colorful elements are displayed on a teal platform, ideal for presentations or reports. Data analysis decrease illustrations Colorful 3D Bar Chart, Pie Chart, and Line Graph Infographic on Teal Platform. This image showcases a vibrant infographic with 3D bar, pie, and line charts. The colorful elements are displayed on a teal platform, ideal for presentations or reports.
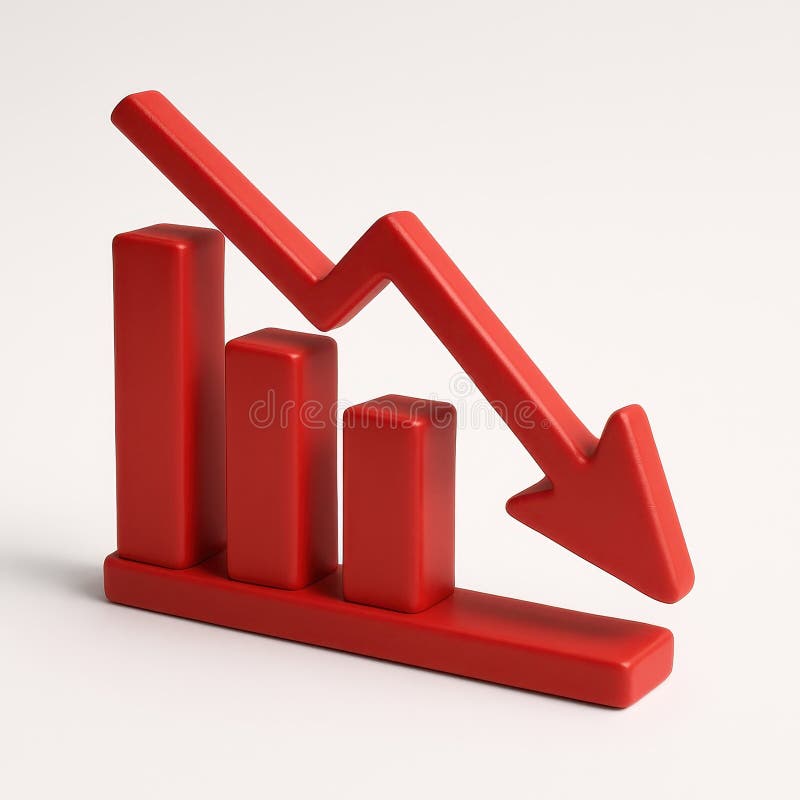
Free with trial Declining bar chart with downward arrow indicates negative trend. Data analysis decrease vectors Declining bar chart with downward arrow indicates negative trend
Free with trial A wooden gavel rests on a sound block atop a graph with a downward trending red line and blue bars. Image. Data analysis decrease illustrations Gavel on Financial Graph. A wooden gavel rests on a sound block atop a graph with a downward trending red line and blue bars. Image
Free with trial Abstract financial graph fluctuating over dark textured surface Images are created using AI. Data analysis decrease illustrations Abstract financial graph fluctuating over dark textured surface
Free with trial Line graph icons set simple clean and smooth line and fill vector icons in black on a white background. Data analysis decrease vectors Line graph icons set simple clean and smooth line and fill vector icons in black
Free with trial A minimalist black outline icon featuring a document with horizontal lines of text. A magnifying glass with a minus symbol inside is positioned over the document, indicating a search or zoom-out function. The icon is presented on a white background. Data analysis decrease illustrations Black Icon of a Document with Magnifying Glass and Minus Symbol on White Background paper. A minimalist black outline icon featuring a document with horizontal lines of text. A magnifying glass with a minus symbol inside is positioned over the document, indicating a search or zoom-out function. The icon is presented on a white background
Free with trial Candlestick chart line icon. Continuous line with share plane. Analytics graph sign. Market analytics symbol. 3d heart in speech bubble. Candlestick chart single line ribbon. Vector. Data analysis decrease vectors Candlestick chart line icon. Analytics graph sign. Continuous line with plane. Vector. Candlestick chart line icon. Continuous line with share plane. Analytics graph sign. Market analytics symbol. 3d heart in speech bubble. Candlestick chart single line ribbon. Vector
Free with trial Image depicting a satisfaction dip alert with a warning sign and a chart showing a decline in satisfaction levels. Data analysis decrease vectors Satisfaction Dip Alert - Warning Sign and Chart Illustrating Decline. Image depicting a satisfaction dip alert with a warning sign and a chart showing a decline in satisfaction levels
Free with trial Laptop displaying a stock market graph with red and green lines indicating a downward trend in share prices. Data analysis decrease illustrations Laptop showing decreasing chart representing stock market crash. Laptop displaying a stock market graph with red and green lines indicating a downward trend in share prices
Free with trial Laptop displaying a stock market graph with red and green lines indicating a downward trend in share prices. Data analysis decrease vectors Laptop showing decreasing chart representing stock market crash. Laptop displaying a stock market graph with red and green lines indicating a downward trend in share prices
Free with trial Pie chart segments, sad face with declining graph, and a grid globe with bars suggest economic downturn. Ideal for finance, global crisis, analytics, investment, statistics, risk and simple flat. Data analysis decrease vectors Financial Decline Concept with Pie Chart, Downward Graph, and Global Representation. Pie chart segments, sad face with declining graph, and a grid globe with bars suggest economic downturn. Ideal for finance, global crisis, analytics, investment, statistics, risk and simple flat
Free with trial Up and down graph icon in line style. Outline bar chart with uptrend and downtrend arrow symbol vector. Data analysis decrease vectors Up and down graph icon in line style. Outline bar chart with uptrend and downtrend arrow symbol
Free with trial Hand holding a house icon with a rising graph and percentage symbols indicating interest rates. Data analysis decrease illustrations Hand holding house icon with rising percentage graph and interes. Hand holding a house icon with a rising graph and percentage symbols indicating interest rates
Free with trial Digita blue bar charts descend steadily across a digital grid, illustrating a decline in financial performance and market trends. Downward arrows emphasize loss, negative growth, and economic challenges, while smooth transitions and a tech-inspired layout enhance the visual impact of the data downturn. Data analysis decrease illustrations Digital blue bar chart with decreasing business concept. Digita blue bar charts descend steadily across a digital grid, illustrating a decline in financial performance and market trends. Downward arrows emphasize loss, negative growth, and economic challenges, while smooth transitions and a tech-inspired layout enhance the visual impact of the data downturn.
Free with trial A stack of yellow coins decreasing in height with red downward arrow symbolizes global financial loss or economic decline. Generative AI. Data analysis decrease illustrations Stack of yellow coins decreasing in height with red downward arrow. Generative AI. A stack of yellow coins decreasing in height with red downward arrow symbolizes global financial loss or economic decline. Generative AI
Free with trial A red line graph against a stormy sky, representing financial crisis. Created with the help of Generative AI tools. Data analysis decrease illustrations A red line graph against a stormy sky, representing financial crisis.
Free with trial Cityscape at sunset with overlayed red stock market graph showing decline. Data analysis decrease illustrations Cityscape at sunset with overlayed red stock market graph showing
Free with trial This image shows a graph depicting a sharp market downturn, generated by AI. The downward trend is emphasized by large black arrows, illustrating a significant and rapid decline. The rolled-up paper suggests the ongoing nature of the crisis, implying further potential losses. Data analysis decrease illustrations Market Crash Visualization. This image shows a graph depicting a sharp market downturn, generated by AI. The downward trend is emphasized by large black arrows, illustrating a significant and rapid decline. The rolled-up paper suggests the ongoing nature of the crisis, implying further potential losses.
Free with trial This striking image depicts a sharply declining stock market graph, generated by AI. The artistic style, combining a distressed frame and ink splatters, emphasizes the volatility and uncertainty of the market downturn. The red line dramatically highlights the severity of the fall. Data analysis decrease illustrations Market Crash Visualization. This striking image depicts a sharply declining stock market graph, generated by AI. The artistic style, combining a distressed frame and ink splatters, emphasizes the volatility and uncertainty of the market downturn. The red line dramatically highlights the severity of the fall.
Free with trial Doodle style bar and line graph icon representing growth and analytics. Data analysis decrease vectors Doodle style bar and line graph icon representing growth and analytics
Free with trial Financial crisis, economic downturn, stock market crash, recession, decreasing profits, falling revenue, business loss, investment loss, financial instability, economic decline, money loss. Data analysis decrease vectors Falling Stock Market Graph Showing Financial Crisis and Recession. Financial crisis, economic downturn, stock market crash, recession, decreasing profits, falling revenue, business loss, investment loss, financial instability, economic decline, money loss.
Free with trial Businessman pointing at cost reduction graph with glowing arrow showing decreasing expenses financial savings business efficiency investment growth and corporate budget strategy concept. Data analysis decrease illustrations Businessman pointing at cost reduction graph with glowing arrow showing decreasing expenses financial savings business efficiency
Free with trial A hand-drawn graph displays a significant downturn, visually depicting economic decline or financial loss. This simplistic illustration can be used to represent business failure, market risk, or a negative trend in various financial and economic analyses. Data analysis decrease illustrations Hand Drawn Graph Showing a Downturn Representing Economic Decline. A hand-drawn graph displays a significant downturn, visually depicting economic decline or financial loss. This simplistic illustration can be used to represent business failure, market risk, or a negative trend in various financial and economic analyses
Free with trial Red glowing arrow made of light and sparks indicates a downward trend. Financial graph showing fall in market value or business decline concept. Data analysis decrease illustrations Red glowing arrow made of light and sparks indicates a downward trend
Free with trial Human showing empty pocket with a decline arrows. Economic recession crisis. No moneyn. Data analysis decrease illustrations Human showing empty pocket with a decline arrows. Economic recession crisis. No money
Free with trial Human showing empty pocket with a decline arrows. Economic recession crisis. No moneyn. Data analysis decrease illustrations Human showing empty pocket with a decline arrows. Economic recession crisis. No money
Free with trial A conceptual infographic visually representing the economic trend of rising prices contrasted with falling income, depicted by upward and downward arrows. Data analysis decrease illustrations Infographic showing rising prices and falling income. A conceptual infographic visually representing the economic trend of rising prices contrasted with falling income, depicted by upward and downward arrows.
Free with trial Presentation board with decreasing bar graph for business statistics. Data analysis decrease vectors Presentation board with decreasing bar graph for business statistics
Free with trial A red, dotted world globe is overlaid with a declining stock market chart, symbolizing a global economic downturn. The image conveys financial crisis and market volatility. Data analysis decrease illustrations Global Market Downturn: Red World Globe with Declining Stock Chart. A red, dotted world globe is overlaid with a declining stock market chart, symbolizing a global economic downturn. The image conveys financial crisis and market volatility
Free with trial Candlestick chart line icon. Halftone dotted pattern. Gradient icon with grain shadow. Analytics graph sign. Market analytics symbol. Line candlestick chart icon. Various designs. Vector. Data analysis decrease vectors Candlestick chart line icon. Analytics graph sign. Halftone dotted pattern. Vector. Candlestick chart line icon. Halftone dotted pattern. Gradient icon with grain shadow. Analytics graph sign. Market analytics symbol. Line candlestick chart icon. Various designs. Vector
Free with trial Bar graph consisting of rectangular blocks in different colors: blue, green, yellow, orange, purple, and pink, decreasing in height. Overlaying the graph is a bold, zigzagging red arrow pointing downward, representing a declining trend. The red arrow contrasts sharply with the pastel-colored bars, emphasizing a negative change or trend. Set against a white background for clarity and focus. Data analysis decrease illustrations Declining Trends: A Bar Graph with a Downward Red Arrow. Generative AI. Bar graph consisting of rectangular blocks in different colors: blue, green, yellow, orange, purple, and pink, decreasing in height. Overlaying the graph is a bold, zigzagging red arrow pointing downward, representing a declining trend. The red arrow contrasts sharply with the pastel-colored bars, emphasizing a negative change or trend. Set against a white background for clarity and focus.
Free with trial Stock market chart showing a downward trend with red and green candlesticks indicating price fluctuations. A moving average line overlays the candlesticks. Volume bars at the bottom correlate with trading activity, mostly red, suggesting higher selling pressure. Vertical axis shows price levels, and horizontal axis depicts time. The chart originates from Cendlewe (Bearits). Candlestick shapes and colors represent price movements over time, with red indicating a decrease and green an increase. Data analysis decrease illustrations Dynamic stock market chart shows downward trend with red and green candlesticks and volume bars. Stock market chart showing a downward trend with red and green candlesticks indicating price fluctuations. A moving average line overlays the candlesticks. Volume bars at the bottom correlate with trading activity, mostly red, suggesting higher selling pressure. Vertical axis shows price levels, and horizontal axis depicts time. The chart originates from Cendlewe (Bearits). Candlestick shapes and colors represent price movements over time, with red indicating a decrease and green an increase.
Free with trial A businessperson looking at declining financial charts during a recession. Data analysis decrease illustrations A businessperson looking at declining financial charts
Free with trial Hand drawn bar chart illustration showing downward trend with arrow. Data analysis decrease vectors Hand drawn bar chart illustration showing downward trend with arrow
Free with trial A digital screen displays a stark red line graph showing a significant downward trend. The graph is set against a grid background, emphasizing the sharp decline. The image conveys a sense of financial loss, economic downturn, or negative performance. Generated by AI. Data analysis decrease illustrations Digital screen displaying a sharp downward trending red line graph. A digital screen displays a stark red line graph showing a significant downward trend. The graph is set against a grid background, emphasizing the sharp decline. The image conveys a sense of financial loss, economic downturn, or negative performance. Generated by AI.
Free with trial CO2 cloud with downward arrows, small graph showing fluctuation and falling coins. Ideal for climate change, sustainability, economy, environment, cost, finance emissions. Simple flat metaphor. Data analysis decrease vectors Carbon Emissions Reduction and Economic Impact Illustrated with Graph and Coin Elements. CO2 cloud with downward arrows, small graph showing fluctuation and falling coins. Ideal for climate change, sustainability, economy, environment, cost, finance emissions. Simple flat metaphor
Free with trial Creative 3D illustration of a sad piggy bank with coins and a falling graph, representing a margin call, financial loss, or trading failure in investment markets. Data analysis decrease illustrations Margin Call Concept with Piggy Bank and Falling Graph Illustration. Creative 3D illustration of a sad piggy bank with coins and a falling graph, representing a margin call, financial loss, or trading failure in investment markets.
Free with trial A striking 3D render visualizes economic decline with a vibrant red bar graph against a clean white background. This impactful image vividly represents a financial crisis and recession, showcasing a clear downward trend through its falling bars and an implied arrow. It symbolizes loss, failure, and potential bankruptcy within the business and finance sectors. Ideal for illustrating articles on the. Data analysis decrease illustrations Red economic decline bar graph depicting financial downfall and negative trends on white background. A striking 3D render visualizes economic decline with a vibrant red bar graph against a clean white background. This impactful image vividly represents a financial crisis and recession, showcasing a clear downward trend through its falling bars and an implied arrow. It symbolizes loss, failure, and potential bankruptcy within the business and finance sectors. Ideal for illustrating articles on the
Free with trial Isolated illustration of a person with a hoodie and line graph. Perfect for business and investment concepts. Data analysis decrease vectors Person with Graph in Hoodie Cartoon - Business, Growth, Investment, Trends. Isolated illustration of a person with a hoodie and line graph. Perfect for business and investment concepts.
Free with trial A person is using a stylus to interact with a digital display showing a graph that illustrates quality improvement alongside cost reduction. Focus on effective business strategies. Data analysis decrease illustrations Quality improvement with cost reduction strategy on digital display. A person is using a stylus to interact with a digital display showing a graph that illustrates quality improvement alongside cost reduction. Focus on effective business strategies
Free with trial Hand drawn downward trending bar graph with arrow indicating decline. Data analysis decrease vectors Hand drawn downward trending bar graph with arrow indicating decline
Free with trial Decreasing bar chart diagram with down arrow showing negative growth. Data analysis decrease vectors Decreasing bar chart diagram with down arrow showing negative growth
Free with trial Conceptual illustration of a document showing market volatility with up and down arrows, and a dollar symbol for currency. Data analysis decrease illustrations Document with up and down arrows showing market volatility and dollar currency sign. Conceptual illustration of a document showing market volatility with up and down arrows, and a dollar symbol for currency
Free with trial Falling bar graph with a red arrow indicating decline and a rising scale. Data analysis decrease vectors Falling bar graph with a red arrow indicating decline and a rising scale
Free with trial A hand-drawn style graph illustrates a concept with fluctuating bars and a descending arrow, indicating decline and progress, perfect for business presentations. Data analysis decrease illustrations Hand-drawn sketch illustrates decline and progress with chart and arrow. A hand-drawn style graph illustrates a concept with fluctuating bars and a descending arrow, indicating decline and progress, perfect for business presentations
Free with trial Energy Consumption Decline Chart. Visual representation of decreasing power utilization trends, indicating effective resource management and environmental efficiency. Data analysis decrease vectors (Energy Consumption Decline Chart. Visual representation of decreasing. Energy Consumption Decline Chart. Visual representation of decreasing power utilization trends, indicating effective resource management and environmental efficiency
Free with trial Simple bar graph showing downward trend with arrow, decline in progress. Data analysis decrease vectors Simple bar graph showing downward trend with arrow, decline in progress
Free with trial A falling graph displayed on an easel, isolated on a white background. The image represents a negative trend, indicating decline in business or finance. Data analysis decrease vectors Illustration of falling graph on easel isolated on transparent background, showing negative trend. A falling graph displayed on an easel, isolated on a white background. The image represents a negative trend, indicating decline in business or finance
Free with trial A man in despair grips his head as a red stock market chart plunges around him, symbolizing financial loss, crisis, and economic downturn. Dark background enhances the mood. Data analysis decrease illustrations Market Crash Despair: Man Grips Head Amidst Plunging Red Stock Chart. A man in despair grips his head as a red stock market chart plunges around him, symbolizing financial loss, crisis, and economic downturn. Dark background enhances the mood
Free with trial Up and down graph icon vector in circular line. Outline bar chart with uptrend and downtrend arrow symbol. Data analysis decrease vectors Up and down graph icon in circular line. Outline bar chart with uptrend and downtrend arrow symbol
Free with trial Graph up and down icon vector in circular line. Outline bar chart with arrow symbol. Analytics concept. Data analysis decrease vectors Graph up and down icon in circular line. Outline bar chart with arrow symbol. Analytics concept
Free with trial Downward trending chart with a declining arrow in vector illustration. Data analysis decrease vectors Downward trending chart with a declining arrow in vector illustration
Free with trial A red arrow indicates a downward trend over a colorful bar graph, isolated on a clean white background. Data analysis decrease illustrations Red downward trend arrow over bar chart isolated on white background. A red arrow indicates a downward trend over a colorful bar graph, isolated on a clean white background
Free with trial Growth and decline graph report icon. Financial chart arrow up and down sign symbol illustration. Data analysis decrease vectors Growth and decline graph report icon. Financial chart arrow up and down sign symbol
Free with trial This 3D rendering showcases stacks of coins alongside a positive growth chart, generated by AI. It visually represents financial success and investment growth, ideal for illustrating financial concepts. Data analysis decrease illustrations AI-Generated Financial Growth. This 3D rendering showcases stacks of coins alongside a positive growth chart, generated by AI. It visually represents financial success and investment growth, ideal for illustrating financial concepts.
Free with trial This image captures a sprawling urban cityscape at dusk, featuring numerous illuminated skyscrapers. A prominent red arrow graphic overlays the scene, indicating a sharp downward trend or decline. The setting sun casts a warm glow on the sky, contrasting with the cool tones of the city lights and buildings. This visual metaphor is ideal for representing financial market crashes, economic recession, business failure, or any concept of negative growth in a metropolitan context. Data analysis decrease illustrations Cityscape Downturn: Financial Decline Overlay on Urban Skyline at Dusk. This image captures a sprawling urban cityscape at dusk, featuring numerous illuminated skyscrapers. A prominent red arrow graphic overlays the scene, indicating a sharp downward trend or decline. The setting sun casts a warm glow on the sky, contrasting with the cool tones of the city lights and buildings. This visual metaphor is ideal for representing financial market crashes, economic recession, business failure, or any concept of negative growth in a metropolitan context.
Free with trial Financial crisis, stock market crash concept with downward red loss trading graph on dark background. 3D rendering. Data analysis decrease illustrations Financial crisis, stock market crash concept with downward red loss trading graph on dark background. 3D rendering
Free with trial A 3D bar chart with a red arrow showing a downward trend. This image symbolizes economic decline, financial issues, and negative business performance. Data analysis decrease illustrations Red arrow showing downward trend on a 3D bar chart representing economic decline. A 3D bar chart with a red arrow showing a downward trend. This image symbolizes economic decline, financial issues, and negative business performance.
Free with trial Red graph showing decreasing trend on blue digital screen, concept of financial crisis and economy recession. Generative AI. Data analysis decrease illustrations Red stock market graph showing decreasing trend on blue digital screen. Red graph showing decreasing trend on blue digital screen, concept of financial crisis and economy recession. Generative AI
Free with trial This image depicts an old blackboard in an empty classroom, symbolizing the shortage of teachers in German schools. The lack of educators has led to a decrease in the number of students attending classes, resulting in empty classrooms. The abandoned blackboard represents the absence of a teacher's guidance, leaving students without proper education and support. The theme of education and its importance is highlighted in this image, emphasizing the need for more teachers to ensure that students receive the education they deserve. Data analysis decrease illustrations Shortage of Teachers in German Schools: Old Blackboard in an Empty Classroom. This image depicts an old blackboard in an empty classroom, symbolizing the shortage of teachers in German schools. The lack of educators has led to a decrease in the number of students attending classes, resulting in empty classrooms. The abandoned blackboard represents the absence of a teacher's guidance, leaving students without proper education and support. The theme of education and its importance is highlighted in this image, emphasizing the need for more teachers to ensure that students receive the education they deserve.
Free with trial Simple, bold line icon of a platform displaying a dynamic financial market chart with currency trading ups and downs. Data analysis decrease vectors Platform showing dynamic up and down financial market currency trading chart icon. Simple, bold line icon of a platform displaying a dynamic financial market chart with currency trading ups and downs
Free with trial This image depicts a vibrant blue calculator positioned next to a colorful bar graph and stack of gold coins, symbolizing financial success and growth. The scene is clean and bright, perfect for illustrating financial concepts. Data analysis decrease illustrations Colorful Calculator, Bar Graph, and Coins Representing Financial Growth. This image depicts a vibrant blue calculator positioned next to a colorful bar graph and stack of gold coins, symbolizing financial success and growth. The scene is clean and bright, perfect for illustrating financial concepts.
Free with trial Vector illustration of decreasing bar graph with arrow, financial concept. Data analysis decrease vectors Vector illustration of decreasing bar graph with arrow, financial concept
Free with trial Broken circular chart graphic symbolizing failure and division with blue and red segments. AI generated. Data analysis decrease vectors Broken circular chart graphic symbolizing failure and division with blue and red segments. AI generated
Free with trial Downward arrow next to analytics dashboard and currency symbol representing financial decline. Ideal for business analytics, finance, investment, economy, budgeting, strategy, simple landing page. Data analysis decrease vectors Financial Loss Illustrated with Downward Arrow, Analytics Dashboard, and Currency Symbol. Downward arrow next to analytics dashboard and currency symbol representing financial decline. Ideal for business analytics, finance, investment, economy, budgeting, strategy, simple landing page
Free with trial Analyze Business Graph with Gold Coins and Pen, Financial Investment Theme , dreamy concept. Data analysis decrease illustrations Analyze Business Graph with Gold Coins and Pen, Financial Investment Theme
Free with trial This 3D rendering depicts financial growth, showcasing stacks of gold coins and black bars representing a rising graph. A golden pen rests on a sleek base, symbolizing the precision and detail involved in financial planning. This image was generated by AI and is perfect for illustrating financial s. Data analysis decrease illustrations Financial Growth Visualization. This 3D rendering depicts financial growth, showcasing stacks of gold coins and black bars representing a rising graph. A golden pen rests on a sleek base, symbolizing the precision and detail involved in financial planning. This image was generated by AI and is perfect for illustrating financial s
Free with trial Curved growth and decline chart icon in flat design. Business trend arrow symbol illustration. Data analysis decrease vectors Curved growth and decline chart icon in flat design. Business trend arrow symbol
Free with trial This image shows a calculator next to colorful 3D bar charts and pie charts illustrating business growth and financial success. The vibrant colors and upward-trending graph create a visually appealing representation of positive financial results. Data analysis decrease illustrations Colorful Calculator and 3D Charts Showing Business Growth. This image shows a calculator next to colorful 3D bar charts and pie charts illustrating business growth and financial success. The vibrant colors and upward-trending graph create a visually appealing representation of positive financial results.
Free with trial Set of nine linear icons illustrating various aspects of business strategy, planning, and progress. The icons feature minimalist line art depicting concepts like mountain peaks symbolizing achievement, graphs showing growth, light bulbs representing ideas, and other business related symbols. Ideal. Data analysis decrease vectors Collection of Linear Icons Representing Business Strategy and Progress. Set of nine linear icons illustrating various aspects of business strategy, planning, and progress. The icons feature minimalist line art depicting concepts like mountain peaks symbolizing achievement, graphs showing growth, light bulbs representing ideas, and other business related symbols. Ideal
Free with trial Business decline icon with downward arrow. Loss, failure, or economic crisis symbol vector in black circle. Data analysis decrease vectors Business decline icon with downward arrow. Loss, failure, or economic crisis symbol in black circle
Free with trial Financial arrow up and down icon on circle line. Growth and decline graph sign symbol illustration. Data analysis decrease vectors Financial arrow up and down icon on circle line. Growth and decline graph sign symbol
Free with trial Percentage drop graph. Economic downturn symbol. Vector illustration. EPS 10. Stock image. Data analysis decrease vectors Percentage drop graph. Economic downturn symbol. Vector illustration. EPS 10.
Free with trial Analyst observing the falling cryptocurrency market with concern and money in hand. Data analysis decrease illustrations Analyst observing falling cryptocurrency market with concern and money in hand
Free with trial Downward-sloping line graph on grid, sad face expressing disappointment, person running away. Ideal for business failure, loss, decline, negative growth, setback, challenge simple flat metaphor. Data analysis decrease illustrations Declining Performance Chart with Sad Face and Running Figure Symbolizing Loss or Failure. Downward-sloping line graph on grid, sad face expressing disappointment, person running away. Ideal for business failure, loss, decline, negative growth, setback, challenge simple flat metaphor
Free with trial A 3D bar chart with a red line graph indicating a significant decline, isolated on a white background. Data analysis decrease illustrations Financial bar chart showing downward trend isolated on white background. A 3D bar chart with a red line graph indicating a significant decline, isolated on a white background
Free with trial A bright red line charts a steep downward trend against a blurred, abstract blue background with horizontal lines. Data analysis decrease illustrations Red downward trending graph line against abstract blue background chart. A bright red line charts a steep downward trend against a blurred, abstract blue background with horizontal lines
Free with trial Financial arrows up and down icon in flat design. Growth and decline graph sign symbol illustration. Data analysis decrease vectors Financial arrows up and down icon in flat design. Growth and decline graph sign symbol