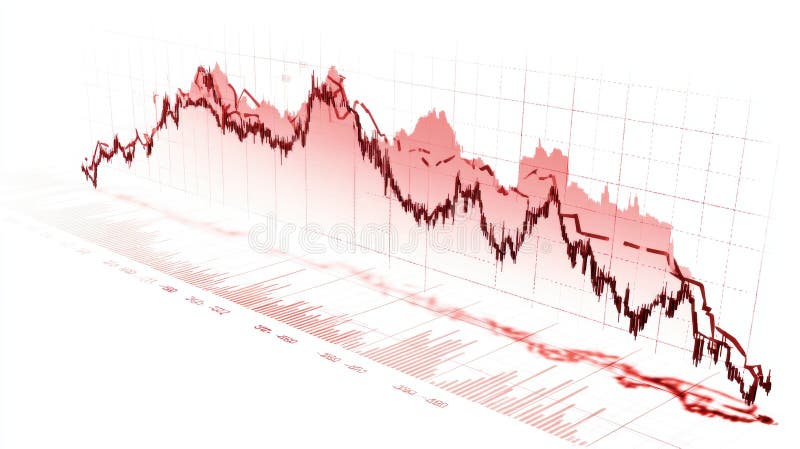
Free with trial This image depicts a sharply declining stock market graph, generated by AI, highlighting the severity of the downturn. The red arrow emphasizes the dramatic fall in market values, representing a potential crisis for investors. Data analysis decrease illustrations Market Crash: Red Alert. This image depicts a sharply declining stock market graph, generated by AI, highlighting the severity of the downturn. The red arrow emphasizes the dramatic fall in market values, representing a potential crisis for investors.
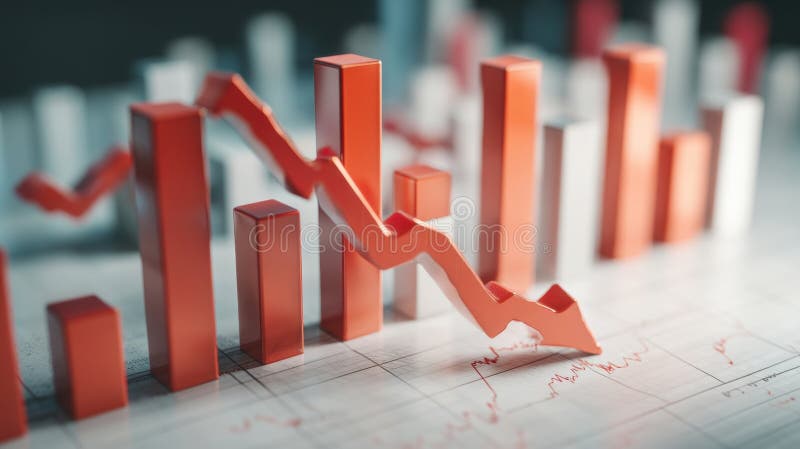
Free with trial A visual representation of a business downturn. This blue bar chart with a descending arrow illustrates a period of negative growth, financial loss, or economic recession. Data analysis decrease vectors Business Decline Graph Vector Icon. A visual representation of a business downturn. This blue bar chart with a descending arrow illustrates a period of negative growth, financial loss, or economic recession
Free with trial Decreasing bar graph behind magnifying glass. 3d render. Data analysis decrease illustrations Decreasing bar graph behind magnifying glass
Free with trial A 3D rendered illustration depicting business growth. The image showcases two upward-trending arrow charts, one in gold and the other in blue, representing positive trends, progress, and success. The charts are set against a clean, light background, emphasizing the upward movement and potential for financial gain. Suitable for illustrating economic growth, investment strategies, and business performance. Data analysis decrease illustrations Growth Chart with Arrows. A 3D rendered illustration depicting business growth. The image showcases two upward-trending arrow charts, one in gold and the other in blue, representing positive trends, progress, and success. The charts are set against a clean, light background, emphasizing the upward movement and potential for financial gain. Suitable for illustrating economic growth, investment strategies, and business performance.
Free with trial A computer displays a dramatic downward trending graph, generated by AI, symbolizing a market crash or economic downturn. The image is a 3D rendering showing a clean, modern workspace setting, highlighting the severity of the financial decline depicted on screen. Data analysis decrease illustrations Market Crash Simulation. A computer displays a dramatic downward trending graph, generated by AI, symbolizing a market crash or economic downturn. The image is a 3D rendering showing a clean, modern workspace setting, highlighting the severity of the financial decline depicted on screen.
Free with trial A man stands in front of a bar and line graph showing a downward trend. Vector art design using ai tool. Data analysis decrease vectors Stock Market Downward Illustration. A man stands in front of a bar and line graph showing a downward trend. Vector art design using ai tool.
Free with trial A vibrant green upward trending arrow signifies growth, progress, and positive development. The arrow's design is visually appealing and represents a successful trajectory. The dark background emphasizes the upward movement. Data analysis decrease illustrations Green Arrow Growth Chart. A vibrant green upward trending arrow signifies growth, progress, and positive development. The arrow's design is visually appealing and represents a successful trajectory. The dark background emphasizes the upward movement.
Free with trial A stock market graph depicting a downturn is shown through a rain-covered window. The image, generated by AI, creates a mood of economic uncertainty and pessimism. The blurred background adds to the overall sense of ambiguity. Data analysis decrease illustrations Rainy Day Market Decline. A stock market graph depicting a downturn is shown through a rain-covered window. The image, generated by AI, creates a mood of economic uncertainty and pessimism. The blurred background adds to the overall sense of ambiguity.
Free with trial A 3D stock market chart displays a bearish trend, with red bars dominating the view. The visual represents downturns in market performance and investor sentiment. Data analysis decrease illustrations Bearish Stock Market Graph. A 3D stock market chart displays a bearish trend, with red bars dominating the view. The visual represents downturns in market performance and investor sentiment.
Free with trial Red downward arrow graph isolated on transparent background. Data analysis decrease illustrations Red downward arrow graph
Free with trial Risk Minimization spotlighted dark or night mode web, landing. Professionals navigate financial charts, with rising arrows denoting growth. Compass points to reduced risk. Flat vector illustration. Data analysis decrease vectors Risk Minimization spotlighted. Professionals navigate financial charts. Risk Minimization spotlighted dark or night mode web, landing. Professionals navigate financial charts, with rising arrows denoting growth. Compass points to reduced risk. Flat vector illustration.
Free with trial A simple, bold red arrow trending downwards against a white background. The arrow zigzags downwards, ending with an arrowhead pointing down, resting on a horizontal red line. This image represents concepts like financial loss, economic downturn, market crash, failure, and negative trends. It's suitable for illustrating articles, presentations, or reports dealing with business, finance, and economics. Data analysis decrease illustrations Red Downward Trend Arrow. A simple, bold red arrow trending downwards against a white background. The arrow zigzags downwards, ending with an arrowhead pointing down, resting on a horizontal red line. This image represents concepts like financial loss, economic downturn, market crash, failure, and negative trends. It's suitable for illustrating articles, presentations, or reports dealing with business, finance, and economics.
Free with trial An abstract financial chart with a downward trend in blue, representing market decline, economic downturn, and potential investment risks in the stock market. Data analysis decrease illustrations Abstract financial chart with downward trend in blue. An abstract financial chart with a downward trend in blue, representing market decline, economic downturn. An abstract financial chart with a downward trend in blue, representing market decline, economic downturn, and potential investment risks in the stock market
Free with trial Decreasing bar graph in ice cube. 3d illustration. Data analysis decrease illustrations Decreasing bar graph in ice cube
Free with trial This image depicts a domino effect illustrating a market crash, with a downward trend generated by AI. The falling dominos symbolize the cascading impact of economic instability, highlighting the fragility of financial systems and the potential for rapid decline. Data analysis decrease illustrations Domino Effect: Market Crash. This image depicts a domino effect illustrating a market crash, with a downward trend generated by AI. The falling dominos symbolize the cascading impact of economic instability, highlighting the fragility of financial systems and the potential for rapid decline.
Free with trial A hand holds a piece of paper showing a sharply declining graph, representing a downturn in the market. The image is generated by AI and symbolizes financial loss or economic recession. Data analysis decrease illustrations Falling Stock Market Graph. A hand holds a piece of paper showing a sharply declining graph, representing a downturn in the market. The image is generated by AI and symbolizes financial loss or economic recession.
Free with trial Graph Down glyph vector icon isolated. Graph Down stock vector icon for web, mobile app and ui design. Data analysis decrease vectors Graph Down glyph vector icon
Free with trial This 3D rendering shows a circular arrangement of red arrows pointing downwards, illustrating a negative trend. The image is generated by AI and is perfect for representing concepts like market decline, economic downturn, or loss. Data analysis decrease illustrations Circular Red Downward Arrow. This 3D rendering shows a circular arrangement of red arrows pointing downwards, illustrating a negative trend. The image is generated by AI and is perfect for representing concepts like market decline, economic downturn, or loss.
Free with trial A graphic illustration featuring two distinct charts on a white background. The upper chart displays three descending lines in black, red, and green, each ending with a downward-pointing arrow. Below this, a bar chart shows three black bars of increasing height, with arrows pointing upwards from the tallest bars. A stylized black graphic element resembling diverging paths or a funnel is positioned. Data analysis decrease vectors Downward and upward trending graphs with arrows chart. A graphic illustration featuring two distinct charts on a white background. The upper chart displays three descending lines in black, red, and green, each ending with a downward-pointing arrow. Below this, a bar chart shows three black bars of increasing height, with arrows pointing upwards from the tallest bars. A stylized black graphic element resembling diverging paths or a funnel is positioned
Free with trial A collection of hand-drawn, black and white icons representing growth, decline, and financial concepts. The set includes upward and downward arrows, percentage symbols, and a bar graph illustrating trends. The simple line art style makes these icons versatile for various applications, including presentations, infographics, and website design. They convey concepts of progress, success, loss, and market fluctuations. Data analysis decrease illustrations Growth and Decline Icons Set. A collection of hand-drawn, black and white icons representing growth, decline, and financial concepts. The set includes upward and downward arrows, percentage symbols, and a bar graph illustrating trends. The simple line art style makes these icons versatile for various applications, including presentations, infographics, and website design. They convey concepts of progress, success, loss, and market fluctuations.
Free with trial A hand holds a piece of paper with a hand-drawn graph showing a sharp decline. The downward trend is clearly visible, indicating a negative development. This image was generated by AI and is ideal for illustrating concepts like economic downturn, market crash, or business failure. Data analysis decrease illustrations Hand Holding Declining Graph. A hand holds a piece of paper with a hand-drawn graph showing a sharp decline. The downward trend is clearly visible, indicating a negative development. This image was generated by AI and is ideal for illustrating concepts like economic downturn, market crash, or business failure.
Free with trial This image showcases a colorful bar graph with a downward-pointing arrow, generated by AI, illustrating a negative trend or decline. The vibrant colors and simplistic design make the message clear and easily understood. The image is perfect for representing economic downturns, market dips, or any s. Data analysis decrease illustrations Downward Trend Visualization. This image showcases a colorful bar graph with a downward-pointing arrow, generated by AI, illustrating a negative trend or decline. The vibrant colors and simplistic design make the message clear and easily understood. The image is perfect for representing economic downturns, market dips, or any s
Free with trial Revenue absorbing sales graph illustration growth metrics, visualization insights, forecast dashboard revenue absorbing sales graph. Data analysis decrease illustrations Revenue absorbing sales graph
Free with trial A collection of solid icons depicting coin stacks and growth charts, presented isolated on a clean white background. Data analysis decrease vectors Rising coin wealth solid icons. A collection of solid icons depicting coin stacks and growth charts, presented isolated on a clean white background
Free with trial Hand drawn charts and clock showing business growth and speed. Data analysis decrease illustrations Business Growth Speed Concept. Hand drawn charts and clock showing business growth and speed
Free with trial This image depicts a dramatic stock market decline, visualized as a falling graph in intense orange and red hues, generated by AI. The dark background emphasizes the severity of the downturn, suggesting potential financial instability or market volatility. The bokeh effect adds a sense of depth and. Data analysis decrease illustrations AI-Generated Stock Market Dip. This image depicts a dramatic stock market decline, visualized as a falling graph in intense orange and red hues, generated by AI. The dark background emphasizes the severity of the downturn, suggesting potential financial instability or market volatility. The bokeh effect adds a sense of depth and
Free with trial This image shows a red arrow sinking into clear water, creating a splash. The arrow, generated by AI, symbolizes a downward trend or decline, perhaps in market values or other metrics. The high-quality rendering emphasizes the impact and visual appeal. Data analysis decrease illustrations Red Arrow Plunging into Water. This image shows a red arrow sinking into clear water, creating a splash. The arrow, generated by AI, symbolizes a downward trend or decline, perhaps in market values or other metrics. The high-quality rendering emphasizes the impact and visual appeal.
Free with trial Analytics morphing sales graph illustration growth metrics, dashboard insights, revenue forecast analytics morphing sales graph. Data analysis decrease illustrations Analytics morphing sales graph
Free with trial A digital screen shows a sharp decline in stock market indices, indicated by a red arrow and graph. Numbers flash, reflecting significant losses. Data analysis decrease illustrations Stock Market Crash. A digital screen shows a sharp decline in stock market indices, indicated by a red arrow and graph. Numbers flash, reflecting significant losses
Free with trial A robotic arm interacts with a declining green graph, generated by AI. This futuristic image symbolizes automation's impact on production, potentially highlighting efficiency drops or market downturns within a technologically advanced manufacturing setting. The scene suggests technological challeng. Data analysis decrease illustrations AI-Generated Production Decline. A robotic arm interacts with a declining green graph, generated by AI. This futuristic image symbolizes automation's impact on production, potentially highlighting efficiency drops or market downturns within a technologically advanced manufacturing setting. The scene suggests technological challeng
Free with trial This image, generated by AI, depicts a hand placing a small, metallic object onto a graph showing a sharp market decline. It visually represents the fragility and potential for sudden drops in financial markets. The image is a high-quality 3D rendering. Data analysis decrease illustrations AI-Generated Market Crash Image. This image, generated by AI, depicts a hand placing a small, metallic object onto a graph showing a sharp market decline. It visually represents the fragility and potential for sudden drops in financial markets. The image is a high-quality 3D rendering.
Free with trial Up-Down 3D Icon isolated on white background. Data analysis decrease illustrations Up-Down 3D Icon isolated on white background
Free with trial Loss money arrow bar graph icon on white background depicting financial decline. Data analysis decrease illustrations Loss money arrow bar graph icon
Free with trial Cost reduction concept. Businesswoman pointing down arrow of the graph with cost reduction business finance on virtual screen. Business, technology, cost management, cut budget. Data analysis decrease illustrations Cost reduction concept. Businesswoman pointing down arrow of the graph with cost reduction business finance on virtual screen.
Free with trial Stacks of transparent glass coins depict a downward trend, generated by AI, symbolizing financial downturn or economic recession. The image uses a dark background to highlight the contrast between the fragility of the glass coins and the severity of the market decline. Data analysis decrease illustrations AI-Generated Glass Coin Decline. Stacks of transparent glass coins depict a downward trend, generated by AI, symbolizing financial downturn or economic recession. The image uses a dark background to highlight the contrast between the fragility of the glass coins and the severity of the market decline.
Free with trial A man holding his head while looking at a falling stock market chart. Data analysis decrease illustrations Man Facing Stock Market Downturn. A man holding his head while looking at a falling stock market chart
Free with trial A 3D render shows two gold coins and a red downward trending arrow on a black surface within an open beige case. The case is angled with the lid open, revealing a dark interior. The objects are rendered with a smooth, glossy finish against a clean white background. Data analysis decrease illustrations Gold coins red down arrow red arrow down trend. A 3D render shows two gold coins and a red downward trending arrow on a black surface within an open beige case. The case is angled with the lid open, revealing a dark interior. The objects are rendered with a smooth, glossy finish against a clean white background
Free with trial A conceptual illustration depicting the effects of inflation on long-term investments. The image features golden coins, stacked and scattered, alongside a rising arrow graph, and bar charts, all symbolizing financial growth and the challenges posed by inflation. The overall design conveys the concept of the impact of inflation on investment strategies and financial planning. Suitable for articles, presentations, and educational materials related to economics and finance. Data analysis decrease illustrations Inflation\'s Impact on Long-Term Investments. A conceptual illustration depicting the effects of inflation on long-term investments. The image features golden coins, stacked and scattered, alongside a rising arrow graph, and bar charts, all symbolizing financial growth and the challenges posed by inflation. The overall design conveys the concept of the impact of inflation on investment strategies and financial planning. Suitable for articles, presentations, and educational materials related to economics and finance.
Free with trial Visualization shifting line graph illustration fluctuation increase, movement change, axis scale visualization shifting line graph. Data analysis decrease illustrations Visualization shifting line graph
Free with trial View of Graphs showing declining CO₂ emissions. Data analysis decrease illustrations Graphs showing declining CO₂ emissions
Free with trial View of Graphs showing declining CO₂ emissions. Data analysis decrease illustrations Graphs showing declining CO₂ emissions
Free with trial View of Graphs showing declining CO₂ emissions. Data analysis decrease illustrations Graphs showing declining CO₂ emissions
Free with trial A businessman in a suit interacts with a digital interface illustrating the relationship between quality and cost. The image features a visual representation of increasing quality and decreasing cost, with checkmarks indicating positive outcomes. This concept is ideal for illustrating business strategies, efficiency, and financial planning. The scene includes a clipboard with charts, adding a professional context. Data analysis decrease illustrations Quality vs. Cost: Business Concept. A businessman in a suit interacts with a digital interface illustrating the relationship between quality and cost. The image features a visual representation of increasing quality and decreasing cost, with checkmarks indicating positive outcomes. This concept is ideal for illustrating business strategies, efficiency, and financial planning. The scene includes a clipboard with charts, adding a professional context.
Free with trial Visualization blinking sales graph illustration performance revenue, metrics dashboard, insights forecast visualization blinking sales graph. Data analysis decrease illustrations Visualization blinking sales graph
Free with trial The stock market crash is depicted with a red graph, symbolizing financial loss and economic decline. The crisis represents a significant downturn in investment. Data analysis decrease illustrations Stock market crash with red graph. The stock market crash is depicted with a red graph, symbolizing financial loss and economic decline. The crisis represents a significant downturn in investment.
Free with trial This 3D rendering shows a stylized stock market chart, generated by AI, displayed on a sleek, blue metallic stand. The vibrant blue color and modern design make it visually appealing and ideal for representing technological advancements in finance. Data analysis decrease illustrations AI-Generated Stock Market Display. This 3D rendering shows a stylized stock market chart, generated by AI, displayed on a sleek, blue metallic stand. The vibrant blue color and modern design make it visually appealing and ideal for representing technological advancements in finance.
Free with trial Isometric bar graph with decreasing trend shows negative financial results with dollar bills and coins, representing economic downturn and financial crisis. Data analysis decrease vectors Isometric bar graph with decreasing trend shows negative financial results with dollar bills and coins, representing
Free with trial Finance stock market crisis and chart arrow down red background. vector illustration fantastic technology. Data analysis decrease vectors Finance stock market crisis and chart arrow down red background.
Free with trial Logo concept featuring a downward trending arrow representing regression. Data analysis decrease vectors Regression logo concept featuring a downward trending arrow. Logo concept featuring a downward trending arrow representing regression
Free with trial Businessman Analyzing Declining Red Bar Chart. High quality illustration. Data analysis decrease illustrations Businessman Analyzing Declining Red Bar Chart
Free with trial A stylized illustration depicts a bar chart with blue bars of varying heights against a dark blue grid background. A prominent red and yellow arrow, symbolizing a downward trend, dramatically descends across the chart. This graphic represents financial decline, market crash, economic recession, or negative growth. Its clean, vector-style design makes it suitable for presentations, reports, and articles on business, finance, and economics. Data analysis decrease illustrations Declining Bar Chart with Red Arrow. A stylized illustration depicts a bar chart with blue bars of varying heights against a dark blue grid background. A prominent red and yellow arrow, symbolizing a downward trend, dramatically descends across the chart. This graphic represents financial decline, market crash, economic recession, or negative growth. Its clean, vector-style design makes it suitable for presentations, reports, and articles on business, finance, and economics.
Free with trial Downward trend arrow and percentage symbol isolated on a white background, representing financial or economic decline. 3D Rendering. Data analysis decrease illustrations Downward trend arrow and percentage symbol on a white background. 3D Rendering. Downward trend arrow and percentage symbol isolated on a white background, representing financial or economic decline. 3D Rendering
Free with trial Glass down arrow sign with the word Down. Data analysis decrease illustrations Glass down arrow sign with the word Down.
Free with trial This image showcases a downward trending graph, generated by AI, represented by a red arrow descending within a transparent glass structure. The visual effectively communicates decline or negative growth. The clean, minimalist design enhances the impact of the falling trend. Data analysis decrease illustrations Decreasing Trend: AI-Generated Graph. This image showcases a downward trending graph, generated by AI, represented by a red arrow descending within a transparent glass structure. The visual effectively communicates decline or negative growth. The clean, minimalist design enhances the impact of the falling trend.
Free with trial A hand holding a piece of paper with a graph on it. The graph shows a downward trend, which could indicate a decrease in sales or a decline in a particular metric. Data analysis decrease illustrations A hand holding a piece of paper with a graph on it
Free with trial This vibrant illustration depicts financial growth, showcasing a dramatic upward trend after an initial decline. The 3D bar chart and upward arrow, generated by AI, symbolize overcoming challenges and achieving significant financial success. The gold coin further emphasizes the positive outcome. Data analysis decrease illustrations AI-Generated Financial Growth Chart. This vibrant illustration depicts financial growth, showcasing a dramatic upward trend after an initial decline. The 3D bar chart and upward arrow, generated by AI, symbolize overcoming challenges and achieving significant financial success. The gold coin further emphasizes the positive outcome.
Free with trial A striking white sculpture, generated by AI, depicts a figure slumping as a descending graph dramatically falls to the ground, symbolizing market downturn or economic crisis. The stark contrast between the white sculpture and the gray background emphasizes the gravity of the situation. The image i. Data analysis decrease illustrations AI-Generated Sculpture: Market Crash. A striking white sculpture, generated by AI, depicts a figure slumping as a descending graph dramatically falls to the ground, symbolizing market downturn or economic crisis. The stark contrast between the white sculpture and the gray background emphasizes the gravity of the situation. The image i
Free with trial This image depicts a dramatic market decline, visualized as a 3D graph showing a sharp downward trend. The red color emphasizes the severity of the losses, and the detailed chart is generated by AI, offering a realistic representation of financial instability. It can be used to illustrate economic. Data analysis decrease illustrations Red Market Crash Graph. This image depicts a dramatic market decline, visualized as a 3D graph showing a sharp downward trend. The red color emphasizes the severity of the losses, and the detailed chart is generated by AI, offering a realistic representation of financial instability. It can be used to illustrate economic
Free with trial The image shows a series of colorful wooden blocks arranged in ascending order of height, resembling a bar graph. the blocks are placed on a weathered wooden surface, adding a rustic and natural feel to the composition. the colors of the blocks range from orange to purple, creating a visually appealing gradient. the background is blurred, suggesting an outdoor setting with natural light filtering through. the focus is on the blocks, highlighting their texture and the interplay of colors. Data analysis decrease illustrations Colorful wooden blocks on rustic wood surface. the image shows a series of colorful wooden blocks arranged in ascending order of height, resembling a bar graph. the blocks are placed on a weathered wooden surface, adding a rustic and natural feel to the composition. the colors of the blocks range from orange to purple, creating a visually appealing gradient. the background is blurred, suggesting an outdoor setting with natural light filtering through. the focus is on the blocks, highlighting their texture and the interplay of colors.
Free with trial This image depicts a 3D rendering of a downward trending graph, generated by AI, showcasing a clear visual representation of market decline or economic downturn. The red bars and arrow emphasize the severity of the fall, suggesting potential financial instability or crisis. Data analysis decrease illustrations Declining Market Trends. This image depicts a 3D rendering of a downward trending graph, generated by AI, showcasing a clear visual representation of market decline or economic downturn. The red bars and arrow emphasize the severity of the fall, suggesting potential financial instability or crisis.
Free with trial This image depicts a downward trending graph, generated by AI, illustrating a sharp decline in market performance. The 3D rendered red arrow emphasizes the severity of the fall. It symbolizes economic downturn, financial crisis, or market instability. Data analysis decrease illustrations Declining Market Trends. This image depicts a downward trending graph, generated by AI, illustrating a sharp decline in market performance. The 3D rendered red arrow emphasizes the severity of the fall. It symbolizes economic downturn, financial crisis, or market instability.
Free with trial Graphic illustration of a downward trending red arrow over blue and red vertical bar graph on a light grey background. Image. Data analysis decrease illustrations Bar Graph with Decreasing Trend Line. Graphic illustration of a downward trending red arrow over blue and red vertical bar graph on a light grey background. Image
Free with trial Money flow concept with a dollar sign inside a square with up and down arrows. Data analysis decrease vectors Money flow with up and down arrows inside square. Money flow concept with a dollar sign inside a square with up and down arrows
Free with trial A worrying business report showing a sharp decline, generated by AI, rests on a wooden desk in an office setting. The red graph line dramatically falls, symbolizing potential losses or market downturn. This AI-generated image is perfect for illustrating financial instability or economic crisis. Data analysis decrease illustrations Declining Business Graph. A worrying business report showing a sharp decline, generated by AI, rests on a wooden desk in an office setting. The red graph line dramatically falls, symbolizing potential losses or market downturn. This AI-generated image is perfect for illustrating financial instability or economic crisis.
Free with trial Red 3D 1% Percentage Symbol for Finance and Discount Concepts. Data analysis decrease illustrations Red 3D 1% Percentage Symbol for Finance
Free with trial Vector icon of a downward arrow or falling graph, symbolizing financial decline, loss trends, market crash, and negative economic performance. Ideal for finance apps, investment platforms, business reports, stock market analysis, and economic infographics. Clean, impactful, and scalable for both digital and print use. Data analysis decrease vectors Financial Decline Trend Loss Graph Icon. Vector icon of a downward arrow or falling graph, symbolizing financial decline, loss trends, market crash, and negative economic performance. Ideal for finance apps, investment platforms, business reports, stock market analysis, and economic infographics. Clean, impactful, and scalable for both digital and print use.
Free with trial Financial chart with red and orange bars on a dark background. Concept of market crash, recession, and falling stock index. 3D Rendering. Data analysis decrease illustrations Financial chart displaying a downward trend with red and orange bars. 3D Rendering. Financial chart with red and orange bars on a dark background. Concept of market crash, recession, and falling stock index. 3D Rendering
Free with trial Area chart graph is going down showing market volatility. Data analysis decrease vectors Red area chart graph showing market volatility going down. Area chart graph is going down showing market volatility
Free with trial Illustration of scissors cutting into a stack of paper; stacks decreasing in height. Gold and turquoise palette. Image. Data analysis decrease illustrations Scissors Cutting a Stacked Paper Graph. Illustration of scissors cutting into a stack of paper; stacks decreasing in height. Gold and turquoise palette. Image
Free with trial This simple icon depicts a line graph with one line trending upwards and one trending downwards. Data analysis decrease vectors Line graph showing upward and downward trends icon. This simple icon depicts a line graph with one line trending upwards and one trending downwards
Free with trial Money graphs show growth with bars and charts rising on paper. Data analysis decrease illustrations Money graphs show growth with bars and charts rising on paper
Free with trial A red line graph with an arrow is trending downward, signifying loss or failure for financial reporting. Data analysis decrease illustrations Red Line Graph Decreasing. A red line graph with an arrow is trending downward, signifying loss or failure for financial reporting
Free with trial A minimalist 3D rendering showcases a bar chart with an upward arrow and a diverging arrow on a round platform, symbolizing business growth and decline and is suitable for presentations or website graphics. Data analysis decrease illustrations 3d Bar Chart with Arrow, Growth Concept. A minimalist 3D rendering showcases a bar chart with an upward arrow and a diverging arrow on a round platform, symbolizing business growth and decline and is suitable for presentations or website graphics
Free with trial Stock prices falling during trading session on a laptop at the nyse. Data analysis decrease illustrations Stock market crashing on laptop at new york stock exchange. Stock prices falling during trading session on a laptop at the nyse
Free with trial A modern minus sign icon designed for calculations. Data analysis decrease vectors Modern Minus Sign Icon for Calculations. A modern minus sign icon designed for calculations.
Free with trial Uptrend and downtrend arrow icon set. Vectors. Data analysis decrease illustrations Uptrend and downtrend arrow icon set. Vectors
Free with trial Reduction chart icon set in thin line outline style and linear vector sign. Data analysis decrease vectors Reduction chart icon Flat simple outline set. Reduction chart icon set in thin line outline style and linear vector sign
Free with trial This striking image depicts a downward arrow crashing through a globe, symbolizing market decline. The glowing red elements evoke urgency in financial analytics. Data analysis decrease illustrations Downward Arrow Crashing Through the Globe Concept. This striking image depicts a downward arrow crashing through a globe, symbolizing market decline. The glowing red elements evoke urgency in financial analytics
Free with trial An abstract vector illustration depicting a dynamic concept of flow and direction. Data analysis decrease vectors Red Arrow Indicating Flow and Direction. An abstract vector illustration depicting a dynamic concept of flow and direction
Free with trial Mobile app uninstall rate affects user retention and engagement. Tracking uninstall analytics helps optimize app performance, reduce churn, improve mobile app marketing strategies vector illustration. Data analysis decrease vectors Mobile app uninstall rate affects user retention and engagement. Tracking uninstall analytics helps optimize app