Free with trial Tree illustration with bar graph displaying decrease in carbon emissions from wood pellets, Generated by AI. Data decrease illustrations Tree illustration with bar graph displaying decrease in carbon emissions from wood pellets
Free with trial The flag of Malta with declining stock market graph and financial data overlay, symbolizing economic downturn, recession, or bearish market trends. Data decrease illustrations The flag of Malta with declining stock market graph and financial data overlay
Free with trial The flag of Chile with declining stock market graph and financial data overlay, symbolizing economic downturn, recession, or bearish market trends. Data decrease illustrations The flag of Chile with declining stock market graph and financial data overlay
Free with trial Flag with a declining bar chart and down arrows, symbolizing decline in data, performance, or various national indicators in the. Data decrease illustrations Flag with a declining bar chart and down arrows, symbolizing decline in data, performance, or various national indicators in the
Free with trial Gambia flag with a declining bar chart and down arrows, symbolizing decline in data, performance, or various national indicators. Data decrease illustrations Flag with a declining bar chart and down arrows, symbolizing decline in data, performance, or various national indicators in the
Free with trial Germany flag with a declining bar chart and down arrows, symbolizing decline in data, performance, or various national indicators. Data decrease illustrations Flag with a declining bar chart and down arrows, symbolizing decline in data, performance, or various national indicators in the
Free with trial Estonia flag with a declining bar chart and down arrows, symbolizing decline in data, performance, or various national indicators. Data decrease illustrations Flag with a declining bar chart and down arrows, symbolizing decline in data, performance, or various national indicators in the
Free with trial Azerbaijan flag with a declining bar chart and down arrows, symbolizing decline in data, performance, or various national indicators. Data decrease illustrations Flag with a declining bar chart and down arrows, symbolizing decline in data, performance, or various national indicators in the
Free with trial Burkina Faso flag with a declining bar chart and down arrows, symbolizing decline in data, performance, or various national indicators. Data decrease illustrations Flag with a declining bar chart and down arrows, symbolizing decline in data, performance, or various national indicators in the
Free with trial Bangladesh flag with a declining bar chart and down arrows, symbolizing decline in data, performance, or various national indicators. Data decrease illustrations Flag with a declining bar chart and down arrows, symbolizing decline in data, performance, or various national indicators in the
Free with trial Cameroon flag with a declining bar chart and down arrows, symbolizing decline in data, performance, or various national indicators. Data decrease illustrations Flag with a declining bar chart and down arrows, symbolizing decline in data, performance, or various national indicators in the
Free with trial Czech Republic flag with a declining bar chart and down arrows, symbolizing decline in data, performance, or various national indicators. Data decrease illustrations Flag with a declining bar chart and down arrows, symbolizing decline in data, performance, or various national indicators in the. Czech Republic flag with a declining bar chart and down arrows, symbolizing decline in data, performance, or various national indicators
Free with trial Botswana flag with a declining bar chart and down arrows, symbolizing decline in data, performance, or various national indicators. Data decrease illustrations Flag with a declining bar chart and down arrows, symbolizing decline in data, performance, or various national indicators in the
Free with trial Finland flag with a declining bar chart and down arrows, symbolizing decline in data, performance, or various national indicators. Data decrease illustrations Flag with a declining bar chart and down arrows, symbolizing decline in data, performance, or various national indicators in the
Free with trial Costa Rica flag with a declining bar chart and down arrows, symbolizing decline in data, performance, or various national indicators. Data decrease illustrations Flag with a declining bar chart and down arrows, symbolizing decline in data, performance, or various national indicators in the
Free with trial Cyprus flag with a declining bar chart and down arrows, symbolizing decline in data, performance, or various national indicators. Data decrease illustrations Flag with a declining bar chart and down arrows, symbolizing decline in data, performance, or various national indicators in the
Free with trial Flag with a declining bar chart and down arrows, symbolizing decline in data, performance, or various national indicators in the. Data decrease illustrations Flag with a declining bar chart and down arrows, symbolizing decline in data, performance, or various national indicators in the
Free with trial Flag with a declining bar chart and down arrows, symbolizing decline in data, performance, or various national indicators in the. Data decrease illustrations Flag with a declining bar chart and down arrows, symbolizing decline in data, performance, or various national indicators in the
Free with trial Bahamas flag with a declining bar chart and down arrows, symbolizing decline in data, performance, or various national indicators. Data decrease illustrations Flag with a declining bar chart and down arrows, symbolizing decline in data, performance, or various national indicators in the
Free with trial Belgium flag with a declining bar chart and down arrows, symbolizing decline in data, performance, or various national indicators. Data decrease illustrations Flag with a declining bar chart and down arrows, symbolizing decline in data, performance, or various national indicators in the
Free with trial Denmark flag with a declining bar chart and down arrows, symbolizing decline in data, performance, or various national indicators. Data decrease illustrations Flag with a declining bar chart and down arrows, symbolizing decline in data, performance, or various national indicators in the
Free with trial Bulgaria flag with a declining bar chart and down arrows, symbolizing decline in data, performance, or various national indicators. Data decrease illustrations Flag with a declining bar chart and down arrows, symbolizing decline in data, performance, or various national indicators in the
Free with trial France flag with a declining bar chart and down arrows, symbolizing decline in data, performance, or various national indicators. Data decrease illustrations Flag with a declining bar chart and down arrows, symbolizing decline in data, performance, or various national indicators in the
Free with trial Canada flag with a declining bar chart and down arrows, symbolizing decline in data, performance, or various national indicators. Data decrease illustrations Flag with a declining bar chart and down arrows, symbolizing decline in data, performance, or various national indicators in the
Free with trial Colombia flag with a declining bar chart and down arrows, symbolizing decline in data, performance, or various national indicators. Data decrease illustrations Flag with a declining bar chart and down arrows, symbolizing decline in data, performance, or various national indicators in the
Free with trial Algeria flag with a declining bar chart and down arrows, symbolizing decline in data, performance, or various national indicators. Data decrease illustrations Flag with a declining bar chart and down arrows, symbolizing decline in data, performance, or various national indicators in the
Free with trial Bolivia flag with a declining bar chart and down arrows, symbolizing decline in data, performance, or various national indicators. Data decrease illustrations Flag with a declining bar chart and down arrows, symbolizing decline in data, performance, or various national indicators in the
Free with trial Bahrain flag with a declining bar chart and down arrows, symbolizing decline in data, performance, or various national indicators. Data decrease illustrations Flag with a declining bar chart and down arrows, symbolizing decline in data, performance, or various national indicators in the
Free with trial Flag with a declining bar chart and down arrows, symbolizing decline in data, performance, or various national indicators in the. Data decrease illustrations Flag with a declining bar chart and down arrows, symbolizing decline in data, performance, or various national indicators in the
Free with trial Albania flag with a declining bar chart and down arrows, symbolizing decline in data, performance, or various national indicators. Data decrease illustrations Flag with a declining bar chart and down arrows, symbolizing decline in data, performance, or various national indicators in the
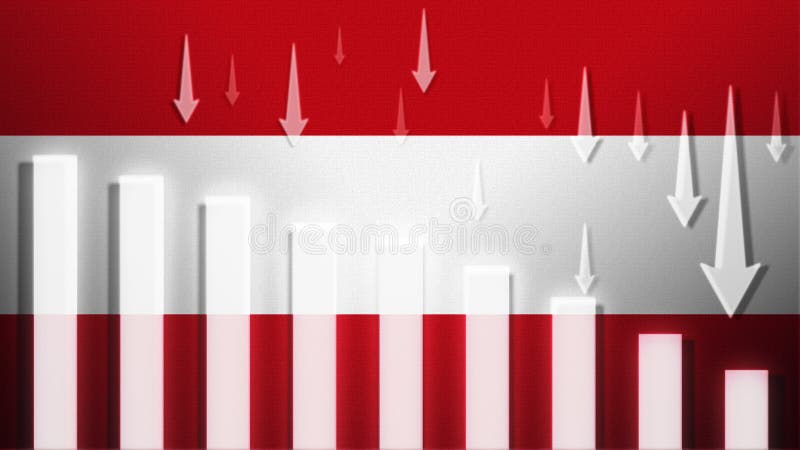
Free with trial Austria flag with a declining bar chart and down arrows, symbolizing decline in data, performance, or various national indicators. Data decrease illustrations Flag with a declining bar chart and down arrows, symbolizing decline in data, performance, or various national indicators in the
Free with trial Argentina flag with a declining bar chart and down arrows, symbolizing decline in data, performance, or various national indicators. Data decrease illustrations Flag with a declining bar chart and down arrows, symbolizing decline in data, performance, or various national indicators in the
Free with trial Tree illustration with bar graph displaying decrease in carbon emissions through wood pellets, Generated by AI. Data decrease illustrations Tree illustration with bar graph displaying decrease in carbon emissions through wood pellets
Free with trial Colorful line graph showing growth and decline of different data from 2018, 2019 and 2020, providing a visual representation of performance trends over time. Data decrease vectors Colorful line graph showing growth and decline of different data from 2018, 2019 and 2020, providing a visual
Free with trial This image displays a candlestick chart on a white background, illustrating financial data over a period of time. The chart features green and red candlesticks representing price movements, with green indicating an increase and red indicating a decrease. The chart is accompanied by a vertical axis showing price levels and a horizontal axis indicating time periods from 2008 to 2018. Data decrease illustrations Candlestick chart data isolated on white background. This image displays a candlestick chart on a white background, illustrating financial data over a period of time. The chart features green and red candlesticks representing price movements, with green indicating an increase and red indicating a decrease. The chart is accompanied by a vertical axis showing price levels and a horizontal axis indicating time periods from 2008 to 2018
Free with trial A detailed line graph visualization titled Global Climate Trends presents annual data from 2011 through 2013, plotting precipitation levels and CO2 emissions on the y-axis against years on the x-axis, where a blue line indicates a steady increase in precipitation over time, a green line shows corresponding CO2 levels, and a separate green trend line suggests a potential decrease in another. Data decrease illustrations A line graph showing global climate trends from 2011 to 2013 with precipitation and CO2 levels visualized in blue and green. A detailed line graph visualization. A detailed line graph visualization titled Global Climate Trends presents annual data from 2011 through 2013, plotting precipitation levels and CO2 emissions on the y-axis against years on the x-axis, where a blue line indicates a steady increase in precipitation over time, a green line shows corresponding CO2 levels, and a separate green trend line suggests a potential decrease in another
Free with trial A business executive, dressed in a professional suit, meticulously analyzes a carbon reduction strategy on a digital tablet, visualizing a clear downward trend in emissions. This image captures the essence of sustainability and commitment to an eco-friendly future. Displaying projected data for 2022, 2025, 2030, 2040, and 2050, the presentation highlights a net zero ambition. The businessman's. Data decrease illustrations Business executive demonstrating carbon reduction strategy with visual data on a digital tablet for a sustainable future. A business executive, dressed in a professional suit, meticulously analyzes a carbon reduction strategy on a digital tablet, visualizing a clear downward trend in emissions. This image captures the essence of sustainability and commitment to an eco-friendly future. Displaying projected data for 2022, 2025, 2030, 2040, and 2050, the presentation highlights a net zero ambition. The businessman's
Free with trial Data charts shown on mobile devices displayed with a bar graph represent growth and financial analysis on a tech interface Perfect for illustrating investment or business trends. Data decrease illustrations Analyzing Stock Market Data with Mobile Tech and Bar Graph. Data charts shown on mobile devices displayed with a bar graph represent growth and financial analysis on a tech interface Perfect for illustrating investment or business trends
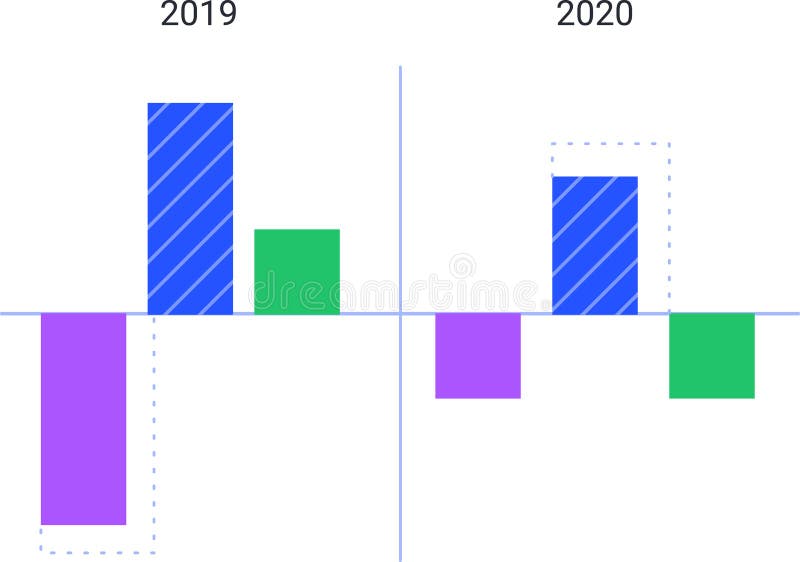
Free with trial Colorful bar charts are comparing data from 2019 and 2020, visualizing trends and statistics with positive and negative values represented by upward and downward bars. Data decrease vectors Colorful bar charts are comparing data from 2019 and 2020, visualizing trends and statistics with positive and negative
Free with trial Colorful bar charts are comparing data from 2019 and 2020, visualizing trends and statistics with positive and negative values represented by upward and downward bars. Data decrease illustrations Colorful bar charts are comparing data from 2019 and 2020, visualizing trends and statistics with positive and negative
Free with trial A digital graphic with a percent symbols in red next to an American flag, depicting data or economic trends or tariffs. Data decrease illustrations A digital graphic with a percent symbols in red next to an American flag, depicting data or economic trends or tariffs
Free with trial A digital graphic with a percent symbols in red next to an American flag, depicting data or economic trends or tariffs. Data decrease illustrations A digital graphic with a percent symbols in red next to an American flag, depicting data or economic trends or tariffs
Free with trial A digital graphic with a percent symbols in red next to an American flag, depicting data or economic trends or tariffs. Data decrease illustrations A digital graphic with a percent symbols in red next to an American flag, depicting data or economic trends or tariffs
Free with trial A digital graphic with a percent symbols in red next to an American flag, depicting data or economic trends or tariffs. Data decrease illustrations A digital graphic with a percent symbols in red next to an American flag, depicting data or economic trends or tariffs
Free with trial Abstract financial chart with red bars and lines representing market decline, emphasizing data analysis and economics. Generative AI. Data decrease illustrations Abstract financial chart with red bars and lines representing market decline, emphasizing data analysis and economics
Free with trial The flag of USA with declining stock market graph and financial data overlay, symbolizing economic downturn, recession, or bearish market trends. Data decrease illustrations The flag of USA with declining stock market graph and financial data overlay
Free with trial The flag of Oman with declining stock market graph and financial data overlay, symbolizing economic downturn, recession, or bearish market trends. Data decrease illustrations The flag of Oman with declining stock market graph and financial data overlay
Free with trial The flag of Laos with declining stock market graph and financial data overlay, symbolizing economic downturn, recession, or bearish market trends. Data decrease illustrations The flag of Laos with declining stock market graph and financial data overlay
Free with trial The flag of Mali with declining stock market graph and financial data overlay, symbolizing economic downturn, recession, or bearish market trends. Data decrease illustrations The flag of Mali with declining stock market graph and financial data overlay
Free with trial The flag of Chad with declining stock market graph and financial data overlay, symbolizing economic downturn, recession, or bearish market trends. Data decrease illustrations The flag of Chad with declining stock market graph and financial data overlay
Free with trial The flag of Cuba with declining stock market graph and financial data overlay, symbolizing economic downturn, recession, or bearish market trends. Data decrease illustrations The flag of Cuba with declining stock market graph and financial data overlay
Free with trial The flag of Benin with declining stock market graph and financial data overlay, symbolizing economic downturn, recession, or bearish market trends. Data decrease illustrations The flag of Benin with declining stock market graph and financial data overlay
Free with trial The flag of Libya with declining stock market graph and financial data overlay, symbolizing economic downturn, recession, or bearish market trends. Data decrease illustrations The flag of Libya with declining stock market graph and financial data overlay
Free with trial The flag of Iraq with declining stock market graph and financial data overlay, symbolizing economic downturn, recession, or bearish market trends. Data decrease illustrations The flag of Iraq with declining stock market graph and financial data overlay
Free with trial The flag of Iran with declining stock market graph and financial data overlay, symbolizing economic downturn, recession, or bearish market trends. Data decrease illustrations The flag of Iran with declining stock market graph and financial data overlay
Free with trial The flag of Gabon with declining stock market graph and financial data overlay, symbolizing economic downturn, recession, or bearish market trends. Data decrease illustrations The flag of Gabon with declining stock market graph and financial data overlay
Free with trial The flag of Kenya with declining stock market graph and financial data overlay, symbolizing economic downturn, recession, or bearish market trends. Data decrease illustrations The flag of Kenya with declining stock market graph and financial data overlay
Free with trial The flag of Italy with declining stock market graph and financial data overlay, symbolizing economic downturn, recession, or bearish market trends. Data decrease illustrations The flag of Italy with declining stock market graph and financial data overlay
Free with trial The flag of Japan with declining stock market graph and financial data overlay, symbolizing economic downturn, recession, or bearish market trends. Data decrease illustrations The flag of Japan with declining stock market graph and financial data overlay
Free with trial The flag of Ghana with declining stock market graph and financial data overlay, symbolizing economic downturn, recession, or bearish market trends. Data decrease illustrations The flag of Ghana with declining stock market graph and financial data overlay
Free with trial The flag of Egypt with declining stock market graph and financial data overlay, symbolizing economic downturn, recession, or bearish market trends. Data decrease illustrations The flag of Egypt with declining stock market graph and financial data overlay
Free with trial The flag of Norway with declining stock market graph and financial data overlay, symbolizing economic downturn, recession, or bearish market trends. Data decrease illustrations The flag of Norway with declining stock market graph and financial data overlay
Free with trial The flag of Malawi with declining stock market graph and financial data overlay, symbolizing economic downturn, recession, or bearish market trends. Data decrease illustrations The flag of Malawi with declining stock market graph and financial data overlay
Free with trial The flag of Mexico with declining stock market graph and financial data overlay, symbolizing economic downturn, recession, or bearish market trends. Data decrease illustrations The flag of Mexico with declining stock market graph and financial data overlay
Free with trial The flag of Panama with declining stock market graph and financial data overlay, symbolizing economic downturn, recession, or bearish market trends. Data decrease illustrations The flag of Panama with declining stock market graph and financial data overlay
Free with trial The flag of Latvia with declining stock market graph and financial data overlay, symbolizing economic downturn, recession, or bearish market trends. Data decrease illustrations The flag of Latvia with declining stock market graph and financial data overlay
Free with trial The flag of Gambia with declining stock market graph and financial data overlay, symbolizing economic downturn, recession, or bearish market trends. Data decrease illustrations The flag of Gambia with declining stock market graph and financial data overlay
Free with trial The flag of Kuwait with declining stock market graph and financial data overlay, symbolizing economic downturn, recession, or bearish market trends. Data decrease illustrations The flag of Kuwait with declining stock market graph and financial data overlay
Free with trial The flag of India with declining stock market graph and financial data overlay, symbolizing economic downturn, recession, or bearish market trends. Data decrease illustrations The flag of India with declining stock market graph and financial data overlay
Free with trial The flag of Angola with declining stock market graph and financial data overlay, symbolizing economic downturn, recession, or bearish market trends. Data decrease illustrations The flag of Angola with declining stock market graph and financial data overlay
Free with trial The flag of Jordan with declining stock market graph and financial data overlay, symbolizing economic downturn, recession, or bearish market trends. Data decrease illustrations The flag of Jordan with declining stock market graph and financial data overlay
Free with trial The flag of Greece with declining stock market graph and financial data overlay, symbolizing economic downturn, recession, or bearish market trends. Data decrease illustrations The flag of Greece with declining stock market graph and financial data overlay
Free with trial The flag of Brazil with declining stock market graph and financial data overlay, symbolizing economic downturn, recession, or bearish market trends. Data decrease illustrations The flag of Brazil with declining stock market graph and financial data overlay
Free with trial The flag of Cyprus with declining stock market graph and financial data overlay, symbolizing economic downturn, recession, or bearish market trends. Data decrease illustrations The flag of Cyprus with declining stock market graph and financial data overlay
Free with trial The flag of Canada with declining stock market graph and financial data overlay, symbolizing economic downturn, recession, or bearish market trends. Data decrease illustrations The flag of Canada with declining stock market graph and financial data overlay
Free with trial The flag of France with declining stock market graph and financial data overlay, symbolizing economic downturn, recession, or bearish market trends. Data decrease illustrations The flag of France with declining stock market graph and financial data overlay
Free with trial The flag of Namibia with declining stock market graph and financial data overlay, symbolizing economic downturn, recession, or bearish market trends. Data decrease illustrations The flag of Namibia with declining stock market graph and financial data overlay
Free with trial The flag of Nigeria with declining stock market graph and financial data overlay, symbolizing economic downturn, recession, or bearish market trends. Data decrease illustrations The flag of Nigeria with declining stock market graph and financial data overlay
Free with trial The flag of Moldova with declining stock market graph and financial data overlay, symbolizing economic downturn, recession, or bearish market trends. Data decrease illustrations The flag of Moldova with declining stock market graph and financial data overlay
Free with trial The flag of Belarus with declining stock market graph and financial data overlay, symbolizing economic downturn, recession, or bearish market trends. Data decrease illustrations The flag of Belarus with declining stock market graph and financial data overlay