Free with trial Bar graph and line chart showing performance decline, icons of person and movement, and a sad face symbol. Ideal for data trends, business analysis, failure, mood, feedback, decision-making. Data decrease illustrations Declining Trends in Data Analysis with Emotional Impact Represented by Sad Face Icon. Bar graph and line chart showing performance decline, icons of person and movement, and a sad face symbol. Ideal for data trends, business analysis, failure, mood, feedback, decision-making
Free with trial Falling bar chart with a downward trending line and arrow indicating decrease. Data decrease vectors Falling bar chart with a downward trending line and arrow indicating decrease
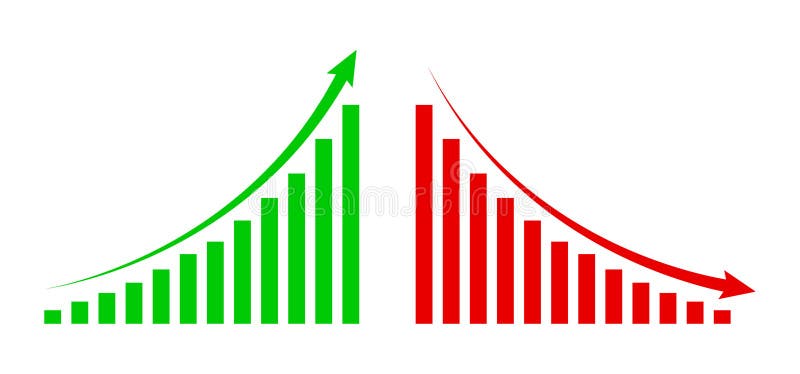
Free with trial Trend chart icons. Rising and falling bars. Arrow and bar graph. Economic data symbols. EPS 10. Data decrease vectors Trend chart icons. Rising and falling bars. Arrow and bar graph. Economic data symbols.
Free with trial A modern vector icon of a stylized magnifying glass with a minus sign, representing the zoom out function. This graphic is perfect for user interfaces requiring adjustable views, such as photo editors, geographic maps, or data visualizations. Its sleek design offers a clear and intuitive way to decrease magnification, vector design Generative AI. Data decrease vectors Stylized Zoom Out Magnifying Glass Icon, vector design Generative AI. A modern vector icon of a stylized magnifying glass with a minus sign, representing the zoom out function. This graphic is perfect for user interfaces requiring adjustable views, such as photo editors, geographic maps, or data visualizations. Its sleek design offers a clear and intuitive way to decrease magnification, vector design Generative AI
Free with trial Dynamic financial graphs and data analysis display on digital screen. That the image is generated using AI. Data decrease illustrations Dynamic financial graphs and data analysis display on digital screen
Free with trial Declining bar graph illustration, business, financial, and economic data. Data decrease vectors Declining bar graph illustration, business, financial, and economic data
Free with trial A businessman in a suit analyzes financial data with a laptop. The concept represents improving quality while reducing costs to optimize business performance and increase profitability. Data decrease illustrations Businessman analyzing data with cost and quality improvement concept. A businessman in a suit analyzes financial data with a laptop. The concept represents improving quality while reducing costs to optimize business performance and increase profitability
Free with trial Handdrawn outline style decrease chart with exclamation mark attention icon. Symbol for warning and risk of losing the income. Data decrease vectors Handdrawn Outline Decrease Chart with Exclamation Mark Attention Icon. Handdrawn outline style decrease chart with exclamation mark attention icon. Symbol for warning and risk of losing the income.
Free with trial Decrease vector icon on the white background. EPS 10. Data decrease vectors Decrease thin line vector icon set. Decrease vector icon on the white background. EPS 10
Free with trial Decrease vector icon on the white background. EPS 10. Data decrease vectors Decrease thin line vector icon set. Decrease vector icon on the white background. EPS 10
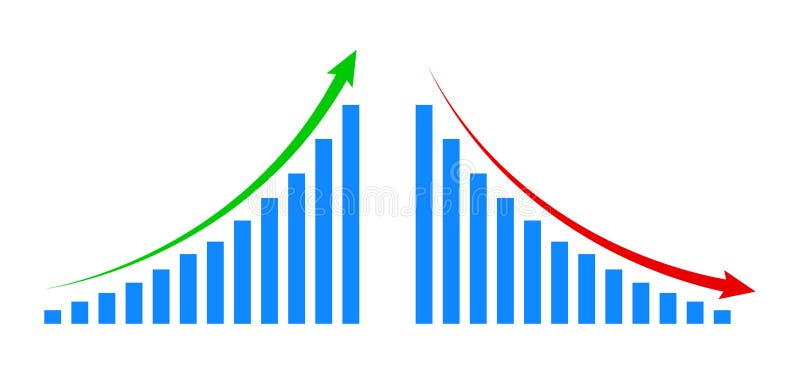
Free with trial Graph going Up and Down sign with green and red arrows. graph increase, decrease sign design. Data decrease vectors Graph going Up and Down sign with green and red arrows. graph increase, decrease sign
Free with trial Decrease vector icon on the white background. EPS 10. Data decrease vectors Decrease thin line vector icon set. Decrease vector icon on the white background. EPS 10
Free with trial Decrease vector icon on the white background. EPS 10. Data decrease vectors Decrease thin line vector icon set. Decrease vector icon on the white background. EPS 10
Free with trial Decrease vector icon on the white background. EPS 10. Data decrease vectors Decrease thin line vector icon set. Decrease vector icon on the white background. EPS 10
Free with trial Decrease vector icon on the white background. EPS 10. Data decrease vectors Decrease thin line vector icon set. Decrease vector icon on the white background. EPS 10
Free with trial Decrease vector icon on the white background. EPS 10. Data decrease vectors Decrease thin line vector icon set. Decrease vector icon on the white background. EPS 10
Free with trial Decrease vector icon on the white background. EPS 10. Data decrease vectors Decrease thin line vector icon set. Decrease vector icon on the white background. EPS 10
Free with trial Decrease vector icon on the white background. EPS 10. Data decrease vectors Decrease thin line vector icon set. Decrease vector icon on the white background. EPS 10
Free with trial Decrease vector icon on the white background. EPS 10. Data decrease vectors Decrease thin line vector icon set. Decrease vector icon on the white background. EPS 10
Free with trial Decrease vector icon on the white background. EPS 10. Data decrease vectors Decrease thin line vector icon set. Decrease vector icon on the white background. EPS 10
Free with trial Decrease vector icon on the white background. EPS 10. Data decrease vectors Decrease thin line vector icon set. Decrease vector icon on the white background. EPS 10
Free with trial A chart showing a decrease with an arrow pointing down, isolated on a white background, representing a decline in data or performance. Data decrease illustrations Decreasing chart with arrow isolated on white background. A chart showing a decrease with an arrow pointing down, isolated on a white background, representing a decline in data or performance
Free with trial A close-up shot of a finger interacting with a colorful digital stock market graph. This image depicts modern finance technology and data analysis, capturing market trends. Data decrease illustrations Finger Touching Digital Stock Market Graph with Colorful Data Display. A close-up shot of a finger interacting with a colorful digital stock market graph. This image depicts modern finance technology and data analysis, capturing market trends
Free with trial This image showcases a futuristic holographic display, generated by AI, depicting a declining graph. The sleek, modern design highlights technological advancements in data presentation and analysis. The displayed data is likely financial or scientific, emphasizing the potential of AI in various fi. Data decrease illustrations AI-Generated Data Visualization. This image showcases a futuristic holographic display, generated by AI, depicting a declining graph. The sleek, modern design highlights technological advancements in data presentation and analysis. The displayed data is likely financial or scientific, emphasizing the potential of AI in various fi
Free with trial A computer screen displays a red data visualization, generated by AI, resembling a declining graph. The image is set against a minimalist, clean background, suggesting a modern office or workspace. The overall aesthetic conveys a sense of technological advancement and data analysis. Data decrease illustrations AI-Generated Data Visualization. A computer screen displays a red data visualization, generated by AI, resembling a declining graph. The image is set against a minimalist, clean background, suggesting a modern office or workspace. The overall aesthetic conveys a sense of technological advancement and data analysis.
Free with trial Cloud storage scaling concept with dynamic size adjustment arrows showing capacity increase and decrease in isometric line contour vector illustration. Data decrease vectors Cloud storage scaling concept with dynamic size adjustment arrows showing capacity increase and decrease in isometric
Free with trial Decline bar chart with downward trend arrow outline icon. Decrease, loss, and financial drop symbol vector. Data decrease vectors Decline bar chart with downward trend arrow outline icon. Decrease, loss, and financial drop symbol
Free with trial Increase decrease editable stroke line icons isolated on white background. Data decrease vectors Increase decrease editable stroke line icons isolated on white background
Free with trial A 3D bar chart with red and green bars representing financial data trends, isolated on white background. Data decrease illustrations 3d bar chart showing financial data trends isolated on white background. A 3D bar chart with red and green bars representing financial data trends, isolated on white background
Free with trial An abstract visualization blending climate change data with a winter landscape. The image conveys the convergence of data-driven insights and natural environment representation, showcasing patterns and trends of global warming. Generative AI. Data decrease illustrations Abstract Representation of Climate Data Convergence in Winter Landscape. An abstract visualization blending climate change data with a winter landscape. The image conveys the convergence of data-driven insights and natural environment representation, showcasing patterns and trends of global warming. Generative AI
Free with trial A hand holding a pen traces a downward-sloping red line over a stock market data screen, symbolizing financial loss or a market crash. The image conveys a sense of concern and economic instability. The composition uses a shallow depth of field, focusing on the hand and the red line. Data decrease illustrations Financial Downturn: Hand Tracing Red Stock Market Decline on Data Screen. A hand holding a pen traces a downward-sloping red line over a stock market data screen, symbolizing financial loss or a market crash. The image conveys a sense of concern and economic instability. The composition uses a shallow depth of field, focusing on the hand and the red line
Free with trial A visual representation of data showing a decline over a period. The blue bars are arranged in descending order of height, each marked with numerical indicators, suggesting a decrease in value or quantity. Data decrease illustrations Blue bar chart showing decreasing trend over time with numerical labels. A visual representation of data showing a decline over a period. The blue bars are arranged in descending order of height, each marked with numerical indicators, suggesting a decrease in value or quantity
Free with trial Business decline bar chart icon with long shadow. Decrease, loss, and financial collapse sign symbol vector. Data decrease vectors Business decline bar chart icon with long shadow. Decrease, loss, and financial collapse sign symbol
Free with trial A close-up view of a financial bar and line graph with a pen resting on it, indicating analysis and financial data. Data decrease illustrations Close-up of a financial graph with bars and line chart and a pen business data. A close-up view of a financial bar and line graph with a pen resting on it, indicating analysis and financial data
Free with trial The image depicts an abstract and colorful representation of financial data and market trends. It uses vivid colors and shapes. Data decrease illustrations An abstract visual representation of fluctuating financial data analysis. The image depicts an abstract and colorful representation of financial data and market trends. It uses vivid colors and shapes
Free with trial Decrease vector icon on the white background. EPS 10. Data decrease vectors Decrease thin line vector icon set. Decrease vector icon on the white background. EPS 10
Free with trial Decrease vector icon on the white background. EPS 10. Data decrease vectors Decrease thin line vector icon set. Decrease vector icon on the white background. EPS 10
Free with trial A graphic representation of financial data, prominently featuring a downward trending graph in shades of red. The visuals convey a sense of market decline and financial risk, suitable for illustrating economic downturn or cautionary business forecasts. Data decrease illustrations Abstract Financial Data Representation with a Dominant Red Color Palette. A graphic representation of financial data, prominently featuring a downward trending graph in shades of red. The visuals convey a sense of market decline and financial risk, suitable for illustrating economic downturn or cautionary business forecasts
Free with trial Digital illustration of a microchip with AI label and a large red downward arrow symbolizing data loss or decrease, set against a gradient red background for technology and AI themes ideal for tech industry and artificial intelligence marketing. Data decrease illustrations Artificial Intelligence Microchip with Red Downward Arrow Digital Effect. Digital illustration of a microchip with AI label and a large red downward arrow symbolizing data loss or decrease, set against a gradient red background for technology and AI themes ideal for tech industry and artificial intelligence marketing
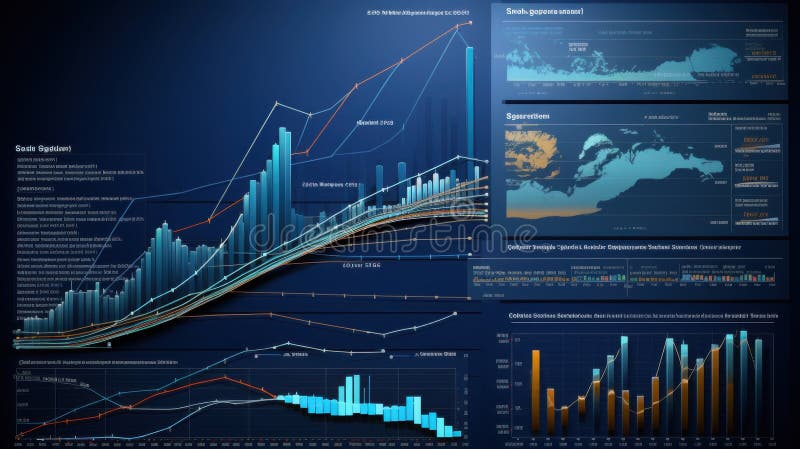
Free with trial Comprehensive data visualization with global charts and interactive graphs. Data decrease illustrations Comprehensive data visualization with global charts and interactive graphs
Free with trial Open book beside sad face, declining graph, and padlock icon with passwords. Ideal for data security, education, technology risks, privacy, business analysis learning concern metaphor. Simple flat. Data decrease vectors Open Book, Declining Graph, Sad Face, and Cybersecurity Elements Highlight Data Privacy Issues. Open book beside sad face, declining graph, and padlock icon with passwords. Ideal for data security, education, technology risks, privacy, business analysis learning concern metaphor. Simple flat
Free with trial This 3D rendering shows vibrant bar and pie charts illustrating business growth, data analysis, and statistical visualization. Perfect for presentations, reports, or marketing materials. Data decrease illustrations Colorful 3D Bar and Pie Charts Representing Business Growth and Data Analysis. This 3D rendering shows vibrant bar and pie charts illustrating business growth, data analysis, and statistical visualization. Perfect for presentations, reports, or marketing materials.
Free with trial Up and down graph chart icon. Growth increase and decrease sign. Graph or diagram with arrow going up and down. Vector illustration. Data decrease vectors Up and down graph chart icon. Growth increase and decrease sign. Graph or diagram with arrow going up and down. Vector
Free with trial A vibrant red arrow curves downward, signifying a decrease, negative trend, or direction towards lower values. Ideal for financial reports, data visualization, or indicating a downward path. Data decrease illustrations Bright red downward curved arrow symbol indicating decline or trend vector. A vibrant red arrow curves downward, signifying a decrease, negative trend, or direction towards lower values. Ideal for financial reports, data visualization, or indicating a downward path
Free with trial Modern rendered line graph with yellow marker points rising and falling vertically, forming a white trend line that fluctuates across the screen. The graph represents business data such as growth, decrease, profit, and market performance. Set against a blurred office background, the image has a clean, digital aesthetic ideal for financial presentations, company reports, startup pitches, and data analysis. This visual is suitable for showcasing trading performance, corporate strategy, and economic trends. Data decrease illustrations Business Trend Line Graph Showing Growth and Market Fluctuations. Modern rendered line graph with yellow marker points rising and falling vertically, forming a white trend line that fluctuates across the screen. The graph represents business data such as growth, decrease, profit, and market performance. Set against a blurred office background, the image has a clean, digital aesthetic ideal for financial presentations, company reports, startup pitches, and data analysis. This visual is suitable for showcasing trading performance, corporate strategy, and economic trends.
Free with trial A 3D illustration featuring a bar chart with four ascending blue bars of varying heights, representing data growth. To the right of the chart are two white arrows, one pointing upwards and the other downwards, symbolizing increase and decrease respectively. The entire graphic is presented on a clean white background. Data decrease illustrations 3D Bar Chart with Up and Down Arrows on White Background graph statistics. A 3D illustration featuring a bar chart with four ascending blue bars of varying heights, representing data growth. To the right of the chart are two white arrows, one pointing upwards and the other downwards, symbolizing increase and decrease respectively. The entire graphic is presented on a clean white background
Free with trial Abstract 3D bar graph with red and teal bars on a white background. Illustrates data visualization and financial concepts. Data decrease illustrations Abstract 3D Bar Graph Red and Teal Data Visualization on White. Abstract 3D bar graph with red and teal bars on a white background. Illustrates data visualization and financial concepts
Free with trial Teal bar chart illustration for data visualization and statistical analysis. Data decrease vectors Teal bar chart illustration for data visualization and statistical analysis
Free with trial Computer Monitor with a Graph Showing Decreasing Bar Chart for Data Analysis. Data decrease vectors Computer Monitor with a Graph Showing Decreasing Bar Chart for Data Analysis
Free with trial A stylized line graph icon with a purple gradient is displayed against a solid black background. The graph features four circular data points connected by angled lines, forming an upward trend. Data decrease illustrations Stylized line graph icon with purple gradient on black background chart data. A stylized line graph icon with a purple gradient is displayed against a solid black background. The graph features four circular data points connected by angled lines, forming an upward trend
Free with trial A close-up of a hand reaching towards a glowing data graph, symbolizing the intersection of technology and finance, with vibrant colors representing growth and potential. Data decrease illustrations Hand Touching Sparkling Data Graph with Vibrant Colors and Digital Elements. A close-up of a hand reaching towards a glowing data graph, symbolizing the intersection of technology and finance, with vibrant colors representing growth and potential
Free with trial Stock market chart displaying investment trends with red and blue candlesticks on a dark background. The chart features a timeline labeled by months at the top and numbers at the bottom, illustrating dynamic financial data. Candlesticks show market fluctuations, with red indicating a decrease and blue an increase in value. A faint blue line overlays the candles, representing the moving average. The scene is likely within a financial or trading setting, emphasizing the analysis of market activity. Data decrease illustrations Dynamic stock market chart with vibrant red and blue candles showing investment trends and financial data. Stock market chart displaying investment trends with red and blue candlesticks on a dark background. The chart features a timeline labeled by months at the top and numbers at the bottom, illustrating dynamic financial data. Candlesticks show market fluctuations, with red indicating a decrease and blue an increase in value. A faint blue line overlays the candles, representing the moving average. The scene is likely within a financial or trading setting, emphasizing the analysis of market activity.
Free with trial Set line Cloud and shield, Cost reduction and Server, Data, Web Hosting icon. Vector. Data decrease illustrations Set line Cloud and shield, Cost reduction and Server, Data, Web Hosting icon. Vector
Free with trial Hand drawn bar chart illustration showing data statistics and business growth. Data decrease vectors Hand drawn bar chart illustration showing data statistics and business growth
Free with trial Data analysis graphs with up and down arrow line icons set. Increase and reduction of economy or trend charts, price boost, stock market research thin black and red outline symbols vector illustration. Data decrease vectors Data analysis graphs with up and down arrow, economy or trend charts line icons set. Data analysis graphs with up and down arrow line icons set. Increase and reduction of economy or trend charts, price boost, stock market research thin black and red outline symbols vector illustration
Free with trial An abstract digital rendering of a financial market chart with a prominent red line indicating fluctuations in a stock market or trading scenario, set against a background of data streams and numerical information. It can be used for visualizing economic trends or for representing financial analytics. Data decrease illustrations Abstract financial chart depicting market trends and data analysis interface. An abstract digital rendering of a financial market chart with a prominent red line indicating fluctuations in a stock market or trading scenario, set against a background of data streams and numerical information. It can be used for visualizing economic trends or for representing financial analytics
Free with trial CO2 inside cloud shape with blue downward arrows indicating reduction, next to bar chart and small cloud. Ideal for sustainability, environment, data, carbon reduction, climate change, eco-friendly. Data decrease vectors Reducing Carbon Emissions with Data Analysis Highlighted by Cloud Imagery and Downward Arrows. CO2 inside cloud shape with blue downward arrows indicating. CO2 inside cloud shape with blue downward arrows indicating reduction, next to bar chart and small cloud. Ideal for sustainability, environment, data, carbon reduction, climate change, eco-friendly
Free with trial Modern digital illustration showing a glowing neon 'Margin Call' alert over financial charts and data analytics interface, symbolizing trading loss and market downturn. Data decrease illustrations Margin Call Concept with Stock Market Chart and Financial Data Visualization. Modern digital illustration showing a glowing neon 'Margin Call' alert over financial charts and data analytics interface, symbolizing trading loss and market downturn.
Free with trial Hand drawn bar chart sketch with ascending and descending data patterns. Data decrease vectors Hand drawn bar chart sketch with ascending and descending data patterns, AI Generative. Hand drawn bar chart sketch with ascending and descending data patterns.
Free with trial Calculator with purple screen, upward-trending performance graph, and downward arrow. Ideal for finance, accounting, budgeting, data analysis, cost reduction, investment strategy simple flat. Data decrease vectors Financial calculation with a calculator, performance graph, and downward arrow for data analysis. Calculator with purple screen, upward-trending performance graph, and downward arrow. Ideal for finance, accounting, budgeting, data analysis, cost reduction, investment strategy simple flat
Free with trial Pastel-colored bar chart and pie chart representing data and statistics, perfectly suitable for business presentations and reports. The 3D graphic is set against a plain white background, enhancing its visual appeal. Data decrease illustrations Colorful 3D Bar and Pie Charts on White Cube Base: Business Data Visualization. Pastel-colored bar chart and pie chart representing data and statistics, perfectly suitable for business presentations and reports. The 3D graphic is set against a plain white background, enhancing its visual appeal.
Free with trial Increase and reduction of economy or trend charts, price boost, stock market research thin black outline symbols vector illustration. Data analysis graphs with up and down arrow line icons set. Data decrease vectors Data analysis graphs with up and down arrow, economy or trend charts line icons set. Increase and reduction of economy or trend charts, price boost, stock market research thin black outline symbols vector illustration. Data analysis graphs with up and down arrow line icons set.
Free with trial A striking red downward arrow breaks through charts and data, symbolizing a sharp decrease in market values or performance metrics during a financial analysis session. Data decrease illustrations Red downward arrow indicates a sudden decline in market performance and trends. A striking red downward arrow breaks through charts and data, symbolizing a sharp decrease in market values or performance metrics during a financial analysis session.
Free with trial Decline bar chart with downward trend arrow icon vector. Decrease, loss, and financial drop symbol on circle line. Data decrease vectors Decline bar chart with downward trend arrow icon. Decrease, loss, and financial drop symbol on circle line
Free with trial Computer-generated world map, white continents, dark background, overlaid with red line and bar graphs showing downward trends, stylized global data visualization. Data decrease illustrations Realistic White World Map Data Visualization Dark Background Red Graphs Trend. Computer-generated world map, white continents, dark background, overlaid with red line and bar graphs showing downward trends, stylized global data visualization
Free with trial Business graph data analysis on wooden desk with pencils, bananas and notebooks. Data decrease illustrations Business graph data analysis on wooden desk with pencils, bananas and notebooks
Free with trial Graph going up and down sign financial arrows. chart increase, decrease sign with green and red arrows. vector graph with green and red arrows. Data decrease vectors Graph going up and down sign financial arrows. chart increase, decrease sign with green and red arrows. vector graph
Free with trial Declining bar chart with downward trend line, showing decrease and financial loss. Data decrease vectors Declining bar chart with downward trend line, showing decrease and financial loss
Free with trial Statistic graph progress, financial profit growth, increase and decrease line icons set. Infographic charts with arrow, circles and bars thin black and red outline symbols vector illustration. Data decrease vectors Statistic graph progress, financial profit growth, increase and decrease line icons set
Free with trial A vector icon illustrating a downward trending line graph, symbolizing a decline, decrease, or negative performance. Ideal for financial reports, data analysis dashboards, or warning indicators. This clear and concise graphic is scalable, perfect for conveying trend information in various digital interfaces, vector design Generative AI. Data decrease vectors Declining Trend Graph Icon - Downturn Analysis Symbol, vector design Generative AI. A vector icon illustrating a downward trending line graph, symbolizing a decline, decrease, or negative performance. Ideal for financial reports, data analysis dashboards, or warning indicators. This clear and concise graphic is scalable, perfect for conveying trend information in various digital interfaces, vector design Generative AI
Free with trial Futuristic cityscape rendered with a glowing red network of lines, representing interconnected data and technology, creating a dynamic and energetic scene. High quality photo. Data decrease vectors Futuristic cityscape rendered with a glowing red network of lines, representing interconnected data and technology
Free with trial Wooden block with a downward arrow symbol, representing a decline or decrease, sits on a rustic wooden surface. Data decrease illustrations Wooden block with an arrow symbol pointing down represents a decrease or decline. wooden block with a downward arrow symbol, representing a decline or decrease, sits on a rustic wooden surface.
Free with trial Colorful bar chart on a blue background illustrating data trends ,Generative ai. Data decrease illustrations Vibrant bar chart on blue background, visualizing data trends and insights colorful. Colorful bar chart on a blue background illustrating data trends ,Generative ai
Free with trial Decline bar chart with downward trend arrow icon vector. Decrease, loss, and financial crisis symbol in black circle. Data decrease vectors Decline bar chart with downward trend arrow icon. Decrease, loss, and financial crisis symbol in black circle
Free with trial A businessman in a suit analyzes financial data with a laptop. The concept represents improving quality while reducing costs to optimize business performance and increase profitability. Data decrease illustrations Businessman analyzing data with cost and quality improvement concept. A businessman in a suit analyzes financial data with a laptop. The concept represents improving quality while reducing costs to optimize business performance and increase profitability
Free with trial Person displays wooden block featuring a chart, emphasizing data visualization ,Generative ai. Data decrease illustrations Wooden block chart display, data visualization for business analysis and strategic planning. Person displays wooden block featuring a chart, emphasizing data visualization ,Generative ai
Free with trial Chart with a downward trend line and data points, a sad face emotion, and a pointing hand. Ideal for performance analysis, failure, problem-solving, disappointment, caution, decision-making simple. Data decrease vectors Hand pointing at declining data chart with a sad face icon highlighting negative performance trend. Chart with a downward trend line and data points, a sad face emotion, and a pointing hand. Ideal for performance analysis, failure, problem-solving, disappointment, caution, decision-making simple
Free with trial Dollar arrow up and down icon vector. USD currency increase and decrease concept. Data decrease vectors Dollar arrow up and down icon. USD currency increase and decrease concept
Free with trial A Red bar graph representing data growth on wooden surface, showcasing trends and analysis, Generative AI. Data decrease illustrations Red bar graph representing data growth on wooden surface, showcasing trends and analysis
Free with trial Five oil barrels of varying sizes are arranged in a declining order. A bold orange arrow points downward, symbolizing a decrease in oil prices, illustrating market dynamics. Data decrease illustrations Art collage, Oil barrel sizes decrease, reflecting energy market trends and price fluctuations. Five oil barrels of varying sizes are arranged in a declining order. A bold orange arrow points downward, symbolizing a decrease in oil prices, illustrating market dynamics