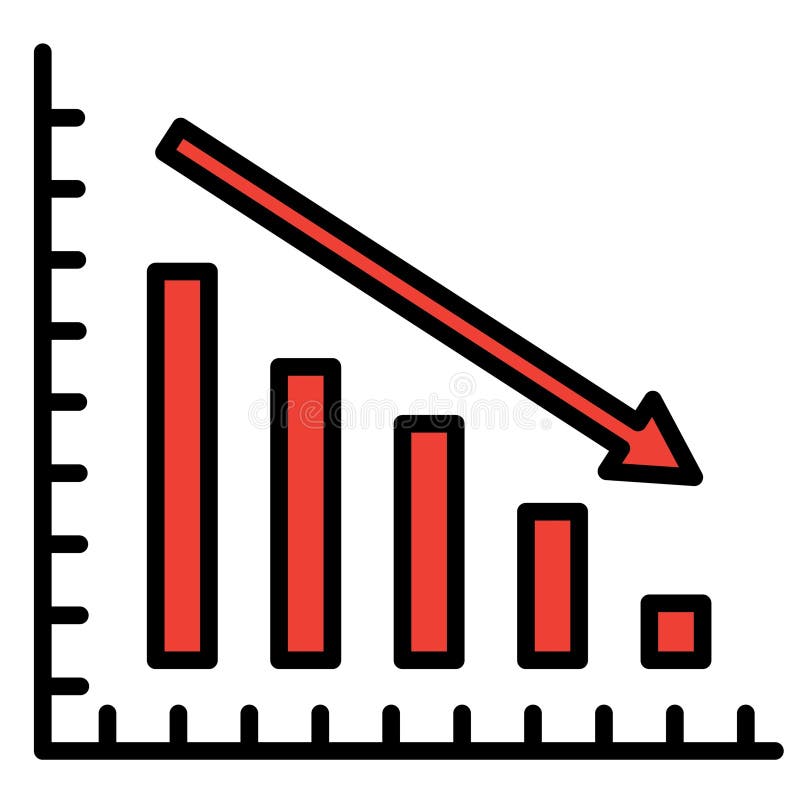
Free with trial Data Stats Board Display Icon Downward Down Trend Statistic Performance Market Decline Economy Downturn Bar Graph Progress Sign Symbol Presentation. Decrease bar vectors Data Stats Board Display Icon Downward Down Trend Statistic Performance Market Decline Economy Downturn Bar Graph Progress
Free with trial A 3D bar chart with a red arrow indicating a significant downward trend, symbolizing financial loss or economic decline. Isolated on a white background. Decrease bar illustrations Bar chart showing a downward trend isolated on white background. A 3D bar chart with a red arrow indicating a significant downward trend, symbolizing financial loss or economic decline. Isolated on a white background
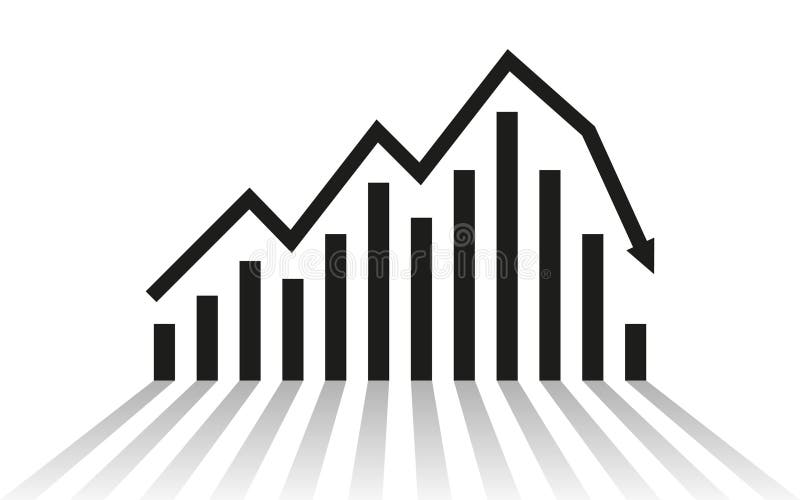
Free with trial Sad face beside declining line graph and bar chart, symbolizing setbacks. Ideal for finance, business, economy, loss, analytics, crisis performance. Simple flat metaphor. Decrease bar vectors Negative Trend Line and Declining Bar Chart Representing Business Loss or Financial Downturn. Sad face beside declining line graph and bar chart, symbolizing setbacks. Ideal for finance, business, economy, loss, analytics, crisis performance. Simple flat metaphor
Free with trial This image showcases a comprehensive collection of blue bar graphs and line graphs, presented in a grid format. Each graph depicts various data trends, including upward and downward movements, fluctuating patterns, and steady growth. The clean, modern design makes these icons ideal for representing financial data, market analysis, performance metrics, and business growth in presentations, reports, and websites. Decrease bar illustrations Collection of Blue Bar and Line Graphs for Business Analytics. This image showcases a comprehensive collection of blue bar graphs and line graphs, presented in a grid format. Each graph depicts various data trends, including upward and downward movements, fluctuating patterns, and steady growth. The clean, modern design makes these icons ideal for representing financial data, market analysis, performance metrics, and business growth in presentations, reports, and websites.
Free with trial A black icon showing a bar graph with a downward trending arrow indicating a decline. Decrease bar illustrations Black bar graph with downward trending arrow icon on white background chart decline. A black icon showing a bar graph with a downward trending arrow indicating a decline
Free with trial A black silhouette of a bar chart with a vertical scale and grid lines, representing data analysis. Decrease bar illustrations Black bar chart icon with grid lines and scale on white background graph statistics. A black silhouette of a bar chart with a vertical scale and grid lines, representing data analysis
Free with trial Downward arrow, dollar coin, and bar chart showing data. Ideal for finance, economy, loss, budget, analysis statistics and crisis. Flat simple metaphor. Decrease bar vectors Declining Financial Trends Represented by Down Arrow, Dollar Coin, and Bar Chart. Downward arrow, dollar coin, and bar chart showing data. Ideal for finance, economy, loss, budget, analysis statistics and crisis. Flat simple metaphor
Free with trial Simple black bar graph icon with bars of varying heights on a white background Clear details and vibrant color. Decrease bar illustrations Simple black bar graph icon showing varying heights on a white background chart data. Simple black bar graph icon with bars of varying heights on a white background Clear details and vibrant color
Free with trial A simple bar chart illustrating data trends with predominantly green bars indicating positive performance and one red bar suggesting a negative outcome, isolated on white. Decrease bar illustrations Bar chart with green and red bars isolated on white background. A simple bar chart illustrating data trends with predominantly green bars indicating positive performance and one red bar suggesting a negative outcome, isolated on white
Free with trial A flat design illustration of two bar charts, one green and one red, both showing a downward trend with arrows, representing financial or business decline. Decrease bar illustrations Bar chart showing declining trend isolated on white background. A flat design illustration of two bar charts, one green and one red, both showing a downward trend with arrows, representing financial or business decline
Free with trial A bar chart showing a steady decline with a red downward arrow, symbolizing financial loss, economic downturn, business decline, or negative performance trends. Decrease bar illustrations Economic Downtrend Bar Chart for Business concept 3d Rendering. A bar chart showing a steady decline with a red downward arrow, symbolizing financial loss, economic downturn, business decline, or negative performance trends
Free with trial A 3D rendered bar chart illustrates a decreasing trend. The bars, colored in a gradient from yellow to purple, represent data points that are diminishing in value. Placed on a simple gray base, the chart is isolated against a white background. This image is suitable for illustrating concepts related to business, finance, statistics, and economic downturns. Decrease bar illustrations 3D Bar Chart Decreasing Trend. A 3D rendered bar chart illustrates a decreasing trend. The bars, colored in a gradient from yellow to purple, represent data points that are diminishing in value. Placed on a simple gray base, the chart is isolated against a white background. This image is suitable for illustrating concepts related to business, finance, statistics, and economic downturns.
Free with trial A minimalist dark gray bar chart on a white background displays varying heights, illustrating data fluctuations and trends. Decrease bar illustrations Simple bar chart showing increasing and decreasing data trends. A minimalist dark gray bar chart on a white background displays varying heights, illustrating data fluctuations and trends
Free with trial Business bar graph icon vector with upward and downward arrow. Trend analysis symbol with long shadow. Decrease bar vectors Business bar graph icon with upward and downward arrow. Trend analysis symbol with long shadow
Free with trial This image features an adjustable dumbbell designed for versatile weight lifting exercises. The dumbbell consists of a central chrome-plated bar with multiple weighted plates on either side. The plates can be adjusted to increase or decrease the overall weight, making it suitable for various workout routines. The dumbbell is ideal for both beginners and advanced fitness enthusiasts. Decrease bar vectors Adjustable dumbbell with multiple weights. This image features an adjustable dumbbell designed for versatile weight lifting exercises. The dumbbell consists of a central chrome-plated bar with multiple weighted plates on either side. The plates can be adjusted to increase or decrease the overall weight, making it suitable for various workout routines. The dumbbell is ideal for both beginners and advanced fitness enthusiasts
Free with trial A globe with a map of the world on it, sitting next to a set of orange bar graphs. Decrease bar illustrations A globe sitting on top of a table next to a bar chart. A globe with a map of the world on it, sitting next to a set of orange bar graphs
Free with trial Shopping cart with a downward arrow, bar graph indicating loss, and sad face illustrating declining sales or performance. Ideal for business, ecommerce, market decline, economic loss, analytics. Decrease bar vectors Declining Sales Concept with Shopping Cart, Downward Arrow, Bar Graph, and Sad Face. Shopping cart with a downward arrow, bar graph indicating loss, and sad face illustrating declining sales or performance. Ideal for business, ecommerce, market decline, economic loss, analytics
Free with trial An isometric 3D bar chart composed of blue, gray, and orange blocks of varying heights is arranged on a white background. Decrease bar illustrations Isometric 3D bar chart with blue, gray, and orange blocks on a white background graph data. An isometric 3D bar chart composed of blue, gray, and orange blocks of varying heights is arranged on a white background
Free with trial This image features a bar graph with red bars indicating a downward trend. The graph is isolated on a white background, making the red bars and the downward arrow clearly visible. The image is suitable for representing declining metrics or statistics. Decrease bar illustrations Decreasing bar graph isolated on white background. This image features a bar graph with red bars indicating a downward trend. The graph is isolated on a white background, making the red bars and the downward arrow clearly visible. The image is suitable for representing declining metrics or statistics
Free with trial Colorful bar graph with downward trend, business concept illustration. Decrease bar vectors Colorful bar graph with downward trend, business concept illustration
Free with trial Displaying dashboard on screen showing red arrow trending down over bar chart and colorful lines. Analytics, visualization, data, performance, digital, insight, metrics. Decrease bar illustrations Displaying dashboard on screen showing red arrow trending down over bar chart and colorful lines
Free with trial Graphic visual representation of bar chart data analysis for business growth and market trends ,Generative ai. Decrease bar illustrations Comprehensive data analysis, visualizing business growth and market trends through bar chart graphics. Graphic visual representation of bar chart data analysis for business growth and market trends ,Generative ai
Free with trial Simple vector icon of a loudspeaker with a minus sign and a bar. Represents decreasing the volume, lowering sound output. Standard control in audio players, media software, and device interfaces for adjusting sound levels conveniently and clearly, vector design Generative AI. Decrease bar vectors Volume Down Icon: Decrease Sound Level Symbol Vector, vector design Generative AI. Simple vector icon of a loudspeaker with a minus sign and a bar. Represents decreasing the volume, lowering sound output. Standard control in audio players, media software, and device interfaces for adjusting sound levels conveniently and clearly, vector design Generative AI
Free with trial A bar graph with descending blue, yellow, and red bars, accompanied by a downward-pointing arrow, symbolizes economic decline or negative trends on a clean white background. Decrease bar illustrations Colorful Bar Graph with Downward Arrow Illustrating Economic Decline. A bar graph with descending blue, yellow, and red bars, accompanied by a downward-pointing arrow, symbolizes economic decline or negative trends on a clean white background
Free with trial Red sad face beside a line graph showing a downward trend and a bar graph. Ideal for business loss, economic decline, performance issues, challenges, setbacks, analytics, trends. Simple flat metaphor. Decrease bar vectors Declining Chart with Sad Face and Bar Graph Representing Negative Trend and Challenges. Red sad face beside a line graph showing a downward trend and a bar graph. Ideal for business loss, economic decline, performance issues, challenges, setbacks, analytics, trends. Simple flat metaphor
Free with trial Blue flat visualization showing bar chart and downward arrow over data grid with world map overlay. Analytics, finance, data analysis, digital, infographic, corporate, trend. Decrease bar illustrations Blue flat visualization showing bar chart and downward arrow over data grid with world map overlay
Free with trial A visual representation of a financial downturn, depicted by a bar chart with bars decreasing in height and a prominent red arrow pointing downwards, signifying a negative trend. Decrease bar illustrations Bar chart with red arrow showing decline isolated on white background. A visual representation of a financial downturn, depicted by a bar chart with bars decreasing in height and a prominent red arrow pointing downwards, signifying a negative trend
Free with trial A simple black and white illustration of a bar chart and a line graph showing business growth trends, isolated on a white background. Decrease bar vectors Business growth bar chart and line graph isolated on white background. A simple black and white illustration of a bar chart and a line graph showing business growth trends, isolated on a white background
Free with trial Business bar graph with upward and downward arrow. Trend analysis icon vector. Decrease bar vectors Business bar graph with upward and downward arrow. Trend analysis icon
Free with trial Two flat design icons representing financial trends. One shows an upward bar chart with an arrow and percentage symbol, the other a downward bar chart with a percentage symbol. Decrease bar vectors Upward and Downward Bar Chart Icons with Percentage Symbols Ai-Generated. Two flat design icons representing financial trends. One shows an upward bar chart with an arrow and percentage symbol, the other a downward bar chart with a percentage symbol
Free with trial A visual representation of a declining financial trend, depicted by a bar chart with a red arrow indicating a downward movement, symbolizing loss or poor performance. Decrease bar illustrations Bar chart with downward trending red arrow isolated on white background. A visual representation of a declining financial trend, depicted by a bar chart with a red arrow indicating a downward movement, symbolizing loss or poor performance
Free with trial A financial graph depicting a downward trend with a red arrow, blue bar chart, and white line graph on a dark blue grid background. Ideal for illustrating market decline, revenue loss, or negative performance in business, finance, and economic presentations. Decrease bar illustrations Declining Financial Graph Red Arrow and Bar Chart on Dark Grid Background. A financial graph depicting a downward trend with a red arrow, blue bar chart, and white line graph on a dark blue grid background. Ideal for illustrating market decline, revenue loss, or negative performance in business, finance, and economic presentations.
Free with trial Downward arrow, spiral calendar, and bar graph signifying trend analysis, scheduling, and metrics. Ideal for time management, progress tracking, productivity, data analytics planning forecasting. Decrease bar vectors Calendar, Downward Arrow, and Bar Graph Representing Time Management and Performance Analysis. Downward arrow, spiral calendar, and bar graph signifying trend analysis, scheduling, and metrics. Ideal for time management, progress tracking, productivity, data analytics planning forecasting
Free with trial A bar chart illustrating a significant decline or failure, marked by a red cross, signifying negative business outcomes and economic setbacks. Decrease bar illustrations Bar chart with red cross indicating failure isolated on white background. A bar chart illustrating a significant decline or failure, marked by a red cross, signifying negative business outcomes and economic setbacks
Free with trial A 3D render shows a vibrant, pastel-colored bar chart displaying a decreasing trend with blue, yellow, and lavender bars on a transparent background. Decrease bar vectors Downward trendy pastel bar chart illustration on transparent background. A 3D render shows a vibrant, pastel-colored bar chart displaying a decreasing trend with blue, yellow, and lavender bars on a transparent background.
Free with trial Business bar graph icon with upward and downward arrow. Trend analysis symbol vector in circular outline. Decrease bar vectors Business bar graph icon with upward and downward arrow. Trend analysis symbol in circular outline
Free with trial A bar graph illustrates a decreasing trend in financial performance, indicated by a red arrow and a dollar symbol. Decrease bar illustrations Bar chart showing financial decline with downward trend and dollar sign. A bar graph illustrates a decreasing trend in financial performance, indicated by a red arrow and a dollar symbol
Free with trial Stock market graph loss icon graphic vector line stroke outline art, negative decrease down trend chart arrow sign symbol pictogram, economy crash indicator image clipart. Decrease bar vectors Stock market graph loss icon graphic vector line stroke outline art, negative decrease down trend chart arrow sign symbol
Free with trial White Bar Graph Decreasing on Light Blue Background. Decrease bar illustrations White Bar Graph Decreasing on Light Blue Background
Free with trial A black bar chart showing a downward trend with an arrow on a white background. Clear details and vibrant colo. Decrease bar illustrations Black downward trending bar chart with arrow on white background graph. A black bar chart showing a downward trend with an arrow on a white background. Clear details and vibrant colo
Free with trial Conceptual graph with decrease report. Dark diagram with recession and bankruptcy progress. Business and finance vector illustration. Decrease bar vectors Conceptual graph with decrease report. Dark diagram with recession and bankruptcy progress. Business and finance vector
Free with trial A stark red bar graph illustrates a sharp downward trend with a prominent arrow, visually representing financial decline, economic recession, or business failure. Decrease bar illustrations Red bar graph with downward arrow isolated on white background. A stark red bar graph illustrates a sharp downward trend with a prominent arrow, visually representing financial decline, economic recession, or business failure
Free with trial A bar chart showing a steady decline with a red downward arrow, symbolizing financial loss, economic downturn, business decline, or negative performance trends. Decrease bar illustrations Economic Downtrend Bar Chart for Business concept 3d Rendering. A bar chart showing a steady decline with a red downward arrow, symbolizing financial loss, economic downturn, business decline, or negative performance trends
Free with trial A bar chart showing a steady decline with a red downward arrow, symbolizing financial loss, economic downturn, business decline, or negative performance trends. Decrease bar illustrations Economic Downtrend Bar Chart for Business concept 3d Rendering. A bar chart showing a steady decline with a red downward arrow, symbolizing financial loss, economic downturn, business decline, or negative performance trends
Free with trial A bar chart showing a steady decline with a red downward arrow, symbolizing financial loss, economic downturn, business decline, or negative performance trends. Decrease bar illustrations Economic Downtrend Bar Chart for Business concept 3d Rendering. A bar chart showing a steady decline with a red downward arrow, symbolizing financial loss, economic downturn, business decline, or negative performance trends
Free with trial Abstract 3D Bar Chart Showing Data Growth. Decrease bar illustrations Abstract 3D Bar Chart Showing Data Growth
Free with trial Diagram with recession and bankruptcy. Graph with decrease report. Business and finance vector illustration. Decrease bar vectors Diagram with recession and bankruptcy. Graph with decrease report. Business and finance vector
Free with trial 3d bar chart with orange and green bars on a blue grid background isolated on white. Decrease bar illustrations 3d bar chart with orange and green bars on blue grid background graph data. 3d bar chart with orange and green bars on a blue grid background isolated on white
Free with trial Colorful bar graph with stacked segments illustrating growth and data analysis. Decrease bar vectors Colorful bar graph with stacked segments illustrating growth and data analysis
Free with trial The image depicts a bar graph displayed on an easel, illustrating a downward trend over time. The bars start high on the left and progressively decrease in height towards the right, with a red arrow emphasizing the decline. The graph's y-axis appears to measure an unspecified metric, while the x-axis represents a timeline. Decrease bar illustrations Graph showing decline over time. The image depicts a bar graph displayed on an easel, illustrating a downward trend over time. The bars start high on the left and progressively decrease in height towards the right, with a red arrow emphasizing the decline. The graph's y-axis appears to measure an unspecified metric, while the x-axis represents a timeline
Free with trial Visual representation of a financial downturn. A bar chart shows a sharp decline, accompanied by a warning sign and a gold dollar coin, symbolizing economic trouble and risk. Decrease bar illustrations Financial crisis alert decreasing bar chart with dollar coin and warning sign. Visual representation of a financial downturn. A bar chart shows a sharp decline, accompanied by a warning sign and a gold dollar coin, symbolizing economic trouble and risk.
Free with trial Diagram with recession and bankruptcy progress. Graph with decrease report. Business and finance vector. Decrease bar vectors Diagram with recession and bankruptcy progress. Graph with decrease report. Business and finance
Free with trial Doodle style bar chart with a downward trending arrow indicating financial loss. Decrease bar vectors Doodle style bar chart with a downward trending arrow indicating financial loss
Free with trial A colorful bar graph with a line graph overlayed on a blue background. it shows data trends and market analysis in a simple visual format. Decrease bar vectors Colorful bar graph with a line graph on a blue background. a colorful bar graph with a line graph overlayed on a blue background. it shows data trends and market analysis in a simple visual format
Free with trial An isometric view of a bar chart with five blue bars of decreasing height, representing a downward trend. A red arrow points downwards, indicating a negative trajectory. Decrease bar illustrations Bar chart showing a downward trend with a red arrow isolated on white background. An isometric view of a bar chart with five blue bars of decreasing height, representing a downward trend. A red arrow points downwards, indicating a negative trajectory
Free with trial Black outline of descending bar chart with downward arrow, isolated on white background. concept of economic decline, data analysis, financial crisis, statistics. Decrease bar vectors Black outline of descending bar chart with downward arrow, isolated on white background. concept of economic decline, data
Free with trial Bar graph with declining values, percentage on black square, globe in blue square. Ideal for data, statistics, global business, market trends, finance, analysis research flat simple metaphor. Decrease bar vectors Bar chart with decreasing bars alongside percentage and globe icons for data and global analytics. Bar graph with declining values, percentage on black square, globe in blue square. Ideal for data, statistics, global business, market trends, finance, analysis research flat simple metaphor
Free with trial This image shows two bar graphs. One shows an upward trend with an arrow pointing up. The other shows a downward trend with an arrow pointing down. Black and white. Decrease bar illustrations Black and white illustration showing upward and downward trending bar graphs with arrows pointing up down. This image shows two bar graphs. One shows an upward trend with an arrow pointing up. The other shows a downward trend with an arrow pointing down. Black and white.
Free with trial The image shows a visual representation of a downward trend using a bar chart and a bold red arrow pointing downward. The chart is displayed on a light-colored easel with a small figure standing behind it, suggesting a presentation or analysis of decreasing values over time, possibly in a business or financial context. Decrease bar illustrations Declining trend illustrated with bar chart and arrow on easel. The image shows a visual representation of a downward trend using a bar chart and a bold red arrow. The image shows a visual representation of a downward trend using a bar chart and a bold red arrow pointing downward. The chart is displayed on a light-colored easel with a small figure standing behind it, suggesting a presentation or analysis of decreasing values over time, possibly in a business or financial context
Free with trial Black silhouette of descending bar chart with arrow, isolated on white background. concept of financial decline, statistics, economic downturn, data analysis, business graph. Decrease bar vectors Black silhouette of descending bar chart with arrow, isolated on white background. concept of financial decline, statistics
Free with trial Falling bar chart with up and right arrows illustrating declining business trends. Decrease bar vectors Falling bar chart with up and right arrows illustrating declining business trends
Free with trial Bar chart collapse icon with downward arrow. Decline and negative trend sign symbol vector. Decrease bar vectors Bar chart collapse icon with downward arrow. Decline and negative trend sign symbol
Free with trial This image shows a bar graph with a downward trend, indicated by a red arrow. It represents a decline in business, finance, or the economy, isolated on white. Decrease bar illustrations A bar graph showing a downward trend with a red arrow isolated on white background. This image shows a bar graph with a downward trend, indicated by a red arrow. It represents a decline in business, finance, or the economy, isolated on white
Free with trial This vibrant 3D bar chart illustrates strong business growth and upward progress. The colorful, glossy bars represent data points, clearly showing an increase. Ideal for presentations and reports. Decrease bar illustrations Colorful 3D Bar Chart Showing Business Growth and Progress. This vibrant 3D bar chart illustrates strong business growth and upward progress. The colorful, glossy bars represent data points, clearly showing an increase. Ideal for presentations and reports.
Free with trial Interface displaying downward-trending bar chart and dotted line on dashboard, with ticker symbols. Finance, analytics, data visualization, investment, technological, corporate, digital. Decrease bar illustrations Interface displaying downward-trending bar chart and dotted line on dashboard, with ticker symbols
Free with trial A simple bar chart and line graph with a downward arrow illustrates a negative trend like recession or business failure ideal for financial reports about crisis or loss. Decrease bar illustrations Declining Blue Bar Chart and Line Graph Showing Financial Loss on Gray Background. A simple bar chart and line graph with a downward arrow illustrates a negative trend like recession or business failure ideal for financial reports about crisis or loss
Free with trial Up and down arrow on bar chart icon set. Growth and decline graph symbol illustration. Financial trend concept. Decrease bar vectors Up and down arrow on bar chart icon set. Growth and decline graph symbol. Financial trend concept
Free with trial Colorful Bar Chart Graph Showing Growth and Performance Over Time with Upward Trend. Decrease bar vectors Colorful Bar Chart Graph Showing Growth and Performance Over Time with Upward Trend
Free with trial A man mows grass off the top of a bar code as he is trimming prices and keeping them low in a 3-d illustration. Decrease bar vectors A man mows grass off the top of a bar code as he is trimming prices
Free with trial Conceptual graph with decrease report. Diagram with recession and bankruptcy progress. Business and finance vector illustration. Decrease bar vectors Conceptual graph with decrease report. Diagram with recession and bankruptcy progress. Business and finance vector
Free with trial Blue upward bar graph with arrow and falling coin near a sad face. Ideal for finance, economy, investment risks, financial loss, market analysis, emotional impact, business strategies. Simple flat. Decrease bar vectors Financial growth with unhappy outcome reflected by increasing bar chart, falling coin, and sad face. Blue upward bar graph with arrow and falling coin near a sad face. Ideal for finance, economy, investment risks, financial loss, market analysis, emotional impact, business strategies. Simple flat
Free with trial A simple bar chart with a falling line, symbolizing financial decline, economic downturn, decreased profits, market loss, or negative business results. Ideal for illustrating risks, challenges, crisis situations, and economic analysis. Decrease bar vectors Declining financial chart icon with downward trend showing loss, decrease and negative business performance. A simple bar chart with a falling line, symbolizing financial decline, economic downturn, decreased profits, market loss, or negative business results. Ideal for illustrating risks, challenges, crisis situations, and economic analysis.
Free with trial Visual representation of financial trends with euro symbols, depicting both upward and downward movements in bar graph format, suitable for economic analysis. Decrease bar vectors Bar charts showing euro currency growth and decline isolated on transparent background. Visual representation of financial trends with euro symbols, depicting both upward and downward movements in bar graph format, suitable for economic analysis