Free with trial Cost reduction text with downward arrow and bar chart on neutral background. Business finance concept for expense control, budget management, savings strategy, and profit optimization. Decrease bar illustrations Cost Reduction Concept with Downward Arrow and Bar Chart 3d render. Cost reduction text with downward arrow and bar chart on neutral background. Business finance concept for expense control, budget management, savings strategy, and profit optimization
Free with trial Graph going Up and Down sign with green and red arrows vector. Flat design vector illustration concept of sales bar chart symbol icon with arrow moving down and sales bar chart with arrow moving up. Decrease bar illustrations Graph going Up and Down sign with green and red arrows vector. Flat design vector illustration concept of sales bar chart symbol. Graph going Up and Down sign with green and red arrows vector. Flat design vector illustration concept of sales bar chart symbol icon with arrow moving down and sales bar chart with arrow moving up.
Free with trial Panic businesswoman watching red bar chart falling like domino effect, symbolizing financial crisis, economic downturn, business failure, risk, and market collapse concept illustration. Decrease bar vectors Panic businesswoman watching falling red bar chart like domino effect. Panic businesswoman watching red bar chart falling like domino effect, symbolizing financial crisis, economic downturn, business failure, risk, and market collapse concept illustration
Free with trial Cost reduction text with downward arrow and bar chart on neutral background. Business finance concept for expense control, budget management, savings strategy, and profit optimization. Decrease bar illustrations Cost Reduction Concept with Downward Arrow and Bar Chart 3d render. Cost reduction text with downward arrow and bar chart on neutral background. Business finance concept for expense control, budget management, savings strategy, and profit optimization
Free with trial Cost reduction text with downward arrow and bar chart on neutral background. Business finance concept for expense control, budget management, savings strategy, and profit optimization. Decrease bar illustrations Cost Reduction Concept with Downward Arrow and Bar Chart 3d render. Cost reduction text with downward arrow and bar chart on neutral background. Business finance concept for expense control, budget management, savings strategy, and profit optimization
Free with trial Cost reduction text with downward arrow and bar chart on neutral background. Business finance concept for expense control, budget management, savings strategy, and profit optimization. Decrease bar illustrations Cost Reduction Concept with Downward Arrow and Bar Chart 3d render. Cost reduction text with downward arrow and bar chart on neutral background. Business finance concept for expense control, budget management, savings strategy, and profit optimization
Free with trial Cost reduction text with downward arrow and bar chart on neutral background. Business finance concept for expense control, budget management, savings strategy, and profit optimization. Decrease bar illustrations Cost Reduction Concept with Downward Arrow and Bar Chart 3d render. Cost reduction text with downward arrow and bar chart on neutral background. Business finance concept for expense control, budget management, savings strategy, and profit optimization
Free with trial Cost reduction text with downward arrow and bar chart on neutral background. Business finance concept for expense control, budget management, savings strategy, and profit optimization. Decrease bar illustrations Cost Reduction Concept with Downward Arrow and Bar Chart 3d render. Cost reduction text with downward arrow and bar chart on neutral background. Business finance concept for expense control, budget management, savings strategy, and profit optimization
Free with trial Cost reduction text with downward arrow and bar chart on neutral background. Business finance concept for expense control, budget management, savings strategy, and profit optimization. Decrease bar illustrations Cost Reduction Concept with Downward Arrow and Bar Chart 3d render. Cost reduction text with downward arrow and bar chart on neutral background. Business finance concept for expense control, budget management, savings strategy, and profit optimization
Free with trial A bar chart showing a steady decline with a red downward arrow, symbolizing financial loss, economic downturn, business decline, or negative performance trends. Decrease bar illustrations Economic Downtrend Bar Chart for Business concept 3d Rendering. A bar chart showing a steady decline with a red downward arrow, symbolizing financial loss, economic downturn, business decline, or negative performance trends
Free with trial A bar chart showing a steady decline with a red downward arrow, symbolizing financial loss, economic downturn, business decline, or negative performance trends. Decrease bar illustrations Economic Downtrend Bar Chart for Business concept 3d Rendering. A bar chart showing a steady decline with a red downward arrow, symbolizing financial loss, economic downturn, business decline, or negative performance trends
Free with trial Decrease and increase chart icon with arrow. Negative and positive trend symbol illustration. Decrease bar vectors Decrease and increase chart icon with arrow. Negative and positive trend symbol
Free with trial Up and down arrows, bar graph, and fingerprint emphasize data analysis, growth, security, identity, biometrics, trends and technology. Ideal for business analytics privacy security technology. Decrease bar illustrations Arrows Indicating Trends With Bar Graph and Digital Fingerprint for Data and Security Concepts. Up and down arrows, bar graph, and fingerprint emphasize data analysis, growth, security, identity, biometrics, trends and technology. Ideal for business analytics privacy security technology
Free with trial Vertical arrow pointing downward next to bar graph with decreasing metrics. Ideal for business analysis, data visualization, financial downturn, market decline, trend report, economics, simple flat. Decrease bar illustrations Declining Bar Graph with Arrow Indicating Downward Trend in Performance or Statistics. Vertical arrow pointing downward next to bar graph with decreasing metrics. Ideal for business analysis, data visualization, financial downturn, market decline, trend report, economics, simple flat
Free with trial Bar chart with descending bars, coin falling, minimal cloud above. Ideal for finance, economy, loss, risk, business investments or savings themes. Simple flat metaphor. Decrease bar vectors Decreasing Bar Chart with Dropping Coin Symbolizing Financial Decline and Economic Challenges. Bar chart with descending bars, coin falling, minimal cloud above. Ideal for finance, economy, loss, risk, business investments or savings themes. Simple flat metaphor
Free with trial Statistic Bar Chart Outline Sign Data Stats Business Performance Market Analysis Economic Trend Line Icon Presentation Display Board Symbol. Decrease bar vectors Statistic Bar Chart Outline Sign Data Stats Business Performance Market Analysis Economic Trend Line Icon Presentation Display
Free with trial Financial crisis recession falling graph chart warning declining bar and line graph red exclamation coins documents cityscape abstract background Vector illustration. Decrease bar vectors Financial crisis recession falling graph chart warning declining bar and line graph red exclamation coins documents cityscape
Free with trial Minimalist outline drawing of a bar chart representing data analysis and statistical information. Great for presentations and data representations. Decrease bar vectors Simple Outline Bar Chart Sign Statistical Data Analysis Diagram Icon. Minimalist outline drawing of a bar chart representing data analysis and statistical information. Great for presentations and data representations.
Free with trial A simple line art icon illustration showing a decreasing bar chart with an arrow pointing downward. This minimalist design is suitable for presentations, websites, and other visuals related to financial loss, economic downturn, or market decline. Decrease bar vectors Simple Line Art Decrease Chart Icon Illustration for Financial Report. A simple line art icon illustration showing a decreasing bar chart with an arrow pointing downward. This minimalist design is suitable for presentations, websites, and other visuals related to financial loss, economic downturn, or market decline.
Free with trial Two simple black bar graphs illustrate a downward trend with arrows, symbolizing financial loss and economic decline. Decrease bar vectors Two downward trending bar graphs with diagonal arrows showing decline. Two simple black bar graphs illustrate a downward trend with arrows, symbolizing financial loss and economic decline
Free with trial The image depicts a bar graph with a downward trend. The bars, which start at a higher value on the left, progressively decrease in height towards the right. A large red arrow, pointing downwards, emphasizes the declining trend. This visual representation suggests a continuous decrease in performance, sales, or another measured metric over a specified period. Decrease bar illustrations Decline in performance over time. The image depicts a bar graph with a downward trend. The bars, which start at a higher value on the left, progressively decrease in height towards the right. A large red arrow, pointing downwards, emphasizes the declining trend. This visual representation suggests a continuous decrease in performance, sales, or another measured metric over a specified period
Free with trial Bar graph decreasing in height beside falling coins merging into cloud. Ideal for finance, economy, business risk, savings, investment, financial crisis, wealth management. Simple flat metaphor. Decrease bar vectors Financial decline represented with bar graph and coins falling into cloud symbolizing loss. Bar graph decreasing in height beside falling coins merging into cloud. Ideal for finance, economy, business risk, savings, investment, financial crisis, wealth management. Simple flat metaphor
Free with trial Gear icon beside descending bar chart emphasizing reduction trends. Ideal for performance assessment, process decline, economic studies, management, analytics, workflow, simple flat metaphor. Decrease bar illustrations Gear and Declining Bar Chart Representing Process Downsizing or Performance Reduction. Gear icon beside descending bar chart emphasizing reduction trends. Ideal for performance assessment, process decline, economic studies, management, analytics, workflow, simple flat metaphor
Free with trial This bar and line graph illustrates a declining trend in data values over a period of months. The x-axis represents time in months from January to December, while the y-axis shows the values ranging from 0 to 800. The red bars indicate the monthly data values, and the red line represents the overall trend. The trend shows a consistent decrease in values from January to December. Decrease bar illustrations Decline in monthly data over time. This bar and line graph illustrates a declining trend in data values over a period of months. The x-axis represents time in months from January to December, while the y-axis shows the values ranging from 0 to 800. The red bars indicate the monthly data values, and the red line represents the overall trend. The trend shows a consistent decrease in values from January to December
Free with trial Sad face emoticon beside password entry field and decreasing bar chart. Ideal for cybersecurity, data loss, decline, failure, frustration, protection issues, simple flat metaphor. Decrease bar vectors Sad face with password entry and declining bar chart conveying data security or performance issues. Sad face emoticon beside password entry field and decreasing bar chart. Ideal for cybersecurity, data loss, decline, failure, frustration, protection issues, simple flat metaphor
Free with trial This image displays a set of stylized bar chart icons representing financial and business trends. The leftmost icon features green bars increasing in height, accompanied by a green upward-pointing arrow, symbolizing growth and success. The middle icon shows red bars decreasing in height, with a black downward-pointing arrow indicating decline and loss. The right side presents two smaller black and white bar charts, also depicting downward trends. These icons are ideal for illustrating concepts like profit, loss, market trends, economic performance, and data analysis. Decrease bar illustrations Growth and Decline Bar Chart Icons. This image displays a set of stylized bar chart icons representing financial and business trends. The leftmost icon features green bars increasing in height, accompanied by a green upward-pointing arrow, symbolizing growth and success. The middle icon shows red bars decreasing in height, with a black downward-pointing arrow indicating decline and loss. The right side presents two smaller black and white bar charts, also depicting downward trends. These icons are ideal for illustrating concepts like profit, loss, market trends, economic performance, and data analysis.
Free with trial Building wooden bar graph with hand, representing growth and progress -. Decrease bar illustrations Building wooden bar graph with hand, representing growth and progress
Free with trial The image depicts symbols of currency exchange and economic growth. It features a dollar sign ($) and a euro symbol (€) with an upward arrow indicating growth. Next to the dollar sign, there is a green bar with a plus 2. 5% sign, suggesting an increase in value. Beside the euro symbol, there is a red bar with a minus 0. 5% sign, indicating a decrease in value. The overall concept highlights the. Decrease bar illustrations Currency exchange and economic growth
Free with trial This image displays a 3D bar graph with five vertical bars of decreasing height, rendered in a vibrant pink color. A pink line graph with a sharp downward trajectory originates from the top of the tallest bar and descends across the bars, ending at the base of the shortest bar. The entire composition is isolated on a clean white background, clearly illustrating a negative trend or decline. Decrease bar illustrations A pink 3D bar graph with a descending line graph on a white background chart. This image displays a 3D bar graph with five vertical bars of decreasing height, rendered in a vibrant pink color. A pink line graph with a sharp downward trajectory originates from the top of the tallest bar and descends across the bars, ending at the base of the shortest bar. The entire composition is isolated on a clean white background, clearly illustrating a negative trend or decline
Free with trial The image depicts a bar graph with a downward trend. The bars are colored in red, blue, and dark red, showing a decline from left to right. The red line on top of the bars indicates a continuous decrease in values. The graph is displayed on a dark background with a metallic base. Decrease bar illustrations Decreasing bar graph with downward trend. The image depicts a bar graph with a downward trend. The bars are colored in red, blue, and dark red, showing a decline from left to right. The red line on top of the bars indicates a continuous decrease in values. The graph is displayed on a dark background with a metallic base
Free with trial A bar graph displaying a downward trend with a large arrow pointing downwards, indicating a decline in values. Decrease bar illustrations Decreasing bar graph with downward arrow. A bar graph displaying a downward trend with a large arrow pointing downwards, indicating a decline in values
Free with trial A 3D bar graph showing a downward trend with a red arrow indicating a decline. Decrease bar illustrations Decreasing bar graph with downward trend. A 3D bar graph showing a downward trend with a red arrow indicating a decline
Free with trial A 3D render depicting a financial concept. A purple bar chart shows increasing height from left to right, but a large yellow arrow curves downwards, indicating a significant decline. A single yellow coin is positioned above the tallest bar. The entire composition is isolated on a white background. Decrease bar illustrations 3D Render of a Falling Yellow Arrow Over a Purple Bar Chart with a Yellow Coin falling arrow. A 3D render depicting a financial concept. A purple bar chart shows increasing height from left to right, but a large yellow arrow curves downwards, indicating a significant decline. A single yellow coin is positioned above the tallest bar. The entire composition is isolated on a white background
Free with trial A 3D rendered image depicting a financial graph with a prominent red arrow indicating a downward trend. The graph features a bar chart with several red bars, showing a decline in value. The background is a dark grid, emphasizing the data visualization. This image is ideal for representing financial losses, economic downturns, market crashes, or negative performance in business and investment contexts. Decrease bar illustrations Red Arrow Downward Trend Graph with Bar Chart. A 3D rendered image depicting a financial graph with a prominent red arrow indicating a downward trend. The graph features a bar chart with several red bars, showing a decline in value. The background is a dark grid, emphasizing the data visualization. This image is ideal for representing financial losses, economic downturns, market crashes, or negative performance in business and investment contexts.
Free with trial Rejection, negative feedback, failure, financial loss, poor performance, declining trends. Hand raised in stop gesture, sad face and declining bar graph. Rejection and negative feedback concept. Decrease bar illustrations Hand Gesture with Sad Face and Declining Bar Graph Rejection, Negative Trends, or Failure Concepts. Rejection, negative feedback, failure, financial loss, poor performance, declining trends. Hand raised in stop gesture, sad face and declining bar graph. Rejection and negative feedback concept
Free with trial An illustrative bar chart depicts a clear financial decline, with five orange bars progressively decreasing in height from left to right. Each bar is topped with a black-outlined money bag containing a dollar sign, symbolizing diminishing wealth, income, or investment. This simple, flat design icon effectively conveys concepts of financial loss, economic downturn, decreasing profits, or budget cuts, suitable for business reports, presentations, and articles on market trends or investment risks. Decrease bar vectors Financial Decline Bar Chart with Money Bags. An illustrative bar chart depicts a clear financial decline, with five orange bars progressively decreasing in height from left to right. Each bar is topped with a black-outlined money bag containing a dollar sign, symbolizing diminishing wealth, income, or investment. This simple, flat design icon effectively conveys concepts of financial loss, economic downturn, decreasing profits, or budget cuts, suitable for business reports, presentations, and articles on market trends or investment risks.
Free with trial A 3D bar graph with bars of decreasing height, representing a downward trend. A prominent red arrow points downwards, signifying a decline or loss. The background is a subtle gradient. This visual effectively communicates concepts like financial crisis, economic recession, market crash, or business failure. Decrease bar illustrations Financial downturn illustrated by a declining bar graph and red arrow. A 3D bar graph with bars of decreasing height, representing a downward trend. A prominent red arrow points downwards, signifying a decline or loss. The background is a subtle gradient. This visual effectively communicates concepts like financial crisis, economic recession, market crash, or business failure
Free with trial Business charts, data visualization, financial analysis, progress tracking, statistics, graphs, analysis, charts bar in line, orange. Decrease bar vectors Collection of diverse orange bar charts and line graph against a white background. Business charts, data visualization, financial analysis, progress tracking, statistics, graphs, analysis, charts bar in line, orange
Free with trial A clean and simple illustration of a bar chart icon. The chart features three bars of varying heights, colored in shades of yellow and green, outlined in dark blue. The design is minimalist and suitable for a wide range of applications, including presentations, infographics, and web design. It conveys concepts of data analysis, growth, and statistics. Decrease bar illustrations Simple Bar Chart Icon. A clean and simple illustration of a bar chart icon. The chart features three bars of varying heights, colored in shades of yellow and green, outlined in dark blue. The design is minimalist and suitable for a wide range of applications, including presentations, infographics, and web design. It conveys concepts of data analysis, growth, and statistics.
Free with trial A 3D financial chart depicting a stock market downturn. The chart features blue and pink bar graphs with numerical values like 45,971 and 37,020. A red downward-curving line with arrows illustrates the declining trend. The background is dark, emphasizing the vibrant colors of the bars and line. Small numbers indicate data points along the bottom, highlighting the decrease in value over time. The visual representation effectively conveys a negative financial trend. Decrease bar illustrations Declining Stock Market Performance Financial Charts Showing Downturn Trend. A 3D financial chart depicting a stock market downturn. The chart features blue and pink bar graphs with numerical values like 45,971 and 37,020. A red downward-curving line with arrows illustrates the declining trend. The background is dark, emphasizing the vibrant colors of the bars and line. Small numbers indicate data points along the bottom, highlighting the decrease in value over time. The visual representation effectively conveys a negative financial trend.
Free with trial A clean, minimalist 3D bar chart made of translucent blue blocks illustrates a steady decline. This powerful visual represents concepts like economic downturn, financial recession, reduced sales, or negative performance data, making it ideal for business reports and presentations. Decrease bar illustrations Economic Downturn Concept with Blue Bar Graph. A clean, minimalist 3D bar chart made of translucent blue blocks illustrates a steady decline. This powerful visual represents concepts like economic downturn, financial recession, reduced sales, or negative performance data, making it ideal for business reports and presentations
Free with trial A stark red arrow plunges downwards across a gray bar graph, symbolizing a significant financial or economic downturn. Decrease bar illustrations Red arrow shows steep decline on gray bar graph. A stark red arrow plunges downwards across a gray bar graph, symbolizing a significant financial or economic downturn
Free with trial Red bar graph with downward trend line and arrow. Four vertical bars decrease in height from left to right, illustrating a declining pattern. Bold, simple vector style on a white background, emphasizing financial or statistical downward movement. Decrease bar illustrations Graph down or scale down vector art illustration. Red bar graph with downward trend line and arrow. Four vertical bars decrease in height from left to right, illustrating a declining pattern. Bold, simple vector style on a white background, emphasizing financial or statistical downward movement.
Free with trial A bar graph with a red downward arrow illustrates a decline in data over time. Decrease bar illustrations Decline in bar graph indicates downward trend. A bar graph with a red downward arrow illustrates a decline in data over time
Free with trial A 3D rendered image of a simple bar chart featuring two rounded vertical columns, one red and one blue, standing on a dark gray oval base. The blue column is taller than the red one, suggesting a comparison or growth. The objects are set against a clean, light gray background with subtle shadows, highlighting their form and isolation. Decrease bar illustrations 3D Rendered Bar Chart with Red and Blue Columns on a Gray Base graph data. A 3D rendered image of a simple bar chart featuring two rounded vertical columns, one red and one blue, standing on a dark gray oval base. The blue column is taller than the red one, suggesting a comparison or growth. The objects are set against a clean, light gray background with subtle shadows, highlighting their form and isolation
Free with trial A vibrant bar chart displays a spectrum of colors, showing a decrease then increase in data points against a soft blue background. Decrease bar illustrations Colorful bar chart illustrating growth and decline with a gradient of hues. A vibrant bar chart displays a spectrum of colors, showing a decrease then increase in data points against a soft blue background
Free with trial This 3D render depicts a stark red downward trend line superimposed over a grid background, with a bar chart showing declining values. The composition visually represents financial loss, economic downturn, market crash, or negative performance. The bold red color and sharp angles convey urgency and a sense of crisis, making it ideal for illustrating concepts related to business failure, stock market decline, or any situation involving a significant negative trajectory. Decrease bar illustrations Red Downward Trend Graph with Bar Chart. This 3D render depicts a stark red downward trend line superimposed over a grid background, with a bar chart showing declining values. The composition visually represents financial loss, economic downturn, market crash, or negative performance. The bold red color and sharp angles convey urgency and a sense of crisis, making it ideal for illustrating concepts related to business failure, stock market decline, or any situation involving a significant negative trajectory.
Free with trial A 3D bar chart displays four vertical bars in red, yellow, green, and blue, arranged in descending order of height. A thick black arrow curves downwards from the top right, pointing towards the shortest bar, indicating a negative trend or decline. The chart is presented on a plain white background. Decrease bar illustrations Downward Trending Bar Chart with Black Arrow on White Background graph data. A 3D bar chart displays four vertical bars in red, yellow, green, and blue, arranged in descending order of height. A thick black arrow curves downwards from the top right, pointing towards the shortest bar, indicating a negative trend or decline. The chart is presented on a plain white background
Free with trial A 3D render depicts a series of translucent blue glass bars arranged in ascending order, representing a bar chart. A large, sharp blue glass arrow points downwards, diagonally crossing the bars and indicating a sharp decline or negative trend. The composition is set against a light gray, subtly textured background, emphasizing the abstract and conceptual nature of the graphic. Decrease bar illustrations Blue Glass Bar Chart with Downward Arrow Symbolizing Financial Decline graph. A 3D render depicts a series of translucent blue glass bars arranged in ascending order, representing a bar chart. A large, sharp blue glass arrow points downwards, diagonally crossing the bars and indicating a sharp decline or negative trend. The composition is set against a light gray, subtly textured background, emphasizing the abstract and conceptual nature of the graphic
Free with trial A black icon depicts a bar graph with four ascending bars. An upward-trending curved arrow originates from the left and sweeps over the bars, indicating growth. A downward-pointing arrow is positioned below the bars on the right. The text "APERTURE F 1. 4 ISO 1600" is visible below the graphic. Decrease bar illustrations Black Bar Graph with Upward Trending Arrow and Downward Arrow Icon chart statistics. A black icon depicts a bar graph with four ascending bars. An upward-trending curved arrow originates from the left and sweeps over the bars, indicating growth. A downward-pointing arrow is positioned below the bars on the right. The text "APERTURE F 1.4 ISO 1600" is visible below the graphic
Free with trial A cartoon-style illustration of a bar graph displayed on a presentation screen. The graph shows three bars of different heights and colors (green, orange, and yellow), indicating growth or progress. The image is clean and simple, suitable for illustrating business, finance, or educational concepts in a visually appealing way. Decrease bar illustrations Cartoon Bar Graph Presentation. A cartoon-style illustration of a bar graph displayed on a presentation screen. The graph shows three bars of different heights and colors (green, orange, and yellow), indicating growth or progress. The image is clean and simple, suitable for illustrating business, finance, or educational concepts in a visually appealing way.
Free with trial A clean and modern isometric bar graph illustration. Three colored bars, blue, green, and yellow, represent data points with corresponding numerical values displayed above each bar. The graphic is set against a white background, making it suitable for various presentations, reports, or website designs related to data analysis, business, or education. The simple design offers a clear visual representation of data comparison. Decrease bar illustrations Isometric Bar Graph Illustrating Data and Statistics. A clean and modern isometric bar graph illustration. Three colored bars, blue, green, and yellow, represent data points with corresponding numerical values displayed above each bar. The graphic is set against a white background, making it suitable for various presentations, reports, or website designs related to data analysis, business, or education. The simple design offers a clear visual representation of data comparison.
Free with trial Hand drawn 3d isometric illustration showing a blue Indian rupee currency coin next to a yellow decreasing bar chart and a downward pointing arrow on an alpha transparent background, depicting financial decline and economic recession. Decrease bar vectors 3D isometric doodle of Indian rupee coin with negative growth bar chart alpha transparent. Hand drawn 3d isometric illustration showing a blue Indian rupee currency coin next to a yellow decreasing bar chart and a downward pointing arrow on an alpha transparent background, depicting financial decline and economic recession.
Free with trial Black rectangle halftone pattern on white, Geometric bar size gradient, Centered black block repeat. Vector Illustration editable. Decrease bar vectors Black rectangle halftone pattern on white, Geometric bar size gradient, Centered black block repeat. Vector Illustration editable
Free with trial A professional 3D rendering of a bar chart representing a negative trend or financial loss. The illustration features three textured blue metallic columns with a prominent, jagged red arrow pointing downwards across them. This graphic symbolizes economic recession, market crashes, or decreasing sales figures. It is mounted on a sleek grey base and isolated on a white background, making it perfect for business presentations, investment risk analysis, and economic reports. Decrease bar vectors 3D Downward Bar Chart with Red Arrow - Financial Loss & Recession Concept. A professional 3D rendering of a bar chart representing a negative trend or financial loss. The illustration features three textured blue metallic columns with a prominent, jagged red arrow pointing downwards across them. This graphic symbolizes economic recession, market crashes, or decreasing sales figures. It is mounted on a sleek grey base and isolated on a white background, making it perfect for business presentations, investment risk analysis, and economic reports.
Free with trial A simple hand-drawn illustration of a bar chart or graph. The chart is rendered in black lines on a white background, with the lower portions of the bars filled with diagonal hatching. This image can be used to represent data, statistics, growth, progress, or analysis in a visually appealing and informal way. Suitable for presentations, reports, or website graphics. Decrease bar illustrations Hand-Drawn Bar Chart Illustration. A simple hand-drawn illustration of a bar chart or graph. The chart is rendered in black lines on a white background, with the lower portions of the bars filled with diagonal hatching. This image can be used to represent data, statistics, growth, progress, or analysis in a visually appealing and informal way. Suitable for presentations, reports, or website graphics.
Free with trial A 3D bar chart displays four vertical bars of different heights and colors: red, yellow, green, and blue, arranged from left to right. A thick black arrow with a curved trajectory descends from the top right, pointing downwards and passing over the bars, indicating a negative trend or decline. The entire graphic is set against a plain white background. Decrease bar illustrations Downward Trending Bar Chart with a Black Arrow on White Background graph statistics. A 3D bar chart displays four vertical bars of different heights and colors: red, yellow, green, and blue, arranged from left to right. A thick black arrow with a curved trajectory descends from the top right, pointing downwards and passing over the bars, indicating a negative trend or decline. The entire graphic is set against a plain white background
Free with trial A 3D cartoon illustration depicts a stylized hand with a black suit cuff pointing a finger downwards towards a red bar graph. The graph shows a clear downward trend with bars decreasing in height from left to right, colored green, yellow, orange, and red. A red arrow reinforces the concept of decline. The image is set against a white background. Decrease bar illustrations 3D Cartoon Hand Pointing Down at a Declining Bar Graph on White Background business. A 3D cartoon illustration depicts a stylized hand with a black suit cuff pointing a finger downwards towards a red bar graph. The graph shows a clear downward trend with bars decreasing in height from left to right, colored green, yellow, orange, and red. A red arrow reinforces the concept of decline. The image is set against a white background
Free with trial Declining bar chart. Wheat spikelets concept. Agricultural crisis symbol. Vector harvest illustration. EPS 10. Decrease bar vectors Declining bar chart. Wheat spikelets concept. Agricultural crisis symbol. Vector harvest illustration.
Free with trial A 3D cartoon illustration depicts a stylized hand in a black suit jacket and white shirt cuff pointing its index finger downwards towards a red bar graph. The bar graph features several vertical bars of varying heights and colors, including green, yellow, orange, and red, arranged in a descending order from left to right, visually representing a decline. The entire graphic is presented on a clean. Decrease bar illustrations 3D Cartoon Hand Pointing Down at Declining Bar Graph on White Background image photo. A 3D cartoon illustration depicts a stylized hand in a black suit jacket and white shirt cuff pointing its index finger downwards towards a red bar graph. The bar graph features several vertical bars of varying heights and colors, including green, yellow, orange, and red, arranged in a descending order from left to right, visually representing a decline. The entire graphic is presented on a clean
Free with trial A simple and bold icon illustration of a bar graph. This can be used to represent data, statistics, growth, or trends. The icon is designed in a clean and minimalist style, making it versatile for various applications. Decrease bar vectors Simple Bold Bar Graph Sign Shape Icon for Data Presentation. A simple and bold icon illustration of a bar graph. This can be used to represent data, statistics, growth, or trends. The icon is designed in a clean and minimalist style, making it versatile for various applications.
Free with trial A glowing neon red bar chart shows a significant downward trend, symbolizing financial loss or negative growth on a black backdrop. Decrease bar illustrations Neon red bar chart illustrating a steep decline in financial performance against a dark background. A glowing neon red bar chart shows a significant downward trend, symbolizing financial loss or negative growth on a black backdrop
Free with trial A hand-drawn bar chart shows a downward trend with a line graph indicating a significant decrease in value over time. Decrease bar vectors Downturn graph illustrating declining trends and financial loss. A hand-drawn bar chart shows a downward trend with a line graph indicating a significant decrease in value over time
Free with trial Orange bar chart showing progressive data decline paired with a sad face icon suggesting disappointment. Ideal for business loss, failure, negative feedback, underperformance, worry, challenges. Decrease bar vectors Bar Chart with Declining Data and Sad Face Icon Representing Negative Trends. Orange bar chart showing progressive data decline paired with a sad face icon suggesting disappointment. Ideal for business loss, failure, negative feedback, underperformance, worry, challenges
Free with trial A 3D render of a golden bar chart with bars decreasing in height from left to right, indicating a downward trend. The bars are metallic and shiny, casting subtle shadows on the white background. This visual represents financial decline, economic downturn, or negative performance. Decrease bar illustrations Golden Bar Chart Showing Downward Trend on White Background graph decline. A 3D render of a golden bar chart with bars decreasing in height from left to right, indicating a downward trend. The bars are metallic and shiny, casting subtle shadows on the white background. This visual represents financial decline, economic downturn, or negative performance
Free with trial A straightforward and clear vector graphic of a bar chart illustrating a negative trend. The solid black bars steadily decrease in height from left to right. A thick diagonal arrow points downward, connecting the top of the first bar to the end of the chart, visually emphasizing the decline. This minimalist design is perfect for representing losses, financial downturns, or decreasing statistics. Decrease bar illustrations Declining Bar Chart Icon, AI Generated. A straightforward and clear vector graphic of a bar chart illustrating a negative trend. The solid black bars steadily decrease in height from left to right. A thick diagonal arrow points downward, connecting the top of the first bar to the end of the chart, visually emphasizing the decline. This minimalist design is perfect for representing losses, financial downturns, or decreasing statistics.
Free with trial A 3D rendered graphic depicts a simplified bar chart with pastel colored bars in pink, yellow, and blue. A line graph with white lines and orange and yellow nodes crosses diagonally above the bars. The elements are set against a light blue background with a light tan border, all isolated on a white background. Decrease bar vectors 3 D cartoon bar chart with line graph on blue background data. A 3D rendered graphic depicts a simplified bar chart with pastel colored bars in pink, yellow, and blue. A line graph with white lines and orange and yellow nodes crosses diagonally above the bars. The elements are set against a light blue background with a light tan border, all isolated on a white background
Free with trial Golden bar chart with downward arrow and dollar coin. Symbolizes economic decline, financial loss, market crash, recession, currency depreciation, business challenges. Decrease bar illustrations Economic downturn represented by golden bar chart and dollar. Golden bar chart with downward arrow and dollar coin. Symbolizes economic decline, financial loss, market crash, recession, currency depreciation, business challenges
Free with trial This image features a decreasing bar graph with a red downward arrow, isolated on a white background. The graph illustrates a downward trend in data, with blue bars progressively getting shorter. The white background provides a clean and clear contrast, emphasizing the visual elements of the graph. Decrease bar illustrations Decreasing bar graph arrow down isolated on white background. This image features a decreasing bar graph with a red downward arrow, isolated on a white background. The graph illustrates a downward trend in data, with blue bars progressively getting shorter. The white background provides a clean and clear contrast, emphasizing the visual elements of the graph
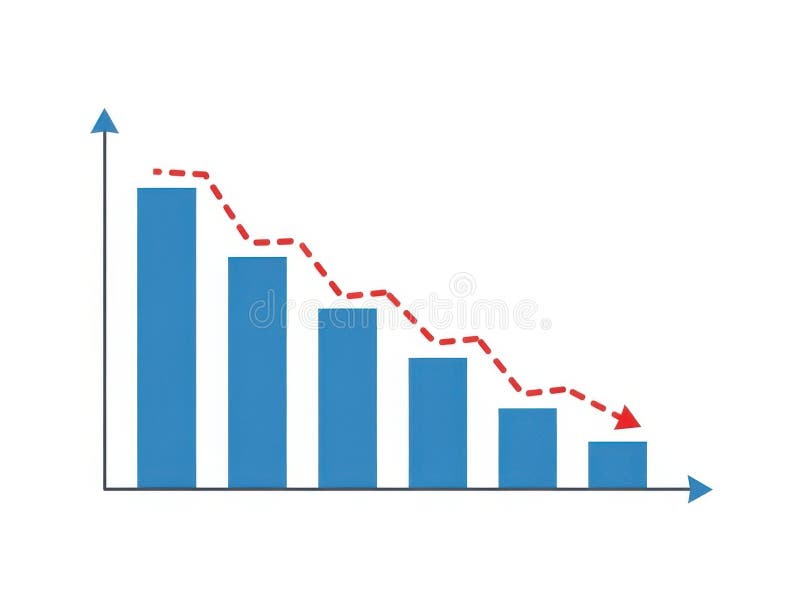
Free with trial This image features a bar chart with a decreasing trend isolated on a white background. The chart displays blue bars that progressively decrease in height from left to right, with a red dashed line indicating the downward trend. The horizontal axis represents different categories, while the vertical axis shows the corresponding values. The image is clear and SEO-friendly, highlighting data. Decrease bar illustrations Bar chart with decreasing trend isolated on white background. This image features a bar chart with a decreasing trend isolated on a white background. The chart displays blue bars that progressively decrease in height from left to right, with a red dashed line indicating the downward trend. The horizontal axis represents different categories, while the vertical axis shows the corresponding values. The image is clear and SEO-friendly, highlighting data