Free with trial This 3D bar graph, generated by AI, visually represents a sharp market decline. The red bars show a dramatic decrease in value, culminating in a broken arrow symbolizing a complete market crash. The image powerfully illustrates economic downturn. Decrease bar illustrations Declining Bar Graph: Market Crash. This 3D bar graph, generated by AI, visually represents a sharp market decline. The red bars show a dramatic decrease in value, culminating in a broken arrow symbolizing a complete market crash. The image powerfully illustrates economic downturn.
Free with trial Minimalistic human head profile alongside descending bar chart, showcasing analysis, statistics, and progress trends. Ideal for business, evaluation, decision-making, trends, growth performance. Decrease bar illustrations Human Profile Beside Downward Bar Chart Representing Analytics and Performance Trends. Minimalistic human head profile alongside descending bar chart, showcasing analysis, statistics, and progress trends. Ideal for business, evaluation, decision-making, trends, growth performance
Free with trial Financial bar chart with green up and red down arrow. Economic growth and decline symbol vector. Decrease bar vectors Financial bar chart with green up and red down arrow. Economic growth and decline symbol
Free with trial This 3D bar graph, generated by AI, visually represents a significant downward trend. The red bars show a decrease in value over time, culminating in a sharp drop indicated by the prominent red arrow. This image is ideal for illustrating economic downturns, market crashes, or any scenario depicting. Decrease bar illustrations Declining Bar Graph. This 3D bar graph, generated by AI, visually represents a significant downward trend. The red bars show a decrease in value over time, culminating in a sharp drop indicated by the prominent red arrow. This image is ideal for illustrating economic downturns, market crashes, or any scenario depicting
Free with trial An outline vector icon of a bar graph showing a downward progression, indicating a decrease or negative trend. Represents statistics, data decline, losses, or reduction over categories or time. Useful for financial reporting and business analysis showing reduction, vector design Generative AI. Decrease bar vectors Decreasing Trend Bar Graph Statistics Vector Outline, vector design Generative AI. An outline vector icon of a bar graph showing a downward progression, indicating a decrease or negative trend. Represents statistics, data decline, losses, or reduction over categories or time. Useful for financial reporting and business analysis showing reduction, vector design Generative AI
Free with trial A 3D white bar chart shows a significant downward trend indicated by a sharp, angled arrow pointing downwards. The bars decrease in height from left to right, illustrating a concept of decline or loss. The clean white background emphasizes the minimalist design and the stark visual representation of negative growth. Decrease bar illustrations 3D White Bar Chart with Downward Trending Arrow on White Background graph decline. A 3D white bar chart shows a significant downward trend indicated by a sharp, angled arrow pointing downwards. The bars decrease in height from left to right, illustrating a concept of decline or loss. The clean white background emphasizes the minimalist design and the stark visual representation of negative growth
Free with trial A stark vector illustration of a bar chart showing a sharp decrease, indicated by a downward-pointing red arrow. This icon effectively represents economic downturns, financial losses, declining trends, or negative performance metrics. Ideal for business reports, financial analysis, or news graphics, vector design Generative AI. Decrease bar vectors . A stark vector illustration of a bar chart showing a sharp decrease, indicated by a downward-pointing red arrow. This icon effectively represents economic downturns, financial losses, declining trends, or negative performance metrics. Ideal for business reports, financial analysis, or news graphics, vector design Generative AI
Free with trial Beige mailbox on wooden post with a declining bar graph, suggesting a decrease in mail volume or economic downturn. Image is digitally rendered. Decrease bar illustrations Beige Mailbox and Declining Bar Graph on Wooden Post. Beige mailbox on wooden post with a declining bar graph, suggesting a decrease in mail volume or economic downturn. Image is digitally rendered
Free with trial A series of black bar graphs are shown with downward-pointing arrows. Some arrows are green, indicating a slight decline, while others are red, signifying a more significant drop. The visual represents financial or data trends of decrease. Decrease bar illustrations Bar Graphs with Downward Arrows in Green and Red downward trend. A series of black bar graphs are shown with downward-pointing arrows. Some arrows are green, indicating a slight decline, while others are red, signifying a more significant drop. The visual represents financial or data trends of decrease
Free with trial A 3D rendered bar chart displaying a downward trend. The bars, colored black, blue, green, yellow, and orange, decrease in height from left to right. A bold red arrow points downwards, diagonally across the bars, indicating a decline or loss. The chart is presented on a white background. Decrease bar illustrations 3D Bar Chart with Red Downward Arrow on White Background. A 3D rendered bar chart displaying a downward trend. The bars, colored black, blue, green, yellow, and orange, decrease in height from left to right. A bold red arrow points downwards, diagonally across the bars, indicating a decline or loss. The chart is presented on a white background
Free with trial This 3D rendered bar graph, generated by AI, visually represents a downward trend. The red bars progressively decrease in height, illustrating a clear decline. Perfect for illustrating concepts related to loss, decrease, or decline in presentations and reports. Decrease bar illustrations Declining Bar Graph. This 3D rendered bar graph, generated by AI, visually represents a downward trend. The red bars progressively decrease in height, illustrating a clear decline. Perfect for illustrating concepts related to loss, decrease, or decline in presentations and reports.
Free with trial This image shows a bar graph depicting a downward trend. A red arrow highlights the decrease in quarterly sales from Q1 to Q4, indicating negative growth and financial loss. Decrease bar illustrations Declining Bar Graph with Red Arrow Depicts Sales Performance. This image shows a bar graph depicting a downward trend. A red arrow highlights the decrease in quarterly sales from Q1 to Q4, indicating negative growth and financial loss.
Free with trial A 3D bar graph with a red line graph indicating a significant decrease, isolated on a clean white background. Decrease bar illustrations Bar graph showing downward trend isolated on white background. A 3D bar graph with a red line graph indicating a significant decrease, isolated on a clean white background
Free with trial A clear flat vector icon representing a bar chart with a downward-pointing red arrow, symbolizing decline, loss, or negative growth. This design is useful for financial reports, risk analysis, or any situation indicating a decrease in performance or value. It communicates challenges, vector design Generative AI. Decrease bar vectors Bar Chart Downtrend Icon, Decline, Loss, Negative Growth, Business, vector design Generative AI. A clear flat vector icon representing a bar chart with a downward-pointing red arrow, symbolizing decline, loss, or negative growth. This design is useful for financial reports, risk analysis, or any situation indicating a decrease in performance or value. It communicates challenges, vector design Generative AI
Free with trial A minimalist graphic depicting a bar chart with falling bars and a downward-pointing arrow, symbolizing a negative trend, economic downturn, or performance decline. Clean and clear representation of loss. Decrease bar illustrations Simple downward trend bar chart icon indicating decline or decrease. A minimalist graphic depicting a bar chart with falling bars and a downward-pointing arrow, symbolizing a negative trend, economic downturn, or performance decline. Clean and clear representation of loss
Free with trial A 3D illustration featuring a bar chart with four ascending blue bars of varying heights, representing data growth. To the right of the chart are two white arrows, one pointing upwards and the other downwards, symbolizing increase and decrease respectively. The entire graphic is presented on a clean white background. Decrease bar illustrations 3D Bar Chart with Up and Down Arrows on White Background graph statistics. A 3D illustration featuring a bar chart with four ascending blue bars of varying heights, representing data growth. To the right of the chart are two white arrows, one pointing upwards and the other downwards, symbolizing increase and decrease respectively. The entire graphic is presented on a clean white background
Free with trial A whiteboard easel displays a bar graph with a downward trend and a red arrow indicating a decrease, isolated on a white background. Decrease bar illustrations Business bar chart showing decline isolated on white background. A whiteboard easel displays a bar graph with a downward trend and a red arrow indicating a decrease, isolated on a white background
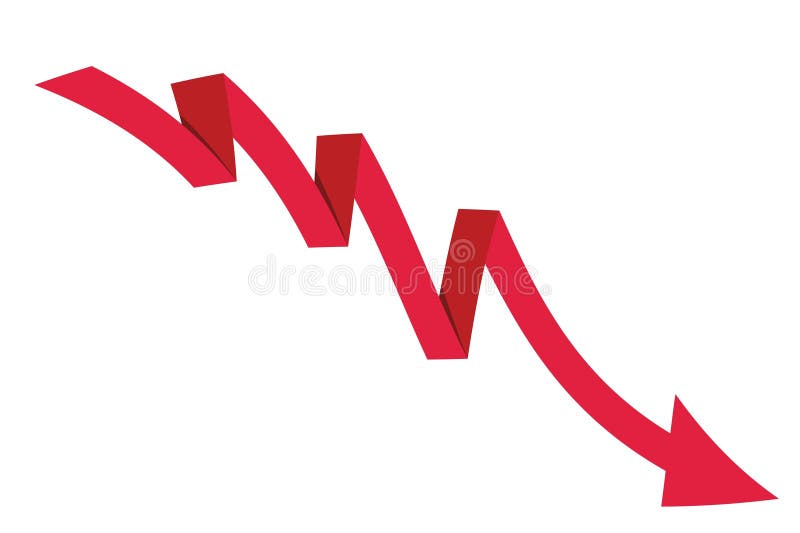
Free with trial Downward trend bar chart with arrow showing financial economic decline loss decrease. Decrease bar vectors Downward trend bar chart with arrow showing financial economic decline loss decrease
Free with trial A minimalist 3D white bar chart displays a clear downward trend. Four bars of decreasing height are shown, with a sharp white arrow pointing downwards from the top of the second bar, indicating a significant decline. The chart is presented in isolation against a clean white background, emphasizing the concept of financial or economic downturn. Decrease bar illustrations 3D White Bar Chart with a Downward Trending Arrow Symbolizing Decline graph decrease. A minimalist 3D white bar chart displays a clear downward trend. Four bars of decreasing height are shown, with a sharp white arrow pointing downwards from the top of the second bar, indicating a significant decline. The chart is presented in isolation against a clean white background, emphasizing the concept of financial or economic downturn
Free with trial Vertical bar graph, bars decrease left to right, red arrow points down Vertical Mobile Wallpaper. Decrease bar illustrations Vertical bar graph, bars decrease left to right, red arrow points down
Free with trial Vertical bar graph, bars decrease left to right, red arrow points down For Social Media Post Size. Decrease bar illustrations Vertical bar graph, bars decrease left to right, red arrow points down
Free with trial Vertical bar graph, bars decrease left to right, red arrow points down Generative AI. Decrease bar illustrations Vertical bar graph, bars decrease left to right, red arrow points down
Free with trial This image features six black bar chart icons with red and green arrows showing increase, decrease, and uncertainty trends. It is a clear, simple vector for business or data visuals, informative and clean. Generative AI. Decrease bar vectors Set of six vector bar chart icons with arrows indicating trends and question mark in black and colored design elements. This image features six black bar chart icons with red and green arrows showing increase, decrease, and uncertainty trends. It is a clear, simple vector for business or data visuals, informative and clean. Generative AI
Free with trial This vector illustration depicts a descending bar graph, representing decline and negative trends. It is suitable for financial reports, business analysis, and presentations. Decrease bar vectors Illustration of a descending bar graph, , representing decline, decrease, and negative trends in business or finance. This vector illustration depicts a descending bar graph, representing decline and negative trends. It is suitable for financial reports, business analysis, and presentations
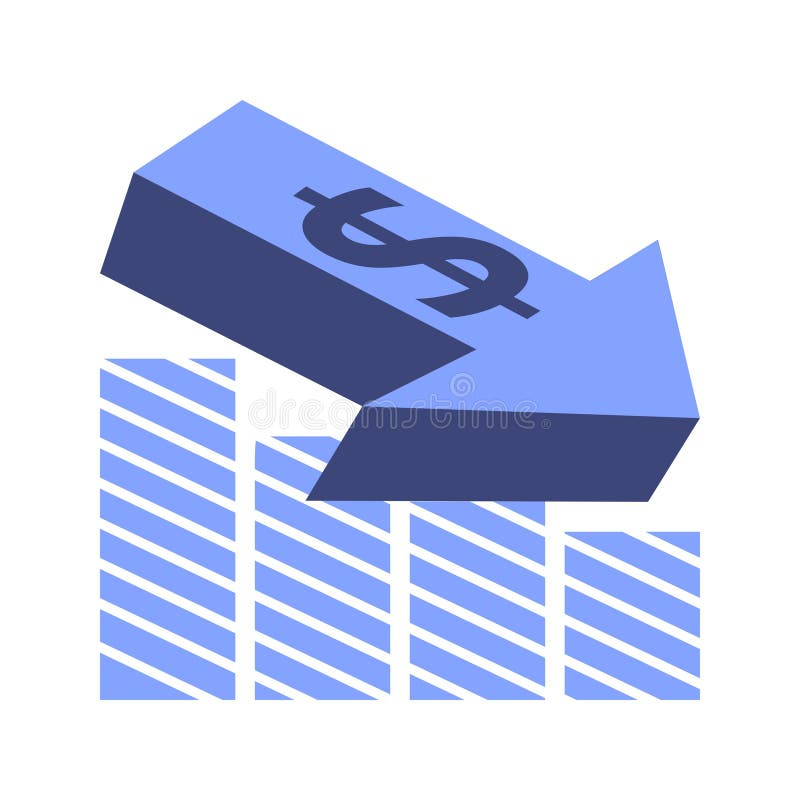
Free with trial This image shows a bar graph with a downward trending line and a dollar sign. It represents financial loss, economic downturn, or a decrease in market value. Decrease bar vectors Vector art of a bar graph with a downward trending line and a dollar sign, representing financial loss or economic downturn. This image shows a bar graph with a downward trending line and a dollar sign. It represents financial loss, economic downturn, or a decrease in market value
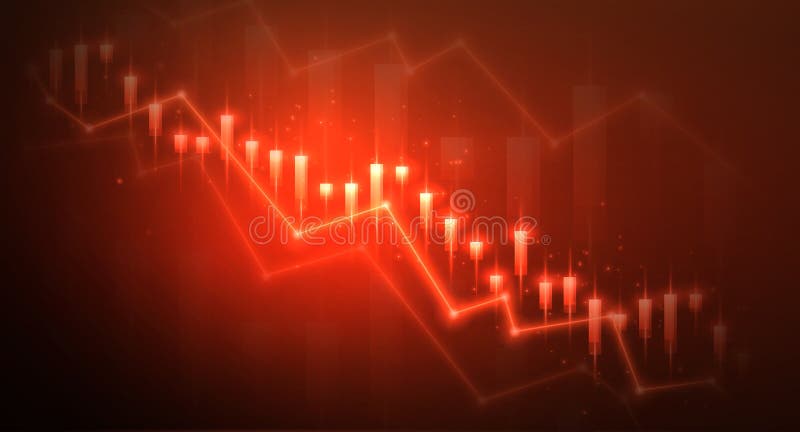
Free with trial Red glowing line graph shows market decline. Bar chart bars decrease, indicating falling sales, revenue loss. Financial report chart displays economic crisis, business downturn tech. Decrease bar illustrations Red glowing line graph shows market decline. Bar chart bars decrease, indicating falling sales, revenue loss. Financial report
Free with trial A person in a suit presents a bar chart indicating quality increase and cost decrease, illuminated by golden light. Decrease bar illustrations Person in Suit Presenting Bar Chart with Quality Up and Cost Down, Illuminated by Golden Light Modern technology business. A person in a suit presents a bar chart indicating quality increase and cost decrease, illuminated by golden light
Free with trial A businessman in a suit holds a bar chart showing quality increasing and cost decreasing, with golden sparkles. Decrease bar illustrations Businessman Holding Upward Trending Bar Chart Showing Quality Increase and Cost Decrease with Golden Sparkles Modern technology. A businessman in a suit holds a bar chart showing quality increasing and cost decreasing, with golden sparkles
Free with trial Stock and economic crisis graph background. Trade exchange, financial decrease, bed business strategy, digital asset, loss investment fund, online broker, stock collapse and crisis concept. Decrease bar vectors Stock and economic crisis graph background. Trade exchange, financial decrease
Free with trial Panic businessman watching red bar chart falling like domino effect, symbolizing financial crisis, economic downturn, business failure, risk, and market collapse concept illustration. Decrease bar vectors Panic businessman watching falling red bar chart. Panic businessman watching red bar chart falling like domino effect, symbolizing financial crisis, economic downturn, business failure, risk, and market collapse concept illustration
Free with trial Gold bar on white background. Isolated 3D illustration. Decrease bar illustrations Gold bar on white background. Isolated 3D illustration
Free with trial Stock and economic crisis graph background. Trade exchange, financial decrease, bed business strategy, digital asset, loss investment fund, online broker, stock collapse and crisis concept. Decrease bar illustrations Stock and economic crisis graph background. Trade exchange, financial decrease
Free with trial Heart health bar with low gauge in retro 8 bit style, crisp pixels and bold outline. Symbol of life, stamina, energy and survival for gaming hud and ui. Cartoon vector illustration. Decrease bar vectors Heart Health Bar Pixel Art. Heart health bar with low gauge in retro 8 bit style, crisp pixels and bold outline. Symbol of life, stamina, energy and survival for gaming hud and ui. Cartoon vector illustration.
Free with trial Decrease financial business on white background. Isolated 3D illustration. Decrease bar illustrations Decrease financial business on white background. Isolated 3D illustration
Free with trial Stock and economic crisis graph background. Trade exchange, financial decrease, bed business strategy, digital asset, loss investment fund, online broker, stock collapse and crisis concept. Decrease bar illustrations Stock and economic crisis graph background. Trade exchange, financial decrease
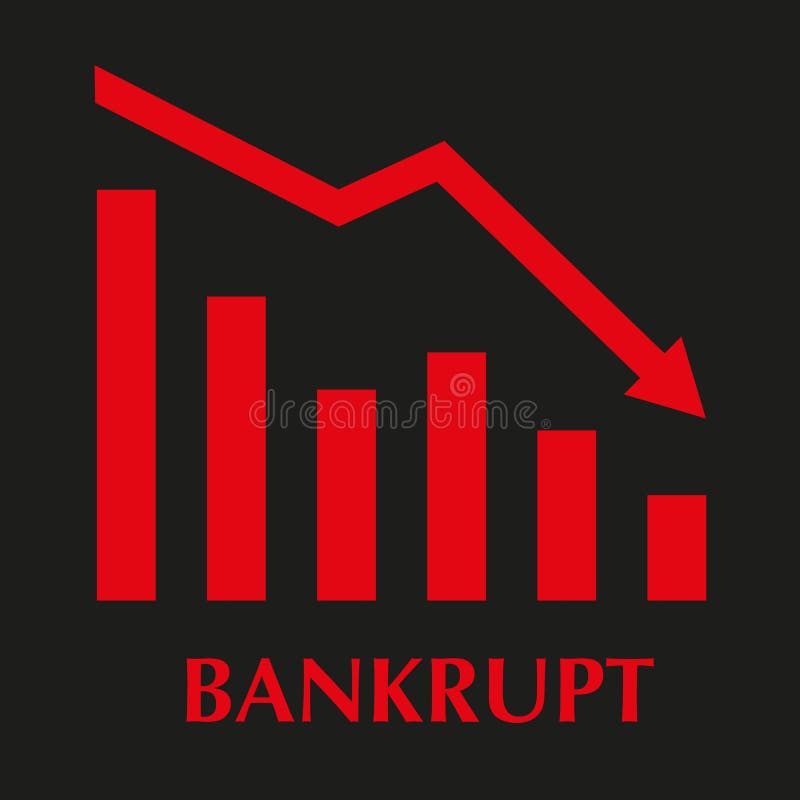
Free with trial Graph and decrease report. Business and finance vector illustrations. Diagram with recession and bankruptcy progress. Decrease bar vectors Graph and decrease report. Business and finance vector illustrations. Diagram with recession and bankruptcy
Free with trial Broker trader analyzing economic crisis. Trade exchange, financial decrease, bed business strategy, digital asset, loss investment fund, online broker, stock collapse and crisis concept. Decrease bar vectors Broker trader analyzing economic crisis. Trade exchange, financial decrease
Free with trial Health bar with rounded capsule frame showing low hp in retro pixel blocks on transparent background. Concept of danger, failure, risk, game over, and urgency. Cartoon vector illustration. Decrease bar vectors Health Bar Low Pixel Art. Health bar with rounded capsule frame showing low hp in retro pixel blocks on transparent background. Concept of danger, failure, risk, game over, and urgency. Cartoon vector illustration.
Free with trial A minimalist solid black icon of a bar chart with a downward arrow, representing financial loss, decline, decrease, or negative trend. Perfect for business, finance, analytics, and reporting projects. Clean and versatile for web, print, and digital use. Decrease bar vectors . A minimalist solid black icon of a bar chart with a downward arrow, representing financial loss, decline, decrease, or negative trend. Perfect for business, finance, analytics, and reporting projects. Clean and versatile for web, print, and digital use
Free with trial Diagram with recession and bankruptcy progress. Business and finance vector illustration. Graph with decrease report. Decrease bar vectors Diagram with recession and bankruptcy progress. Business and finance vector illustration. Graph with decrease
Free with trial Downward Bar Graph Line Icon, Decline or Loss Vector. Decrease bar vectors Downward Bar Graph Line Icon
Free with trial Conceptual graph with decrease report. Dark diagram with recession and bankruptcy progress. Business and finance vector illustration. Decrease bar vectors Conceptual graph with decrease report. Dark diagram with recession and bankruptcy progress. Business and finance vector
Free with trial Business and finance illustration showing a decrease in profit. The image features a blue dollar coin stack and a purple bar chart with a sharp red arrow pointing down, symbolizing stock market crash, inflation, or investment failure. Decrease bar vectors Financial crisis concept with coin stack and falling bar chart on dark background. Business and finance illustration showing a decrease in profit. The image features a blue dollar coin stack and a purple bar chart with a sharp red arrow pointing down, symbolizing stock market crash, inflation, or investment failure.
Free with trial Illustration of a financial decline represented by a bar graph with a downward red arrow. Decrease bar vectors Financial decline concept with downward arrow on bar graph. Illustration of a financial decline represented by a bar graph with a downward red arrow.
Free with trial A simple black icon featuring a house symbol over a bar graph showing a downward trend, indicating a decrease in. Decrease bar illustrations Downward trend graph with house icon. A simple black icon featuring a house symbol over a bar graph showing a downward trend, indicating a decrease in.
Free with trial 3D bar chart with descending green bars and blue downward arrow on white background. Ideal for finance, business decline, loss and market analysis. Decrease bar illustrations 3D Declining Bar Chart with Blue Arrow Down Icon on Transparent Background for Finance Analysis. 3D bar chart with descending green bars and blue downward arrow. 3D bar chart with descending green bars and blue downward arrow on white background. Ideal for finance, business decline, loss and market analysis
Free with trial Comparing Bar Chart Data Analysis Icons vol 30444. Decrease bar vectors Comparing Bar Chart Data Analysis Icons
Free with trial A clean, flat design set of icons showing upward and downward arrows and a bar graph, perfect for illustrating financial trends, data, or concepts. Decrease bar vectors Green up arrow, red down arrow, and bar chart. A clean, flat design set of icons showing upward and downward arrows and a bar graph, perfect for illustrating financial trends, data, or concepts
Free with trial Bar graph with varying heights beside a line chart with rising and falling pattern on a grid. Ideal for business analysis, statistics, metrics, trends, presentation, infographics, simple flat. Decrease bar illustrations Data Visualization with Bar Graph and Line Chart in Minimalist Design. Bar graph with varying heights beside a line chart with rising and falling pattern on a grid. Ideal for business analysis, statistics, metrics, trends, presentation, infographics, simple flat
Free with trial A gold bar graph with an arrow pointing down at the end. Decrease bar illustrations A gold bar graph with an arrow
Free with trial Icon set depicting financial growth and decline with upward and downward arrows over bar charts, perfect for business analytics and presentations. Decrease bar vectors Bar charts with curved arrows showing trends. Icon set depicting financial growth and decline with upward and downward arrows over bar charts, perfect for business analytics and presentations
Free with trial Bar chart icon showing three declining bars within a circular interface, symbolizing decreasing data, analytical trends, and financial performance concepts. Decrease bar vectors Decreasing bar chart data analysis statistics icon. Bar chart icon showing three declining bars within a circular interface, symbolizing decreasing data, analytical trends, and financial performance concepts
Free with trial Decreasing Bar Chart Icons for Business Analytics vol 34819. Decrease bar vectors Decreasing Bar Chart Icons for Business Analytics
Free with trial Bar graph showing decreasing values alongside arrows moving toward a minimal cloud. Ideal for data analysis, statistics, regression, performance tracking, economy, analytics, simple flat metaphor. Decrease bar vectors Declining Bar Chart with Arrows and Cloud Representing Regression or Data Flow. Bar graph showing decreasing values alongside arrows moving toward a minimal cloud. Ideal for data analysis, statistics, regression, performance tracking, economy, analytics, simple flat metaphor
Free with trial A flat design bar chart displays a downward trend, highlighted by a red arrow. Minimalist graphic, illustrative style. Decrease bar vectors Flat bar chart showing downward trend with red arrow. A flat design bar chart displays a downward trend, highlighted by a red arrow. Minimalist graphic, illustrative style.
Free with trial A flat design vector illustration showing a graph with rising and falling bars, marked by green and red arrows indicating increase and decrease. Ideal for financial concepts. Decrease bar vectors Bar chart showing positive and negative data trends. A flat design vector illustration showing a graph with rising and falling bars, marked by green and red arrows indicating increase and decrease. Ideal for financial concepts
Free with trial A stylized illustration of a descending bar graph within a website window, rendered in a flat, minimalist design. Decrease bar vectors Decreasing bar graph inside a website window interface. A stylized illustration of a descending bar graph within a website window, rendered in a flat, minimalist design.
Free with trial 3D graph going up and down with red arrows, blue bar chart icon vector, sales chart with 3D arrow down and arrow up, financial analytics symbol, EPS 10. Decrease bar vectors 3D graph going up and down with red arrows, blue bar chart icon vector, sales chart symbol. 3D graph going up and down with red arrows, blue bar chart icon vector, sales chart with 3D arrow down and arrow up, financial analytics symbol, EPS 10
Free with trial Two black bar chart graphs with a rising arrow and a falling arrow on a white background, indicating growth and decline in data or business performance. Scalable format print and digital media. Decrease bar vectors Black bar chart graphs with rising and falling arrows rising arrow. Two black bar chart graphs with a rising arrow and a falling arrow on a white background, indicating growth and decline in data or business performance. Scalable format print and digital media
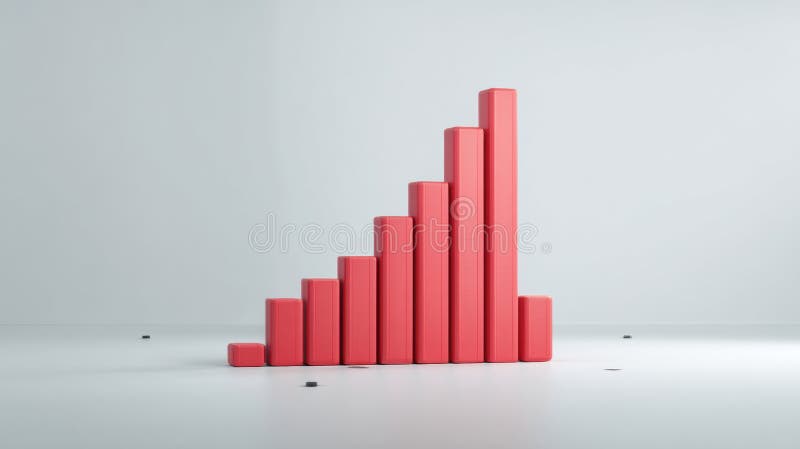
Free with trial The image depicts a bar graph with a downward trend. The bars start at a higher value and progressively decrease, indicating a decline. An arrow at the end of the graph further emphasizes the downward direction. Decrease bar illustrations Decreasing bar graph. The image depicts a bar graph with a downward trend. The bars start at a higher value and progressively decrease, indicating a decline. An arrow at the end of the graph further emphasizes the downward direction
Free with trial Dollar sign falling down with a descending bar chart, representing financial decline, currency depreciation, or economic downturn. Decrease bar vectors Falling Dollar Symbol on Decreasing Bar Graph. Dollar sign falling down with a descending bar chart, representing financial decline, currency depreciation, or economic downturn
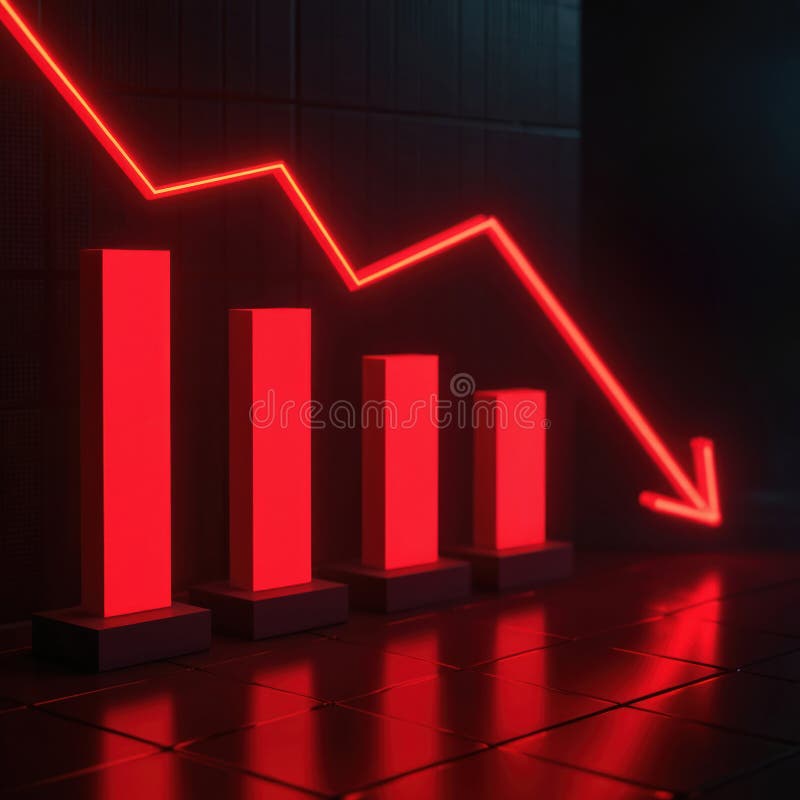
Free with trial A bar chart showing a steady decline with a red downward arrow, symbolizing financial loss, economic downturn, business decline, or negative performance trends. Decrease bar illustrations Economic Downtrend Bar Chart for Business concept 3d Rendering. A bar chart showing a steady decline with a red downward arrow, symbolizing financial loss, economic downturn, business decline, or negative performance trends
Free with trial A bar chart showing a steady decline with a red downward arrow, symbolizing financial loss, economic downturn, business decline, or negative performance trends. Decrease bar illustrations Economic Downtrend Bar Chart for Business concept 3d Rendering. A bar chart showing a steady decline with a red downward arrow, symbolizing financial loss, economic downturn, business decline, or negative performance trends
Free with trial A bar chart showing a steady decline with a red downward arrow, symbolizing financial loss, economic downturn, business decline, or negative performance trends. Decrease bar illustrations Economic Downtrend Bar Chart for Business concept 3d Rendering. A bar chart showing a steady decline with a red downward arrow, symbolizing financial loss, economic downturn, business decline, or negative performance trends
Free with trial A bar chart showing a steady decline with a red downward arrow, symbolizing financial loss, economic downturn, business decline, or negative performance trends. Decrease bar illustrations Economic Downtrend Bar Chart for Business concept 3d Rendering. A bar chart showing a steady decline with a red downward arrow, symbolizing financial loss, economic downturn, business decline, or negative performance trends
Free with trial Medicine bottle surrounded by upward and downward arrows with bar chart illustrating statistics and growth. Ideal for health, medicine, pharmaceutical industry, research, statistics, marketing, data. Decrease bar vectors Medicine Bottle with Rising Arrow and Bar Chart Representing Growth and Decline Trends. Medicine bottle surrounded by upward and downward arrows with bar chart illustrating statistics and growth. Ideal for health, medicine, pharmaceutical industry, research, statistics, marketing, data
Free with trial Up and down graph chart icon. Growth increase and decrease sign. Graph or diagram with arrow going up and down. Vector illustration. Decrease bar illustrations Up and down graph chart icon. Growth increase and decrease sign. Graph or diagram with arrow going up and down. Vector
Free with trial Flat style image displaying a decreasing blue bar chart with a percentage icon, isolated on black. Decrease bar vectors Blue bar chart showing decrease with percentage symbol icon. Flat style image displaying a decreasing blue bar chart with a percentage icon, isolated on black.
Free with trial Up and down graph chart icon. Growth increase and decrease sign. Graph or diagram with arrow going up and down. Vector illustration. Decrease bar vectors Up and down graph chart icon. Growth increase and decrease sign. Graph or diagram with arrow going up and down. Vector
Free with trial Flat vector illustration of a colorful bar graph showing a decreasing trend with an arrow on a black backdrop. Decrease bar vectors Decreasing bar graph with downward arrow on black background. Flat vector illustration of a colorful bar graph showing a decreasing trend with an arrow on a black backdrop.
Free with trial A clean, minimalist illustration of a blue bar chart on a black backdrop, simple and effective visual for data presentation. Decrease bar vectors Minimalist blue bar chart illustration on a black background. A clean, minimalist illustration of a blue bar chart on a black backdrop, simple and effective visual for data presentation.
Free with trial Business performance, emotional reactions, statistics, analytics decline, financial troubles, problem-solving. Bar graph with downward trend and neutral face. Business challenges and emotional. Decrease bar illustrations Declining Bar Graph with Neutral Face Emotional Impact and Business Challenges. Business performance, emotional reactions, statistics, analytics decline, financial troubles, problem-solving. Bar graph with downward trend and neutral face. Business challenges and emotional
Free with trial A simple flat style bar graph shows a negative trend, with a downward arrow on a black background. Decrease bar vectors Decreasing bar graph with downward arrow over black background. A simple flat style bar graph shows a negative trend, with a downward arrow on a black background.
Free with trial The image depicts a bar graph with a downward trend. The bars, colored in various shades of blue, green, yellow, orange, and red, show a clear decrease in height from left to right. A large red arrow at the top of the graph further emphasizes the downward direction, indicating a significant decline in the data being represented. Decrease bar illustrations Decreasing trend in data. The image depicts a bar graph with a downward trend. The bars, colored in various shades of blue, green, yellow, orange, and red, show a clear decrease in height from left to right. A large red arrow at the top of the graph further emphasizes the downward direction, indicating a significant decline in the data being represented
Free with trial Cost reduction text with downward arrow and bar chart on neutral background. Business finance concept for expense control, budget management, savings strategy, and profit optimization. Decrease bar illustrations Cost Reduction Concept with Downward Arrow and Bar Chart 3d render. Cost reduction text with downward arrow and bar chart on neutral background. Business finance concept for expense control, budget management, savings strategy, and profit optimization
Free with trial Cost reduction text with downward arrow and bar chart on neutral background. Business finance concept for expense control, budget management, savings strategy, and profit optimization. Decrease bar illustrations Cost Reduction Concept with Downward Arrow and Bar Chart 3d render. Cost reduction text with downward arrow and bar chart on neutral background. Business finance concept for expense control, budget management, savings strategy, and profit optimization
Free with trial Cost reduction text with downward arrow and bar chart on neutral background. Business finance concept for expense control, budget management, savings strategy, and profit optimization. Decrease bar illustrations Cost Reduction Concept with Downward Arrow and Bar Chart 3d render. Cost reduction text with downward arrow and bar chart on neutral background. Business finance concept for expense control, budget management, savings strategy, and profit optimization
Free with trial Cost reduction text with downward arrow and bar chart on neutral background. Business finance concept for expense control, budget management, savings strategy, and profit optimization. Decrease bar illustrations Cost Reduction Concept with Downward Arrow and Bar Chart 3d render. Cost reduction text with downward arrow and bar chart on neutral background. Business finance concept for expense control, budget management, savings strategy, and profit optimization