Free with trial A simple black and red bar chart displays data with varying heights on a white background. Decrease bar illustrations Simple Bar Chart with One Red Bar on White Background graph data. A simple black and red bar chart displays data with varying heights on a white background
Free with trial A blue bar chart shows a downward trend indicated by a sharp red arrow. Isolated on a transparent background. Decrease bar vectors Blue bar chart with red downward trending arrow isolated on a transparent background. A blue bar chart shows a downward trend indicated by a sharp red arrow. Isolated on a transparent background
Free with trial A black icon showing two bars of different heights with a downward arrow pointing to the smaller bar. Decrease bar illustrations Black icon of two bars with a downward arrow pointing to the smaller bar chart. A black icon showing two bars of different heights with a downward arrow pointing to the smaller bar
Free with trial A 3D golden bar chart is arranged in a descending sequence, illustrating a downward trend. The bars are polished and reflective, casting subtle shadows on the pure white background. This visual represents a decline in data or financial performance. Decrease bar illustrations Golden Bar Chart Showing Downward Trend on White Background graph metallic. A 3D golden bar chart is arranged in a descending sequence, illustrating a downward trend. The bars are polished and reflective, casting subtle shadows on the pure white background. This visual represents a decline in data or financial performance
Free with trial This image depicts a combination of line and bar graphs showing comparative data analysis over a period of time. Decrease bar illustrations Comparative data analysis over time with line and bar graphs. This image depicts a combination of line and bar graphs showing comparative data analysis over a period of time
Free with trial This image features a 3D bar graph with a downward trend isolated on a white background. The graph consists of green bars that decrease in height from left to right, with a red arrow pointing downward to emphasize the declining trend. The image is clean and visually appealing, suitable for business and financial contexts. Decrease bar illustrations 3d bar graph with downward trend isolated on white background. This image features a 3D bar graph with a downward trend isolated on a white background. The graph consists of green bars that decrease in height from left to right, with a red arrow pointing downward to emphasize the declining trend. The image is clean and visually appealing, suitable for business and financial contexts
Free with trial A dollar bill connected to a bar graph resembling a sound wave with an arrow. Clear details and vibrant colors. Decrease bar illustrations Dollar Bill and Sound Wave Bar Graph with Arrow money finance. A dollar bill connected to a bar graph resembling a sound wave with an arrow. Clear details and vibrant colors
Free with trial Two blue bar graphs are depicted against a white background. The left graph bars increasing in height with an upward curving arrow, indicating growth. The right graph bars decreasing in height. Decrease bar vectors Blue bar graphs showing upward and downward trends with arrows. Two blue bar graphs are depicted against a white background. The left graph bars increasing in height with an upward curving arrow, indicating growth. The right graph bars decreasing in height
Free with trial Frozen icicle bar chart showing a downward trend and frosty arrow. Concept of economic recession or financial crisis. Decrease bar illustrations Frozen icicle bar chart showing a downward trend and frosty arrow
Free with trial A circular icon containing a stylized representation of financial data. The icon features a series of black vertical bars of varying heights, suggesting a bar chart. Overlaid on the bars are two thin lines, one black and one grey, depicting line graphs with peaks and troughs, indicating fluctuating trends. The overall design is minimalist and symbolic, suitable for representing business analytics. Decrease bar illustrations Circular Graph Icon with Bar and Line Charts Representing Financial Data and Trends business. A circular icon containing a stylized representation of financial data. The icon features a series of black vertical bars of varying heights, suggesting a bar chart. Overlaid on the bars are two thin lines, one black and one grey, depicting line graphs with peaks and troughs, indicating fluctuating trends. The overall design is minimalist and symbolic, suitable for representing business analytics
Free with trial A simple line art icon of a decreasing bar chart with a trend arrow, representing negative growth or loss in business. Decrease bar vectors Line Art Outline Decreasing Bar Chart Trend Arrow Business Icon. A simple line art icon of a decreasing bar chart with a trend arrow, representing negative growth or loss in business.
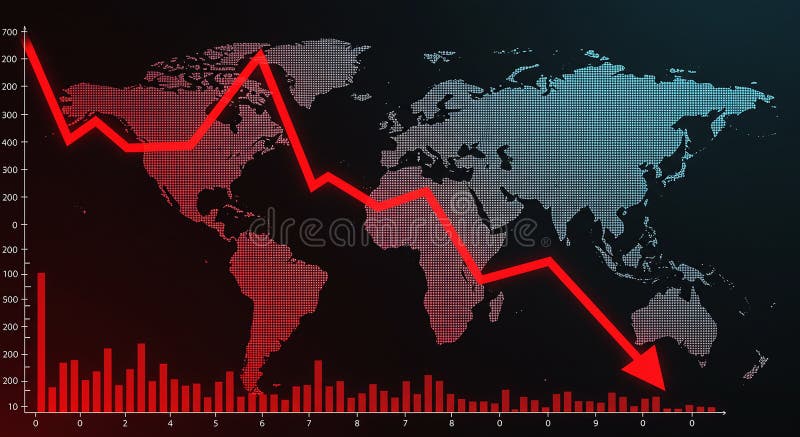
Free with trial World map with a red declining line graph overlay, illustrating a decrease or economic downturn. The graph features sharp declines across various data points, reflecting a downward trend. Red bar chart at the bottom represents additional numerical data against a black background. The map uses a dotted pattern for continents, highlighting regions globally. The image conveys financial analysis, market trends, or economic statistics. Decrease bar illustrations World map with a red declining line graph overlay
Free with trial Bar chart icon representing data visualization, financial growth, business analytics, and market trends, indicating increasing and decreasing values for decision making. Decrease bar vectors Bar chart icon showing data analysis and statistics. Bar chart icon representing data visualization, financial growth, business analytics, and market trends, indicating increasing and decreasing values for decision making
Free with trial Set Money bag, Financial growth decrease, Slot machine and with jackpot icon. Black square button. Vector. Decrease bar vectors Set Money bag, Financial growth decrease, Slot machine and with jackpot icon. Black square button. Vector
Free with trial A 3D cartoon illustration depicts a hand in a suit pointing a finger downwards towards a bar chart. The chart shows bars of varying heights in green, yellow, orange, and red, with the red bar being the shortest. A red arrow points downwards, indicating a decline. The chart sits on a red and black base, all against a white background. Decrease bar illustrations Cartoon Hand Pointing Downward Arrow on Declining Bar Chart with Red Base business finance. A 3D cartoon illustration depicts a hand in a suit pointing a finger downwards towards a bar chart. The chart shows bars of varying heights in green, yellow, orange, and red, with the red bar being the shortest. A red arrow points downwards, indicating a decline. The chart sits on a red and black base, all against a white background
Free with trial Silver price going down decrease cheaper in metal commodity market international trading market vector. Decrease bar vectors Silver price going down decrease cheaper in metal commodity market international trading market
Free with trial A 3D rendered icon depicting a blue document with a raised bar graph. The bar graph features alternating blue, orange, and yellow bars of varying heights. White lines and a circular orange and white element are also present on the blue document surface. The icon is isolated on a white background. Decrease bar vectors 3 D blue document icon with orange and blue bar graph and white lines image. A 3D rendered icon depicting a blue document with a raised bar graph. The bar graph features alternating blue, orange, and yellow bars of varying heights. White lines and a circular orange and white element are also present on the blue document surface. The icon is isolated on a white background
Free with trial A 3D rendered red bar chart and line graph show a downward trend against a white grid background. The graph reflects a decline with a red arrow pointing down. Decrease bar illustrations Red downward trending bar chart and line graph on white grid image. A 3D rendered red bar chart and line graph show a downward trend against a white grid background. The graph reflects a decline with a red arrow pointing down
Free with trial A 3D render illustrating a concept of financial decline and economic recession. The image features a red bar chart with progressively shorter bars, indicating a downward trend. A bold, red arrow follows this negative trajectory, pointing sharply downwards. Set against a clean, neutral gray background, this graphic powerfully symbolizes concepts like business failure, stock market crash, investment loss, sales decrease, and economic crisis. It's a perfect visual for presentations, reports, and articles discussing financial downturns, poor performance, and negative growth. Decrease bar illustrations Financial Decline Graph with Red Arrow Down. A 3D render illustrating a concept of financial decline and economic recession. The image features a red bar chart with progressively shorter bars, indicating a downward trend. A bold, red arrow follows this negative trajectory, pointing sharply downwards. Set against a clean, neutral gray background, this graphic powerfully symbolizes concepts like business failure, stock market crash, investment loss, sales decrease, and economic crisis. It's a perfect visual for presentations, reports, and articles discussing financial downturns, poor performance, and negative growth.
Free with trial Blue bar chart with a black arrow bouncing backward vector illustration. Economic recession, financial loss, market crash, business failure, negative growth, setback. Data graph with falling pointer. Decrease bar vectors Financial bar chart with a bouncing arrow pointing down economic recession and market loss vector illustration. Blue bar chart with a black arrow bouncing. Blue bar chart with a black arrow bouncing backward vector illustration. Economic recession, financial loss, market crash, business failure, negative growth, setback. Data graph with falling pointer
Free with trial Black and white icon of a bar graph with a diagonal arrow indicating a sharp decline. Decrease bar illustrations Falling bar graph with diagonal arrow showing sharp decline bar chart. Black and white icon of a bar graph with a diagonal arrow indicating a sharp decline
Free with trial A black icon representing a bar chart with bars decreasing in height Clear details and vibrant colors enhance. Decrease bar illustrations Black descending bar chart icon on white background graph decline. A black icon representing a bar chart with bars decreasing in height Clear details and vibrant colors enhance
Free with trial A bar chart displays four vertical bars in red, yellow, green, and blue, arranged in descending height from left to right. A thick, black arrow curves downwards from the top right, pointing towards the bars and indicating a downward trend or decline. The chart is presented on a plain white background. Decrease bar illustrations Downward Trending Bar Chart with Red Yellow Green Blue Bars and Black Arrow graph statistics. A bar chart displays four vertical bars in red, yellow, green, and blue, arranged in descending height from left to right. A thick, black arrow curves downwards from the top right, pointing towards the bars and indicating a downward trend or decline. The chart is presented on a plain white background
Free with trial This image depicts a bar graph on an easel showing a clear downward trend. The bars are blue, and a large red arrow points downward, indicating a decline. Decrease bar illustrations Decline in data represented by a descending bar graph on an easel. This image depicts a bar graph on an easel showing a clear downward trend. The bars are blue, and a large red arrow points downward, indicating a decline
Free with trial Business Chart and Graph Set with Line, Bar, and Pie Icons for Data Analysis or Statistics in Reports and Research. Vector. Editable stroke. Decrease bar vectors Business Chart and Graph Set with Line, Bar, and Pie Icons for Data Analysis or Statistics in Reports and Research
Free with trial This image features an abstract illustration of a bar graph against a dark gray background. The graph consists of three vertical bars of varying heights, each with horizontal rectangles inside. The bars are shades of white and gray, creating a minimalist and modern design. This image can be used to represent data, growth, statistics, or business performance in a visually appealing manner. Decrease bar vectors Abstract Bar Graph Illustration. This image features an abstract illustration of a bar graph against a dark gray background. The graph consists of three vertical bars of varying heights, each with horizontal rectangles inside. The bars are shades of white and gray, creating a minimalist and modern design. This image can be used to represent data, growth, statistics, or business performance in a visually appealing manner.
Free with trial Bar chart representation of data increase growth and finance. Data analysis. Decrease bar vectors Bar chart representation of data increase growth and finance. Data analysis
Free with trial Two distinct bar charts are depicted against a white background. The left chart a downward trend with bars in blue, yellow, and purple, accompanied by a yellow coin with a dollar sign and an arrow pointing down towards it from a small graph indicating a rising trend. The right chart an upward trend with bars in red, green, and blue, and a green coin with a dollar sign connected to a circle with a. Decrease bar illustrations Bar charts showing financial growth and decline with dollar symbols. Two distinct bar charts are depicted against a white background. The left chart a downward trend with bars in blue, yellow, and purple, accompanied by a yellow coin with a dollar sign and an arrow pointing down towards it from a small graph indicating a rising trend. The right chart an upward trend with bars in red, green, and blue, and a green coin with a dollar sign connected to a circle with a
Free with trial Four simple bar chart are displayed against a white background. Two are solid black, one showing an upward trend with an arrow, and the other a downward trend with an arrow. The remaining two. Decrease bar vectors Four bar chart showing upward and downward trends graph. Four simple bar chart are displayed against a white background. Two are solid black, one showing an upward trend with an arrow, and the other a downward trend with an arrow. The remaining two
Free with trial Pink Financial growth decrease icon isolated on pink background. Increasing revenue. Minimalism concept. 3D render illustration. Decrease bar illustrations Pink Financial growth decrease icon isolated on pink background. Increasing revenue. Minimalism concept. 3D render
Free with trial Set Digital speed meter, Financial growth decrease, Browser window and Online shopping on screen icon. Vector. Decrease bar illustrations Set Digital speed meter, Financial growth decrease, Browser window and Online shopping on screen icon. Vector
Free with trial The image displays a simplified illustration of a candlestick chart pattern, commonly used in financial markets for analyzing price movements. it features a series of vertical bars, some green and some red, representing price fluctuations over a specific period. the green bars indicate an increase in price, while the red bars indicate a decrease. each bar has a body and wicks extending above and below, showing the high, low, open, and close prices. the background is plain white. Decrease bar illustrations Candlestick chart pattern simple illustration. the image displays a simplified illustration of a candlestick chart pattern, commonly used in financial markets for analyzing price movements. it features a series of vertical bars, some green and some red, representing price fluctuations over a specific period. the green bars indicate an increase in price, while the red bars indicate a decrease. each bar has a body and wicks extending above and below, showing the high, low, open, and close prices. the background is plain white.
Free with trial Two bar graphs, one green showing growth and one red showing decline, with trend lines indicating opposite directions. Decrease bar illustrations Bar graphs showing upward and downward trends. Two bar graphs, one green showing growth and one red showing decline, with trend lines indicating opposite directions
Free with trial A magnifying glass focuses on a declining bar graph and a file folder, symbolizing a decrease in sales and the need for. Decrease bar illustrations Declining Sales Analysis Magnifying Glass, Downward Graph. A magnifying glass focuses on a declining bar graph and a file folder, symbolizing a decrease in sales and the need for.
Free with trial Gold price going down decrease cheaper in golden metal commodity market international trading market vector. Decrease bar illustrations Gold price going down decrease cheaper in golden metal commodity market international trading market
Free with trial Two sets of simple flat design charts showing bar graphs with line graphs and three-segment pie charts in red, green, and blue. Decrease bar vectors Two bar charts with line graphs and two pie charts data visualization statistics. Two sets of simple flat design charts showing bar graphs with line graphs and three-segment pie charts in red, green, and blue
Free with trial Line art icon featuring a magnifying glass positioned over a vertical bar chart. The design is simple and minimalistic, using grey lines. The bar chart consists of three bars of varying heights, and the magnifying glass is centered over the middle bar, suggesting examination or analysis of data. This icon is likely used to symbolize data analysis, inspection, or detailed observation in a graphical representation. Decrease bar vectors Line art icon of magnifying glass over bar chart. Line art icon featuring a magnifying glass positioned over a vertical bar chart. The design is simple and minimalistic, using grey lines. The bar chart consists of three bars of varying heights, and the magnifying glass is centered over the middle bar, suggesting examination or analysis of data. This icon is likely used to symbolize data analysis, inspection, or detailed observation in a graphical representation.
Free with trial A bar graph showing a downward trend with a red arrow indicating a decline. Decrease bar illustrations Decreasing bar graph with downward arrow isolated on white background. A bar graph showing a downward trend with a red arrow indicating a decline
Free with trial A striking 3D render illustrating a significant financial or business decline. The image features a minimalist bar chart with three decreasing blue-grey bars, symbolizing a negative trend or falling performance. A prominent, jagged red arrow sharply points downwards across the chart, emphatically conveying concepts of loss, recession, crisis, or market downturn. Set against a vibrant yellow background, this clean and modern graphic is ideal for presentations, reports, articles, or educational materials discussing economic challenges, poor statistics, or business risks. Decrease bar illustrations Financial Decline Bar Chart with Red Down Arrow. A striking 3D render illustrating a significant financial or business decline. The image features a minimalist bar chart with three decreasing blue-grey bars, symbolizing a negative trend or falling performance. A prominent, jagged red arrow sharply points downwards across the chart, emphatically conveying concepts of loss, recession, crisis, or market downturn. Set against a vibrant yellow background, this clean and modern graphic is ideal for presentations, reports, articles, or educational materials discussing economic challenges, poor statistics, or business risks.
Free with trial A striking 3D rendered image featuring a bar chart with decreasing red bars and a prominent red downward-pointing arrow, set against a vibrant yellow background. This minimalist visual powerfully symbolizes financial decline, economic recession, business loss, or a negative trend in performance. The clean design effectively conveys concepts of decreasing profits, market downturns, or poor investment outcomes. Ideal for presentations, financial reports, economic analysis, infographics, and articles discussing challenges, risks, or market volatility in business and finance. Decrease bar illustrations Economic Downturn Bar Chart with Downward Arrow. A striking 3D rendered image featuring a bar chart with decreasing red bars and a prominent red downward-pointing arrow, set against a vibrant yellow background. This minimalist visual powerfully symbolizes financial decline, economic recession, business loss, or a negative trend in performance. The clean design effectively conveys concepts of decreasing profits, market downturns, or poor investment outcomes. Ideal for presentations, financial reports, economic analysis, infographics, and articles discussing challenges, risks, or market volatility in business and finance.
Free with trial An isometric 3D bar chart with four descending bars, made of a clear glass with a modern, holographic, and iridescent finish in pink and blue. Concept of financial decline or decreasing data trends. Decrease bar vectors Isometric Bar Chart Showing Decline with Iridescent Bars. An isometric 3D bar chart with four descending bars, made of a clear glass with a modern, holographic, and iridescent finish in pink and blue. Concept of financial decline or decreasing data trends
Free with trial A 3D rendered bar chart with bars in red, yellow, green, and blue, arranged in descending order of height. A thick black arrow curves downwards from the top left, crossing over the bars and pointing towards the bottom right, indicating a downward trend or decline. The image is set against a clean, white background. Decrease bar illustrations Colorful Bar Chart Showing Downward Trend with Black Arrow on White Background graph. A 3D rendered bar chart with bars in red, yellow, green, and blue, arranged in descending order of height. A thick black arrow curves downwards from the top left, crossing over the bars and pointing towards the bottom right, indicating a downward trend or decline. The image is set against a clean, white background
Free with trial Black bar graph with downward arrows indicating a decline or loss on a white background. Decrease bar illustrations Falling bar graph with downward arrows indicating decline or loss chart. Black bar graph with downward arrows indicating a decline or loss on a white background
Free with trial Graph with decrease report. Business and finance vector illustration. Diagram with recession and bankruptcy progress. Decrease bar vectors Graph with decrease report. Business and finance vector illustration. Diagram with recession and bankruptcy
Free with trial A black bar labeled PRICE tapers to a point above a long black bar labeled BASE. Clear details and vibrant col. Decrease bar illustrations Black price bar tapering to a point above a long base bar on white graph chart. A black bar labeled PRICE tapers to a point above a long black bar labeled BASE. Clear details and vibrant col
Free with trial A black and white line illustration depicts a bar chart with bars of decreasing height from left to right. A thick, angular arrow points downwards across the chart, indicating a negative trend. To the upper right of the arrow, a circle contains a dollar sign, representing currency. The overall composition suggests a financial downturn or loss. Decrease bar vectors Bar chart with downward trend arrow and dollar coin. A black and white line illustration depicts a bar chart with bars of decreasing height from left to right. A thick, angular arrow points downwards across the chart, indicating a negative trend. To the upper right of the arrow, a circle contains a dollar sign, representing currency. The overall composition suggests a financial downturn or loss
Free with trial Basic charts line icon set. Bar diagram, pie and histogram graph. Data visualization, growth and distribution analysis for business and finance. Vector illustration Editable Stroke. Decrease bar illustrations Basic charts line icon set. Bar diagram, pie and histogram graph. Data visualization, growth and distribution analysis
Free with trial Blue bar chart with decreasing values beside a soft cloud shape and horizontal lines. Ideal for data analytics, cloud computing, business growth, technology, forecasts, trends, and innovation. Simple. Decrease bar illustrations Minimalist Bar Chart with Cloud Element Representing Data Analysis and Cloud Computing Concepts. Blue bar chart with decreasing values beside a soft cloud shape and horizontal lines. Ideal for data analytics, cloud computing, business growth, technology, forecasts, trends, and innovation. Simple
Free with trial A white line graph with connected points and a bar chart are shown within a dark gray circle icon, representing data analysis. Decrease bar illustrations White line graph and bar chart in a dark gray circle icon data statistics. A white line graph with connected points and a bar chart are shown within a dark gray circle icon, representing data analysis
Free with trial A vibrant and modern illustration of a bar graph, featuring four bars of varying heights and colors: blue, green, orange, and red. The bars are positioned on a gray horizontal line, creating a sense of data comparison and visual hierarchy. This image is ideal for representing data, statistics, business reports, financial analysis, or any concept requiring visual data representation. The clean design and bright colors make it suitable for presentations, websites, and marketing materials. Decrease bar illustrations Colorful Bar Graph Illustration. A vibrant and modern illustration of a bar graph, featuring four bars of varying heights and colors: blue, green, orange, and red. The bars are positioned on a gray horizontal line, creating a sense of data comparison and visual hierarchy. This image is ideal for representing data, statistics, business reports, financial analysis, or any concept requiring visual data representation. The clean design and bright colors make it suitable for presentations, websites, and marketing materials.
Free with trial A 3D blue bar chart and a dark blue line graph illustrate a significant downward trend, indicating a decline in data over time. Decrease bar illustrations Blue bar chart and line graph showing downward trend. A 3D blue bar chart and a dark blue line graph illustrate a significant downward trend, indicating a decline in data over time.
Free with trial Down graph chart arrow drop icon. Decrease downward vector market decrease down trend. Decrease bar vectors Down graph chart arrow drop icon. Decrease downward vector market decrease down trend.
Free with trial Smiling blue face beside a decreasing bar graph, signifying satisfaction, feedback, or performance trends. Ideal for analytics, feedback, emotions, surveys, performance data presentation simple. Decrease bar vectors Positive Feedback Represented by Happy Face and Declining Bar Graph. Smiling blue face beside a decreasing bar graph, signifying satisfaction, feedback, or performance trends. Ideal for analytics, feedback, emotions, surveys, performance data presentation simple
Free with trial A series of seven golden, metallic bars are arranged in a descending order, forming a bar chart that illustrates a significant decline. The bars are highly reflective, catching the light and emphasizing their three-dimensional form. The chart is presented in isolation against a pure white background, making the visual representation of a downward trend clear and impactful. Decrease bar illustrations Golden Bar Chart Showing a Steep Decline on White Background graph statistics. A series of seven golden, metallic bars are arranged in a descending order, forming a bar chart that illustrates a significant decline. The bars are highly reflective, catching the light and emphasizing their three-dimensional form. The chart is presented in isolation against a pure white background, making the visual representation of a downward trend clear and impactful
Free with trial A bright blue easel holds a whiteboard displaying a bar chart with a clear downward trend. The bars transition in color from green to red, and a prominent red arrow points downwards, emphasizing the decline. The illustration is set against a clean white background. Decrease bar illustrations Blue Easel Displaying a Downward Trend Bar Chart with Red Arrow graph decline. A bright blue easel holds a whiteboard displaying a bar chart with a clear downward trend. The bars transition in color from green to red, and a prominent red arrow points downwards, emphasizing the decline. The illustration is set against a clean white background
Free with trial A simple black silhouette of a bar chart with varying heights on a white background. The icon represents data analysis and statistical representation. Decrease bar vectors Bar chart icon for data analysis and statistics graph. A simple black silhouette of a bar chart with varying heights on a white background. The icon represents data analysis and statistical representation
Free with trial A black silhouette of a bar chart with three bars of decreasing height, representing a downward trend on a white background. Decrease bar illustrations Black Bar Chart Icon Showing Decreasing Values on White Background graph data. A black silhouette of a bar chart with three bars of decreasing height, representing a downward trend on a white background
Free with trial Economy downturn concept showing declining bar graph with red arrow, background,. Decrease bar illustrations Economy downturn concept showing declining bar graph with red arrow, background
Free with trial A conceptual illustration of market analysis featuring a bar chart, magnifying glass, upward and downward arrows, and business icons on white. Decrease bar illustrations Market Analysis Concept with Bar Chart Magnifying Glass and Upward Arrow graph. A conceptual illustration of market analysis featuring a bar chart, magnifying glass, upward and downward arrows, and business icons on white
Free with trial Bar chart with six vertical blue bars of descending height, indicating a negative trend. A jagged red arrow slants downward from left to right across the bars, emphasizing the decrease. No specific location is provided. Decrease bar vectors Financial bar chart showing downward trend with red arrow. Bar chart with six vertical blue bars of descending height, indicating a negative trend. A jagged red arrow slants downward from left to right across the bars, emphasizing the decrease. No specific location is provided.
Free with trial Data Stats Board Display Line Icon Downward Down Trend Statistic Performance Market Decline Economy Downturn Bar Graph Progress Outline Presentation. Decrease bar vectors Data Stats Board Display Line Icon Downward Down Trend Statistic Performance Market Decline Economy Downturn Bar Graph
Free with trial A 3D bar chart with two red bars and one taller green bar, topped by a percentage symbol in a circle. Decrease bar illustrations 3d bar chart illustrating percentage growth and decline. A 3D bar chart with two red bars and one taller green bar, topped by a percentage symbol in a circle
Free with trial 3D bar chart with red arrows pointing upwards, reflecting off a shiny, blue surface. The clean, minimalist design symbolizes financial growth, business success, and positive market trends. Ideal for use in presentations, financial reports, and marketing materials related to investment, stock market, and economic progress. Decrease bar illustrations Financial Growth 3D Bar Chart with Red Arrows. 3D bar chart with red arrows pointing upwards, reflecting off a shiny, blue surface. The clean, minimalist design symbolizes financial growth, business success, and positive market trends. Ideal for use in presentations, financial reports, and marketing materials related to investment, stock market, and economic progress
Free with trial 3D bar chart with red arrows pointing upwards, reflecting off a shiny, blue surface. The clean, minimalist design symbolizes financial growth, business success, and positive market trends. Ideal for use in presentations, financial reports, and marketing materials related to investment, stock market, and economic progress. Decrease bar illustrations Financial Growth 3D Bar Chart with Red Arrows. 3D bar chart with red arrows pointing upwards, reflecting off a shiny, blue surface. The clean, minimalist design symbolizes financial growth, business success, and positive market trends. Ideal for use in presentations, financial reports, and marketing materials related to investment, stock market, and economic progress
Free with trial 3D bar chart with red arrows pointing upwards, reflecting off a shiny, blue surface. The clean, minimalist design symbolizes financial growth, business success, and positive market trends. Ideal for use in presentations, financial reports, and marketing materials related to investment, stock market, and economic progress. Decrease bar illustrations Financial Growth 3D Bar Chart with Red Arrows. 3D bar chart with red arrows pointing upwards, reflecting off a shiny, blue surface. The clean, minimalist design symbolizes financial growth, business success, and positive market trends. Ideal for use in presentations, financial reports, and marketing materials related to investment, stock market, and economic progress
Free with trial A black bar graph icon with a downward arrow and trend line indicates a decline. Clear details and vibrant col. Decrease bar illustrations Black Bar Graph Icon with Downward Arrow and Trend Line on White Background data. A black bar graph icon with a downward arrow and trend line indicates a decline. Clear details and vibrant col
Free with trial Declining graph with bar chart and down arrow, vector graphic. Decrease bar vectors Declining graph with bar chart and down arrow, vector graphic
Free with trial Green bar graph illustrating continuous growth or progress. Decrease bar illustrations Green bar graph illustrating continuous growth or progress.
Free with trial Bar chart with falling growth, sad face icon, and signed financial document. Ideal for business reports, financial loss, analytics, economy, decline, strategy simple flat metaphor. Decrease bar vectors Declining Business Performance Indicated by Bar Chart and Sad Face Symbol. Bar chart with falling growth, sad face icon, and signed financial document. Ideal for business reports, financial loss, analytics, economy, decline, strategy simple flat metaphor
Free with trial A set of twelve black icons representing business and data analysis concepts, presented on a white background. The icons include various types of charts and graphs such as bar charts, a pie chart, and line graphs showing trends and fluctuations. There are also icons for data visualization, progress indicators, and reports. The collection is organized in a 3x4 grid. Decrease bar vectors Business and data analytics icons bar chart pie chart AI-Generated. A set of twelve black icons representing business and data analysis concepts, presented on a white background. The icons include various types of charts and graphs such as bar charts, a pie chart, and line graphs showing trends and fluctuations. There are also icons for data visualization, progress indicators, and reports. The collection is organized in a 3x4 grid
Free with trial A 3D bar graph illustrating a downward trend with a green arrow, featuring a heart icon with a minus sign, on a white background. Decrease bar illustrations 3D bar graph with a downward trending green arrow and a heart icon with a minus sign chart. A 3D bar graph illustrating a downward trend with a green arrow, featuring a heart icon with a minus sign, on a white background
Free with trial A 3D render of a white bar chart with a red arrow graph descending across it. The background is a white grid. The chart is isolated on a white surface with reflections. Decrease bar illustrations Red arrow graph chart showing downward trend on white grid background bar chart financial. A 3D render of a white bar chart with a red arrow graph descending across it. The background is a white grid. The chart is isolated on a white surface with reflections
Free with trial Two bar graphs, one green showing upward growth and one red showing downward decline, against a white background. Decrease bar illustrations Rising and falling bar graphs illustrating financial trends. Two bar graphs, one green showing upward growth and one red showing downward decline, against a white background
Free with trial Gold bars on graph and arrow up, growth, chart gold with increase and decrease, gold profit and loss concept. Decrease bar vectors Gold bars on graph and arrow up, growth, chart gold with increase and decrease, gold profit and loss concept
Free with trial Black triangular warning sign displaying a downward trending bar graph on a white background. Decrease bar illustrations Warning sign with a downward trending bar graph on a white background danger caution. Black triangular warning sign displaying a downward trending bar graph on a white background
Free with trial Line graph with plotted data points, bar chart, and triangular warning alert. Ideal for analytics, business, risk management, financial trends, forecasting, reporting performance tracking simple. Decrease bar vectors Data Analysis with Line Graph, Bar Chart, and Warning Sign for Risk Monitoring. Line graph with plotted data points, bar chart, and triangular warning alert. Ideal for analytics, business, risk management, financial trends, forecasting, reporting performance tracking simple
Free with trial A black bar graph showing a decline with the word disinflation below it on a white background. Decrease bar illustrations Declining bar graph with the word disinflation on a white background economy price. A black bar graph showing a decline with the word disinflation below it on a white background
Free with trial This image features a minimalist black and white bar graph icon, depicting data analysis. It includes vertical bars of varying heights along horizontal and vertical axes. Decrease bar vectors Simple Black and White Bar Graph Icon for Data Visualization. This image features a minimalist black and white bar graph icon, depicting data analysis. It includes vertical bars of varying heights along horizontal and vertical axes.
Free with trial Woman suffers from slow internet and pushes loading bar with snail, needing to connect to 5G network. Problems with internet causing decrease in productivity for completing work tasks. Decrease bar vectors Woman suffers from slow internet and pushes loading bar with snail, needing to connect to 5G network
Free with trial A vector icon in a minimalistic style, depicting a stylized anatomical heart (in pink tones) with a horizontal bar and a downward-pointing arrow. the symbol can mean emotional discharge, data download in medicine, loss or decrease (e. g. , pulse, love, or charge). ideal for themes related to medicine, health, relationships, emotional state, or application functions. Decrease bar illustrations Conceptual icon: anatomical heart and downward loading arrow. A vector icon in a minimalistic style, depicting a stylized anatomical heart (in pink tones) with a horizontal bar and a downward-pointing arrow. the symbol can mean emotional discharge, data download in medicine, loss or decrease (e.g., pulse, love, or charge). ideal for themes related to medicine, health, relationships, emotional state, or application functions.