Free with trial A close-up view of a monitor displaying complex financial data, including stock market charts and numerical values. Stock market Data Displayed on a Monitor. Decrease charts illustrations Stock market Data Displayed on a Monitor. A close-up view of a monitor displaying complex financial data, including stock market charts and numerical values. A close-up view of a monitor displaying complex financial data, including stock market charts and numerical values. Stock market Data Displayed on a Monitor
Free with trial Composite trend artwork sketch photo collage of monochrome young woman walk step huge analyzing arrow go down direction crisis decrease. Decrease charts illustrations Composite trend artwork sketch photo collage of monochrome young woman walk step huge analyzing arrow go down direction. Crisis decrease
Free with trial Witness the dynamic energy of the modern financial world in this captivating image. A digital display showcases a thriving stock market, complete with upward trends in financial charts and a stack of coins symbolizing wealth accumulation. The computer screen, the central focus, displays a complex array of financial graphs, highlighting market fluctuations and growth indicators. This visual. Decrease charts illustrations Stock Market Growth A Thriving Investment Landscape Visualized on a Computer Screen with Stacked Coins Charts and. Witness the dynamic energy of the modern. Witness the dynamic energy of the modern financial world in this captivating image. A digital display showcases a thriving stock market, complete with upward trends in financial charts and a stack of coins symbolizing wealth accumulation. The computer screen, the central focus, displays a complex array of financial graphs, highlighting market fluctuations and growth indicators. This visual
Free with trial A pair of gleaming gold bars placed on digital financial graphs, symbolizing wealth and investment strategy. The background features abstract data points and fluctuating lines. Decrease charts illustrations Shiny Gold Bars Resting on Financial Charts Representing Wealth and Investment Opportunities. A pair of gleaming gold bars placed on digital financial graphs. A pair of gleaming gold bars placed on digital financial graphs, symbolizing wealth and investment strategy. The background features abstract data points and fluctuating lines
Free with trial Futuristic financial data visualization with graphs and charts showing growth and market trends. Decrease charts illustrations Futuristic financial data visualization with graphs and charts showing growth and market trends.
Free with trial Unsuccessful investments cause negative emotions in woman standing among declining charts. Girl had bad luck and lost income or investments due to crisis and lack of financial analysis. Decrease charts vectors Unsuccessful investments cause negative emotions in woman standing among declining charts. Girl had bad luck and lost income or investments due to crisis and
Free with trial Business analytics, data visualization, market research, financial reports, and growth strategies are symbolized in this image. Elegant empty space crafted for branding, ads, and product presentations. Suitable for marketing campaigns and creative displays. . Generative AI. Decrease charts illustrations Colorful Data Charts and Graphs on White Background Business analytics data visualization market research financial reports. Business analytics, data. Business analytics, data visualization, market research, financial reports, and growth strategies are symbolized in this image. Elegant empty space crafted for branding, ads, and product presentations. Suitable for marketing campaigns and creative displays. . Generative AI
Free with trial Person using smartphone for stock trading. Mobile phone displays financial data charts. Hands actively interact with screen. Market trends shown in background. Businessman investor. Decrease charts illustrations Person using smartphone for stock trading. Mobile phone displays financial data, charts. Hands actively interact with screen. Person using smartphone for stock. Person using smartphone for stock trading. Mobile phone displays financial data charts. Hands actively interact with screen. Market trends shown in background. Businessman investor.
Free with trial Infochart, Block diagram and Algorithm. Charts and graphs line icons. Presentation linear icon set Line icons set. Vector. Decrease charts illustrations Charts and graphs line icons. Infochart, Block diagram and Algorithm. Linear icon set. Line icons. Vector. Infochart, Block diagram and Algorithm. Charts and. Infochart, Block diagram and Algorithm. Charts and graphs line icons. Presentation linear icon set Line icons set. Vector
Free with trial This image showcases six vibrant icons representing various data visualization methods, including pie charts, bar graphs, and gauges. These colorful and engaging visuals are perfect for presentations or reports and were generated by AI. They offer a quick and easy way to represent data in a clear a. Decrease charts illustrations Colorful Data Visualization Icons. This image showcases six vibrant icons representing various data visualization methods, including pie charts, bar graphs, and. This image showcases six vibrant icons representing various data visualization methods, including pie charts, bar graphs, and gauges. These colorful and engaging visuals are perfect for presentations or reports and were generated by AI. They offer a quick and easy way to represent data in a clear a
Free with trial Open notebook displaying sales data with charts, graphs, and the word sales highlighted, illuminated by a desk lamp, symbolizing business analysis and strategy. Decrease charts illustrations Sales report with charts and graphs illuminated by desk lamp. Open notebook displaying sales data with charts, graphs, and the word sales highlighted. Open notebook displaying sales data with charts, graphs, and the word sales highlighted, illuminated by a desk lamp, symbolizing business analysis and strategy
Free with trial Strategic Decisions: Integrating Business Analytics with Strategic Thinking. This visual portrays the dynamic interaction between business analytics and strategic thinking, showcasing how analytical insights drive strategic planning and decision-making. It emphasizes the synergy between data analysis and strategic foresight in achieving business goals. --chaos 10 --ar 16:9 --style raw --stylize, immersive wallpaper background. Decrease charts illustrations Hand Drawn Colorful Bar Charts and Pie Charts. Strategic Decisions: Integrating Business Analytics with Strategic Thinking. This visual portrays the dynamic. Strategic Decisions: Integrating Business Analytics with Strategic Thinking. This visual portrays the dynamic interaction between business analytics and strategic thinking, showcasing how analytical insights drive strategic planning and decision-making. It emphasizes the synergy between data analysis and strategic foresight in achieving business goals. --chaos 10 --ar 16:9 --style raw --stylize, immersive wallpaper background
Free with trial Collection of red infographic elements including charts, graphs, diagrams and icons. Perfect for presentations, reports, and data visualization. Clean, modern design. Decrease charts illustrations Red Infographic Elements. Collection of red infographic elements including charts, graphs, diagrams and icons. Perfect for presentations, reports, and data. Collection of red infographic elements including charts, graphs, diagrams and icons. Perfect for presentations, reports, and data visualization. Clean, modern design.
Free with trial This image showcases two contrasting bar charts, constructed from red and white blocks, generated by AI. One chart depicts growth, while the other illustrates decline, offering a visual representation of opposing trends. The use of color and simple shapes makes it easily understandable. Decrease charts illustrations AI-Generated Block Charts: Growth & Decline. This image showcases two contrasting bar charts, constructed from red and white blocks, generated by AI. One chart. This image showcases two contrasting bar charts, constructed from red and white blocks, generated by AI. One chart depicts growth, while the other illustrates decline, offering a visual representation of opposing trends. The use of color and simple shapes makes it easily understandable.
Free with trial Multiple line charts showing data trends over months on a grid background. Concept of data analysis and financial growth. 3D Rendering. Decrease charts illustrations Multiple line charts showing data trends over months on grid background. 3D Rendering. Multiple line charts showing data trends over months on a grid background. Multiple line charts showing data trends over months on a grid background. Concept of data analysis and financial growth. 3D Rendering
Free with trial A pair of hands gently cradles four small, wooden house models against a backdrop of financial charts and graphs. The image evokes concepts of real estate investment, market analysis, and the security of owning property. The wooden houses symbolize homes and the charts represent market trends, making it suitable for illustrating financial articles, investment advice, or real estate services. Decrease charts illustrations Real Estate Market Analysis and Investment. A pair of hands gently cradles four small, wooden house models against a backdrop of financial charts and graphs. The. A pair of hands gently cradles four small, wooden house models against a backdrop of financial charts and graphs. The image evokes concepts of real estate investment, market analysis, and the security of owning property. The wooden houses symbolize homes and the charts represent market trends, making it suitable for illustrating financial articles, investment advice, or real estate services.
Free with trial This image portrays the concept of analyzing stock market trends through the use of candlestick charts. The red candlestick represents a bearish trend, indicating a decrease in stock prices. The various lines and shapes on the chart represent patterns and indicators used by traders to predict future market movements. This image conveys the importance of careful analysis and strategic decision-making in the stock market. The flickering flame of the candlestick adds a sense of urgency and volatility to the overall message. Overall, this image is perfect for presentations or articles related to finance, trading, and investment. Decrease charts illustrations Red Candlestick Analysis: Stock Market Trading Charts. This image portrays the concept of analyzing stock market trends through the use of candlestick charts. This image portrays the concept of analyzing stock market trends through the use of candlestick charts. The red candlestick represents a bearish trend, indicating a decrease in stock prices. The various lines and shapes on the chart represent patterns and indicators used by traders to predict future market movements. This image conveys the importance of careful analysis and strategic decision-making in the stock market. The flickering flame of the candlestick adds a sense of urgency and volatility to the overall message. Overall, this image is perfect for presentations or articles related to finance, trading, and investment.
Free with trial Strategic Decisions: Integrating Business Analytics with Strategic Thinking. This visual portrays the dynamic interaction between business analytics and strategic thinking, showcasing how analytical insights drive strategic planning and decision-making. It emphasizes the synergy between data analysis and strategic foresight in achieving business goals. --chaos 10 --ar 16:9 --style raw --stylize, aesthetic wallpaper background. Decrease charts illustrations Colorful Pie Charts and Bar Graphs on a White Paper. Strategic Decisions: Integrating Business Analytics with Strategic Thinking. This visual portrays the. Strategic Decisions: Integrating Business Analytics with Strategic Thinking. This visual portrays the dynamic interaction between business analytics and strategic thinking, showcasing how analytical insights drive strategic planning and decision-making. It emphasizes the synergy between data analysis and strategic foresight in achieving business goals. --chaos 10 --ar 16:9 --style raw --stylize, aesthetic wallpaper background
Free with trial An isometric illustration shows a computer screen displaying colorful data charts and graphs alongside related financial icons. Decrease charts illustrations Colorful Data Analytics Displayed on Computer Screen. An isometric illustration shows a computer screen displaying colorful data charts and graphs alongside. An isometric illustration shows a computer screen displaying colorful data charts and graphs alongside related financial icons
Free with trial Cheerful cartoon businessman reviewing positive financial data upward trending graph. Decrease charts illustrations Happy Businessman Analyzing Financial Growth Charts. Cheerful cartoon businessman reviewing positive financial data upward trending graph. Cheerful cartoon businessman reviewing positive financial data upward trending graph.
Free with trial An elderly man on concrete stairs, New York skyline. Falling forex charts. Decrease charts illustrations An elderly man on concrete stairs, New York skyline. Falling forex charts. AI generated. An elderly man on concrete stairs, New York skyline. Falling forex charts..
Free with trial A close-up, angled perspective of several printed business reports displaying a variety of financial data. The documents feature colorful pie charts, blue bar graphs, and line graphs tracking performance and statistics. This image is perfect for illustrating concepts such as data analysis, market research, financial planning, investment strategy, and corporate performance review. The detailed charts and figures represent the core of business analytics, accounting, and economic forecasting, making it a versatile background for financial presentations and articles. Decrease charts illustrations Business Analytics Report with Financial Charts and Graphs. A close-up, angled perspective of several printed business reports displaying a variety of financial. A close-up, angled perspective of several printed business reports displaying a variety of financial data. The documents feature colorful pie charts, blue bar graphs, and line graphs tracking performance and statistics. This image is perfect for illustrating concepts such as data analysis, market research, financial planning, investment strategy, and corporate performance review. The detailed charts and figures represent the core of business analytics, accounting, and economic forecasting, making it a versatile background for financial presentations and articles.
Free with trial The image showcases a sophisticated data visualization dashboard presenting global information via interactive maps, charts, and graphs. Decrease charts illustrations Global Data Visualization Dashboard Displays Complex Information. The image showcases a sophisticated data visualization dashboard presenting global information. The image showcases a sophisticated data visualization dashboard presenting global information via interactive maps, charts, and graphs
Free with trial Simple Set of Increase and Decrease Related Vector Art on a white background" features a clean and minimalist collection of icons representing growth, decline, progress, and reduction. The set includes arrows, charts, and symbols with sleek, solid designs, making it ideal for business, finance, or analytical presentations. These versatile and visually straightforward icons are perfect for conveying trends and changes with clarity and professionalism. Decrease charts vectors Simple Set of Increase and Decrease Related Vector art on white background. Simple Set of Increase and Decrease Related Vector Art on a white background'. Simple Set of Increase and Decrease Related Vector Art on a white background" features a clean and minimalist collection of icons representing growth, decline, progress, and reduction. The set includes arrows, charts, and symbols with sleek, solid designs, making it ideal for business, finance, or analytical presentations. These versatile and visually straightforward icons are perfect for conveying trends and changes with clarity and professionalism.
Free with trial A bright red arrow points upwards symbolizing growth and profit, while a vibrant green arrow points downwards signifying a decrease or loss. Ideal for finance and business concepts. Decrease charts vectors Red up arrow and green down arrow symbols representing financial growth and decline. A bright red arrow points upwards symbolizing growth and profit, while a. A bright red arrow points upwards symbolizing growth and profit, while a vibrant green arrow points downwards signifying a decrease or loss. Ideal for finance and business concepts
Free with trial Data analysis graphs with up and down arrow line icons set. Increase and reduction of economy or trend charts, price boost, stock market research thin black and red outline symbols vector illustration. Decrease charts vectors Data analysis graphs with up and down arrow, economy or trend charts line icons set. Data analysis graphs with up and down arrow line icons set. Increase and. Data analysis graphs with up and down arrow line icons set. Increase and reduction of economy or trend charts, price boost, stock market research thin black and red outline symbols vector illustration
Free with trial Anxious Cryptocurrency Trader Male Character Sits At Desk, Eyes Fixed On Laptop Screen, Nervously Checking Candlestick Market Charts, Uncertainty Evident. Cartoon People Vector Illustration. Decrease charts vectors Anxious Cryptocurrency Trader Male Character Sits At Desk, Eyes Fixed On Laptop Screen, Nervously Checking Market Charts. Anxious Cryptocurrency Trader Male. Anxious Cryptocurrency Trader Male Character Sits At Desk, Eyes Fixed On Laptop Screen, Nervously Checking Candlestick Market Charts, Uncertainty Evident. Cartoon People Vector Illustration
Free with trial A vector icon illustrating a downward trending line graph, symbolizing a decline, decrease, or negative performance. Ideal for financial reports, data analysis dashboards, or warning indicators. This clear and concise graphic is scalable, perfect for conveying trend information in various digital interfaces, vector design Generative AI. Decrease charts vectors Declining Trend Graph Icon - Downturn Analysis Symbol, vector design Generative AI. A vector icon illustrating a downward trending line graph, symbolizing a. A vector icon illustrating a downward trending line graph, symbolizing a decline, decrease, or negative performance. Ideal for financial reports, data analysis dashboards, or warning indicators. This clear and concise graphic is scalable, perfect for conveying trend information in various digital interfaces, vector design Generative AI
Free with trial Report, 3D Chart, Block diagram and Dot Plot graph linear icons. Design shape elements. Charts and Diagrams line icons. Trend, Pyramid and Pie chart report symbols. Vector. Decrease charts vectors Charts and Diagrams line icons. Set of 3D Chart, Block diagram and Dot Plot graph icons. Design elements. Vector. Report, 3D Chart, Block diagram and Dot Plot. Report, 3D Chart, Block diagram and Dot Plot graph linear icons. Design shape elements. Charts and Diagrams line icons. Trend, Pyramid and Pie chart report symbols. Vector
Free with trial A person in a suit points at a digital screen displaying charts that illustrate improvements in quality and reductions in cost. Decrease charts illustrations Person pointing at digital screen showing quality and cost improvement business strategy. A person in a suit points at a digital screen displaying charts that. A person in a suit points at a digital screen displaying charts that illustrate improvements in quality and reductions in cost
Free with trial Gold business icons on dark background graphs, charts, money, global, growth, finance, planning, idea, vibrant background Generative AI. Decrease charts illustrations Gold business icons on dark background graphs, charts, money, global, growth, finance, planning, idea. Vibrant background Generative AI
Free with trial Charts and graphs, Presentation and Report. Graph line icons. Analytics linear icon set. Line icons set. Vector. Decrease charts illustrations Graph line icons. Charts and graphs, Presentation and Report. Linear icon set. Line icons. Vector. Charts and graphs, Presentation and Report. Graph line icons. Charts and graphs, Presentation and Report. Graph line icons. Analytics linear icon set. Line icons set. Vector
Free with trial Charts and graphs, Presentation and Report. Graph line icons. Analytics linear icon set. Line icons set. Vector. Decrease charts illustrations Graph line icons. Charts and graphs, Presentation and Report. Linear icon set. Line icons. Vector. Charts and graphs, Presentation and Report. Graph line icons. Charts and graphs, Presentation and Report. Graph line icons. Analytics linear icon set. Line icons set. Vector
Free with trial Person analyses stock market trends on mobile phone. Investor views financial data on smartphone display. Stock charts display, market fluctuations. Businessman tracks investment. Decrease charts illustrations Person analyses stock market trends on mobile phone. Investor views financial data on smartphone display. Stock charts display. Market fluctuations. Person analyses stock market trends on mobile phone. Investor views financial data on smartphone display. Stock charts display, market fluctuations. Businessman tracks investment.
Free with trial A set of linear icons depicting financial growth, including upward arrows, charts, and currency symbols, representing economic progress and investment trends on white. Decrease charts vectors Vector art of financial growth icons a collection of symbols representing economic progress, investment, and market trends. A set of linear icons depicting. A set of linear icons depicting financial growth, including upward arrows, charts, and currency symbols, representing economic progress and investment trends on white
Free with trial The image captures a close-up view of someone examining financial charts on a screen, possibly for making trading or investment decisions, emphasizing the data-driven nature of finance. Decrease charts illustrations A person analyzing financial market charts on a screen, possibly for investment or trading decisions. Data-driven finance concept. The image captures a close-up. The image captures a close-up view of someone examining financial charts on a screen, possibly for making trading or investment decisions, emphasizing the data-driven nature of finance
Free with trial Person holding tablet displaying globe with eco data charts. Sustainable tech used for global investment strategy corporate responsibility in environmental governance. Data visualization. Decrease charts illustrations Person holding tablet displaying globe with eco data charts. Sustainable tech used for global investment strategy, corporate. Person holding tablet displaying. Person holding tablet displaying globe with eco data charts. Sustainable tech used for global investment strategy corporate responsibility in environmental governance. Data visualization.
Free with trial Downward trending line graph displayed on digital screen. Financial decline visualized with red charts numbers representing loss. Business downturn economic recession or market. Decrease charts illustrations Downward trending line graph displayed on digital screen. Financial decline visualized with red charts numbers representing loss. Business downturn economic
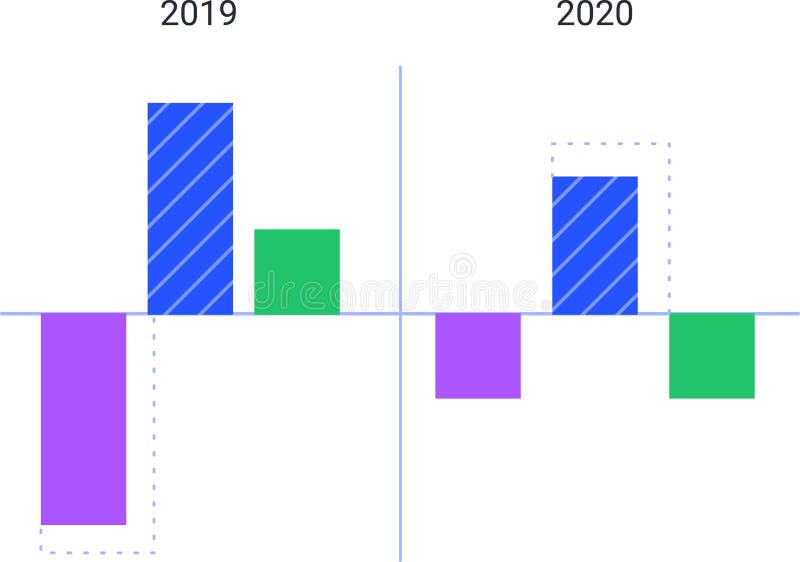
Free with trial Colorful bar charts are comparing data from 2019 and 2020, visualizing trends and statistics with positive and negative values represented by upward and downward bars. Decrease charts vectors Colorful bar charts are comparing data from 2019 and 2020, visualizing trends and statistics with positive and negative. Values represented by upward and
Free with trial Colorful bar charts are comparing data from 2019 and 2020, visualizing trends and statistics with positive and negative values represented by upward and downward bars. Decrease charts illustrations Colorful bar charts are comparing data from 2019 and 2020, visualizing trends and statistics with positive and negative. Values represented by upward and
Free with trial A clean, minimalist set of hand-drawn financial and business icons in black on a white background. This graphic features elements like coins, money, charts, and savings. Decrease charts vectors Finance and Business Icons. A clean, minimalist set of hand-drawn financial and business icons in black on a white background. This graphic features elements. A clean, minimalist set of hand-drawn financial and business icons in black on a white background. This graphic features elements like coins, money, charts, and savings
Free with trial Green and Red Trend Arrows. Financial Growth and Decline Bar Charts with Green and Red Trend Arrows. Decrease charts vectors Green and Red Trend Arrows. Financial Growth and Decline Bar Charts with Green and Red Trend Arrows
Free with trial Illustration of a stressed businessman in suit sitting at desk holding his head in frustration surrounded by financial crisis icons including rising red arrow charts, fuel pump, money bags, coins, falling profits, delivery truck, factory warning, gauge, calculator and bar graphs. Concept of inflation, high operating costs, economic recession and business pressure. Ideal for articles about finance, energy crisis, logistics, budgeting and corporate stress management. Decrease charts vectors Stressed Businessman Worried About Rising Inflation Costs. Illustration of a stressed businessman in suit sitting at desk holding his head in frustration. Illustration of a stressed businessman in suit sitting at desk holding his head in frustration surrounded by financial crisis icons including rising red arrow charts, fuel pump, money bags, coins, falling profits, delivery truck, factory warning, gauge, calculator and bar graphs. Concept of inflation, high operating costs, economic recession and business pressure. Ideal for articles about finance, energy crisis, logistics, budgeting and corporate stress management.
Free with trial A striking 3D representation of the Bitcoin symbol in red, superimposed against a background of dynamic financial charts, including bar graphs and a red interconnected network structure. This visualization captures the volatility and global connectivity inherent in cryptocurrency markets and trading. The high-contrast design emphasizes digital finance and blockchain concepts. Rendered by Ai. Decrease charts illustrations Bitcoin Symbol and Abstract Trading Market Data. A striking 3D representation of the Bitcoin symbol in red, superimposed against a background of dynamic. A striking 3D representation of the Bitcoin symbol in red, superimposed against a background of dynamic financial charts, including bar graphs and a red interconnected network structure. This visualization captures the volatility and global connectivity inherent in cryptocurrency markets and trading. The high-contrast design emphasizes digital finance and blockchain concepts. Rendered by Ai
Free with trial Bold red arrow pointing downward with subtle shadow effect. Directional icon for navigation, download indicators, charts or web design. Decrease charts vectors Red downward arrow symbol vector illustration. Bold red arrow pointing downward with subtle shadow effect. Directional icon for navigation, download indicators. Bold red arrow pointing downward with subtle shadow effect. Directional icon for navigation, download indicators, charts or web design.
Free with trial A minimalist, black and white vector illustration depicting a financial graph with a clear downward trend. The graph features a jagged line representing fluctuating data, leading into a bold, thick arrow pointing downwards and to the right. This icon symbolizes decline, loss, recession, or negative performance in various contexts, such as business, economics, or stock markets. Its clean design makes it versatile for presentations, websites, and infographics. Decrease charts vectors Downward Trend Graph with Arrow Icon. A minimalist, black and white vector illustration depicting a financial graph with a clear downward trend. The graph. A minimalist, black and white vector illustration depicting a financial graph with a clear downward trend. The graph features a jagged line representing fluctuating data, leading into a bold, thick arrow pointing downwards and to the right. This icon symbolizes decline, loss, recession, or negative performance in various contexts, such as business, economics, or stock markets. Its clean design makes it versatile for presentations, websites, and infographics.
Free with trial Two downward trend bar chart illustrations showing economic decline and negative financial performance in a minimalist style. Decrease charts vectors Downward trend bar charts with arrows. Two downward trend bar chart illustrations showing economic decline and negative financial performance in a minimalist. Two downward trend bar chart illustrations showing economic decline and negative financial performance in a minimalist style
Free with trial Economic trends, growth and decline, business performance, market analysis, financial success, economic strategy. Bar chart with upward arrows and a downward arrow. Growth and decline concept. Decrease charts vectors Economic Growth and Decline Concept with Arrows and Bar Charts. Economic trends, growth and decline, business performance, market analysis, financial success. Economic trends, growth and decline, business performance, market analysis, financial success, economic strategy. Bar chart with upward arrows and a downward arrow. Growth and decline concept
Free with trial Growth, profit, business vector icons. Black linear graphs, charts representing market trends, finance analytics. Perfect for economic forecasts, trend an VECTOR. Decrease charts illustrations Business Growth and Profit Graph Icon Collection. Growth, profit, business vector icons. Black linear graphs, charts representing market trends, finance. Growth, profit, business vector icons. Black linear graphs, charts representing market trends, finance analytics. Perfect for economic forecasts, trend an VECTOR
Free with trial Colorful flat infographic set illustrating inflation, recession and economic trends on white background. Includes icons of coin stacks, shopping carts, price tags, rising bar charts, fuel pump, housing decline, grocery basket, shipping containers and central circular diagram with green upward and red downward arrows. Perfect for financial reports, business presentations, economic articles, marketing and educational materials explaining market volatility, consumer prices and global trade impact. Decrease charts vectors Economic Inflation Icons with Market Trend Arrows. Colorful flat infographic set illustrating inflation, recession and economic trends on white background. Colorful flat infographic set illustrating inflation, recession and economic trends on white background. Includes icons of coin stacks, shopping carts, price tags, rising bar charts, fuel pump, housing decline, grocery basket, shipping containers and central circular diagram with green upward and red downward arrows. Perfect for financial reports, business presentations, economic articles, marketing and educational materials explaining market volatility, consumer prices and global trade impact.
Free with trial A simple flat design graphic illustrates stock market growth and decline using green upward and red downward arrows with bar charts. Ideal for finance and business concepts. Decrease charts vectors Bar chart showing financial growth and decline. A simple flat design graphic illustrates stock market growth and decline using green upward and red downward. A simple flat design graphic illustrates stock market growth and decline using green upward and red downward arrows with bar charts. Ideal for finance and business concepts
Free with trial Isometric of a blue delivery truck cracking under pressure from two large orange arrows labeled rising costs and stiff competition. Dollar signs, falling packages, upward cost graphs and profit margin charts surround the vehicle on a white background. This business concept visualizes logistics challenges, inflation, fuel prices and market rivalry. Ideal for articles, presentations and reports on transportation, supply chain management and economic pressure. Decrease charts vectors Delivery Truck Squeezed by Rising Costs Competition. Isometric of a blue delivery truck cracking under pressure from two large orange arrows labeled rising costs. Isometric of a blue delivery truck cracking under pressure from two large orange arrows labeled rising costs and stiff competition. Dollar signs, falling packages, upward cost graphs and profit margin charts surround the vehicle on a white background. This business concept visualizes logistics challenges, inflation, fuel prices and market rivalry. Ideal for articles, presentations and reports on transportation, supply chain management and economic pressure.
Free with trial Vector graphic showing business profit and loss statement with green upward trends, red declines, percentages, calculator, and money icons. Decrease charts illustrations Illustrated Profit and Loss Financial Report with Charts and Graphs. Vector graphic showing business profit and loss statement with green upward trends, red. Vector graphic showing business profit and loss statement with green upward trends, red declines, percentages, calculator, and money icons
Free with trial Vector showing a giant business hand pressing down on a small car with red downward arrows and dollar signs falling around it. A worried man stands beside bar charts on cracked road, symbolizing automotive market crash, depreciation, rising costs and economic pressure. Colorful flat style isolated on white background. Ideal for articles about car insurance, recession, inflation, auto industry crisis and financial stress. Decrease charts vectors Large hand crushing car with falling financial arrows. Vector showing a giant business hand pressing down on a small car with red downward arrows and dollar. Vector showing a giant business hand pressing down on a small car with red downward arrows and dollar signs falling around it. A worried man stands beside bar charts on cracked road, symbolizing automotive market crash, depreciation, rising costs and economic pressure. Colorful flat style isolated on white background. Ideal for articles about car insurance, recession, inflation, auto industry crisis and financial stress.
Free with trial A contrasting vector graphic set showing rising green bars with an upward arrow and falling red bars with a downward arrow, representing financial growth and decline. Decrease charts vectors Business bar charts indicating growth and decline. A contrasting vector graphic set showing rising green bars with an upward arrow and falling red bars with a. A contrasting vector graphic set showing rising green bars with an upward arrow and falling red bars with a downward arrow, representing financial growth and decline
Free with trial Simple black icons representing financial growth and decline, perfect for business analytics and reporting. This scalable vector graphic is versatile for web and print. Decrease charts vectors Bar charts with arrows indicating growth or decline. Simple black icons representing financial growth and decline, perfect for business analytics and reporting. Simple black icons representing financial growth and decline, perfect for business analytics and reporting. This scalable vector graphic is versatile for web and print
Free with trial Demography and population dynamics infographic set showing urbanization, migration, growth and decline, charts and icons for census, density, age structure, fertility, mortality, and trends. Decrease charts vectors Demography population statistics growth analysis icon set. Demography and population dynamics infographic set showing urbanization, migration, growth and decline. Demography and population dynamics infographic set showing urbanization, migration, growth and decline, charts and icons for census, density, age structure, fertility, mortality, and trends
Free with trial A collection of glossy 3D red arrows pointing downwards. These icons are perfect for digital interfaces, website navigation, or infographics requiring clear directional indicators. Decrease charts illustrations Glossy 3D red arrow icons pointing down in grid formation. A collection of glossy 3D red arrows pointing downwards. These icons are perfect for digital. A collection of glossy 3D red arrows pointing downwards. These icons are perfect for digital interfaces, website navigation, or infographics requiring clear directional indicators.
Free with trial 3D illustration of a bank building coins and falling red arrow against stock market charts representing financial crisis recession and economic decline. Decrease charts illustrations Banking Crisis During Global Stock Market Decline 3d render. 3D illustration of a bank building coins and falling red arrow against stock market charts. 3D illustration of a bank building coins and falling red arrow against stock market charts representing financial crisis recession and economic decline
Free with trial 3D illustration of a bank building coins and falling red arrow against stock market charts representing financial crisis recession and economic decline. Decrease charts illustrations Banking Crisis During Global Stock Market Decline 3d render. 3D illustration of a bank building coins and falling red arrow against stock market charts. 3D illustration of a bank building coins and falling red arrow against stock market charts representing financial crisis recession and economic decline
Free with trial 3D illustration of a bank building coins and falling red arrow against stock market charts representing financial crisis recession and economic decline. Decrease charts illustrations Banking Crisis During Global Stock Market Decline 3d render. 3D illustration of a bank building coins and falling red arrow against stock market charts. 3D illustration of a bank building coins and falling red arrow against stock market charts representing financial crisis recession and economic decline
Free with trial 3D illustration of a bank building coins and falling red arrow against stock market charts representing financial crisis recession and economic decline. Decrease charts illustrations Banking Crisis During Global Stock Market Decline 3d render. 3D illustration of a bank building coins and falling red arrow against stock market charts. 3D illustration of a bank building coins and falling red arrow against stock market charts representing financial crisis recession and economic decline
Free with trial 3D illustration of a bank building coins and falling red arrow against stock market charts representing financial crisis recession and economic decline. Decrease charts illustrations Banking Crisis During Global Stock Market Decline 3d render. 3D illustration of a bank building coins and falling red arrow against stock market charts. 3D illustration of a bank building coins and falling red arrow against stock market charts representing financial crisis recession and economic decline
Free with trial 3D illustration of a bank building coins and falling red arrow against stock market charts representing financial crisis recession and economic decline. Decrease charts illustrations Banking Crisis During Global Stock Market Decline 3d render. 3D illustration of a bank building coins and falling red arrow against stock market charts. 3D illustration of a bank building coins and falling red arrow against stock market charts representing financial crisis recession and economic decline
Free with trial 3D illustration of a bank building coins and falling red arrow against stock market charts representing financial crisis recession and economic decline. Decrease charts illustrations Banking Crisis During Global Stock Market Decline 3d render. 3D illustration of a bank building coins and falling red arrow against stock market charts. 3D illustration of a bank building coins and falling red arrow against stock market charts representing financial crisis recession and economic decline
Free with trial 3D illustration of a bank building coins and falling red arrow against stock market charts representing financial crisis recession and economic decline. Decrease charts illustrations Banking Crisis During Global Stock Market Decline 3d render. 3D illustration of a bank building coins and falling red arrow against stock market charts. 3D illustration of a bank building coins and falling red arrow against stock market charts representing financial crisis recession and economic decline
Free with trial 3D illustration of a bank building coins and falling red arrow against stock market charts representing financial crisis recession and economic decline. Decrease charts illustrations Banking Crisis During Global Stock Market Decline 3d render. 3D illustration of a bank building coins and falling red arrow against stock market charts. 3D illustration of a bank building coins and falling red arrow against stock market charts representing financial crisis recession and economic decline
Free with trial 3D illustration of a bank building coins and falling red arrow against stock market charts representing financial crisis recession and economic decline. Decrease charts illustrations Banking Crisis During Global Stock Market Decline 3d render. 3D illustration of a bank building coins and falling red arrow against stock market charts. 3D illustration of a bank building coins and falling red arrow against stock market charts representing financial crisis recession and economic decline
Free with trial 3D illustration of a bank building coins and falling red arrow against stock market charts representing financial crisis recession and economic decline. Decrease charts illustrations Banking Crisis During Global Stock Market Decline 3d render. 3D illustration of a bank building coins and falling red arrow against stock market charts. 3D illustration of a bank building coins and falling red arrow against stock market charts representing financial crisis recession and economic decline
Free with trial 3D illustration of a bank building coins and falling red arrow against stock market charts representing financial crisis recession and economic decline. Decrease charts illustrations Banking Crisis During Global Stock Market Decline 3d render. 3D illustration of a bank building coins and falling red arrow against stock market charts. 3D illustration of a bank building coins and falling red arrow against stock market charts representing financial crisis recession and economic decline
Free with trial Black Chart Bar Icons With Downward Pointing Arrows Set. A set of minimalist black icons showing declining bar charts with downward pointing arrows. Decrease charts vectors Black Chart Bar Icons With Downward Pointing Arrows Set. A set of minimalist black icons showing declining bar charts with downward pointing arrows
Free with trial A professional vector icon set featuring a four-quadrant grid layout displaying bullish upward trends, bearish downward trends, and growing versus declining bar charts. This design represents financial performance comparisons, stock market data dashboards, multi-asset trend analysis, and business analytics evaluation. Includes line art, solid glyph, and modern cyan-blue flat color variations. Perfect for trading platforms, stock market apps, financial analysis software, and corporate reporting tools. Fully editable vector illustration. Decrease charts vectors Financial Comparison Grid and Stock Trend Analysis Icon Set. A professional vector icon set featuring a four-quadrant grid layout displaying bullish upward. A professional vector icon set featuring a four-quadrant grid layout displaying bullish upward trends, bearish downward trends, and growing versus declining bar charts. This design represents financial performance comparisons, stock market data dashboards, multi-asset trend analysis, and business analytics evaluation. Includes line art, solid glyph, and modern cyan-blue flat color variations. Perfect for trading platforms, stock market apps, financial analysis software, and corporate reporting tools. Fully editable vector illustration.
Free with trial Illustration depicting an AI-powered churn prediction model. Features include a robot icon symbolizing AI, with sections labeled User Behavior, Engagement Metrics, and Support Tickets. The central Churn Risk Analysis indicates High Risk at 80%, highlighting factors like low activity, reduced logins, and declining usage. A user decline trend graph shows a decrease in active users over time, with a marked high churn zone. An alert section identifies an at-risk user, suggesting customized interventions and incentives. A male figure exits with a briefcase, symbolizing user churn. Decrease charts vectors AI-Powered Churn Prediction Model Overview. Illustration depicting an AI-powered churn prediction model. Features include a robot icon symbolizing AI, with. Illustration depicting an AI-powered churn prediction model. Features include a robot icon symbolizing AI, with sections labeled User Behavior, Engagement Metrics, and Support Tickets. The central Churn Risk Analysis indicates High Risk at 80%, highlighting factors like low activity, reduced logins, and declining usage. A user decline trend graph shows a decrease in active users over time, with a marked high churn zone. An alert section identifies an at-risk user, suggesting customized interventions and incentives. A male figure exits with a briefcase, symbolizing user churn.
Free with trial A comprehensive set of vector line icons depicting bull and bear market trends. This collection features various combinations of bull and bear silhouettes integrated with financial charts, including rising and falling line graphs and bar graphs. Each icon clearly symbolizes either a bullish market (growth, upward trend) or a bearish market (decline, downward trend). Ideal for financial websites, trading applications, investment presentations, economic reports, infographics, and educational materials illustrating stock market dynamics and investment strategies. Decrease charts vectors Bull and Bear Market Stock Trading Line Icons Set. A comprehensive set of vector line icons depicting bull and bear market trends. This collection features. A comprehensive set of vector line icons depicting bull and bear market trends. This collection features various combinations of bull and bear silhouettes integrated with financial charts, including rising and falling line graphs and bar graphs. Each icon clearly symbolizes either a bullish market (growth, upward trend) or a bearish market (decline, downward trend). Ideal for financial websites, trading applications, investment presentations, economic reports, infographics, and educational materials illustrating stock market dynamics and investment strategies.
Free with trial Stock exchange trading chart shows data trends and movements over time. A chart displays stock exchange trading data with. Decrease charts illustrations Stock exchange trading chart shows data trends and movements over time. A chart displays stock exchange trading data with
Free with trial Sales analysis. Sales with charts highlighting performance and revenue decline. Sales data optimization for retail strategies, e-commerce insights, and business reports. Decrease charts vectors Data Analytics and Sales Decline Concept with Graphs and Marketing Visuals on Screen. Sales analysis. Sales with charts highlighting performance and revenue. Sales analysis. Sales with charts highlighting performance and revenue decline. Sales data optimization for retail strategies, e-commerce insights, and business reports
Free with trial Business Icons Set isolated on black background. Simple vector logo. Decrease charts vectors Business Icons Set isolated on black background. Simple vector logo
Free with trial Carbon dioxide cloud icons and growth charts for environmental landing page banner. Sustainability, global warming, ecology, climate change, data analysis, emission control. Greenhouse gas symbols. Decrease charts vectors CO2 Emission Reduction and Climate Change Data Analysis Vector Illustration Set. Carbon dioxide cloud icons and growth charts for environmental landing page. Carbon dioxide cloud icons and growth charts for environmental landing page banner. Sustainability, global warming, ecology, climate change, data analysis, emission control. Greenhouse gas symbols
Free with trial Colorful vector icons showing graphs charts arrows lightbulb target briefcase for analytics strategy and success. Decrease charts illustrations Illustrated Business Data Analysis and Growth Concepts. Colorful vector icons showing graphs charts arrows lightbulb target briefcase for analytics strategy and. Colorful vector icons showing graphs charts arrows lightbulb target briefcase for analytics strategy and success
 Sign in