Free with trial A striking 3D rendering of a red downward-pointing arrow dramatically positioned over detailed financial charts Illustrates concepts of market downturn economic crisis recession and financial loss Perfect for illustrating articles or presentations relating to financial markets. Decrease charts illustrations Red Down Arrow Over Financial Charts Showing Market Decline Recession Crisis Concept AI generated. A striking 3D rendering of a red downward-pointing arrow. A striking 3D rendering of a red downward-pointing arrow dramatically positioned over detailed financial charts Illustrates concepts of market downturn economic crisis recession and financial loss Perfect for illustrating articles or presentations relating to financial markets
Free with trial 3D rendering of various financial charts and graphs in red and pink tones on a white background. Concept of business analytics. Decrease charts illustrations 3D Rendering of financial charts and graphs on a white background. 3D Rendering. 3D rendering of various financial charts and graphs in red and pink tones on a. 3D rendering of various financial charts and graphs in red and pink tones on a white background. Concept of business analytics
Free with trial Data visualization dashboard with various charts and graphs, immersive wallpaper background Generative AI. Decrease charts illustrations Data visualization dashboard with various charts and graphs. Immersive wallpaper background Generative AI
Free with trial Man in a beige brown shirt and jeans holding a paper with charts and business reports, isolated white background. AI-generated. Decrease charts illustrations Close up of hands holding a paper sheet with colorful business charts and graphs. Man in a beige brown shirt and jeans holding a paper with charts and business. Man in a beige brown shirt and jeans holding a paper with charts and business reports, isolated white background. AI-generated
Free with trial Flat vector illustration showcasing business performance review with rising charts, arrows indicating growth and decline, person and approval tick mark on black background. Decrease charts vectors Business Performance Review with Charts, Arrows and Person on Black Background. Flat vector illustration showcasing business performance review with rising. Flat vector illustration showcasing business performance review with rising charts, arrows indicating growth and decline, person and approval tick mark on black background.
Free with trial A collection of hand drawn style business and finance icons featuring growth charts, stock market trends, money symbols, and economic indicators for web design. Decrease charts illustrations Set of financial and business growth icons with bar charts and stock market symbols in line style Vector. A collection of hand drawn style business and finance. A collection of hand drawn style business and finance icons featuring growth charts, stock market trends, money symbols, and economic indicators for web design
Free with trial Blue graphs and charts depicting financial analysis and market trends with. Fountain pen. Decrease charts illustrations Blue graphs and charts depicting financial analysis and market trends with. Fountain pen
Free with trial Set of icons illustrating data analysis and business analytics with various charts graphs and tools isolated on transparent background. Decrease charts vectors Collection of icons representing data analysis and business analytics with various charts graphs and tools. Set of icons illustrating data analysis and business. Set of icons illustrating data analysis and business analytics with various charts graphs and tools isolated on transparent background
Free with trial A striking 3D rendering depicts a red arrow dramatically falling over financial charts and graphs symbolizing a market downturn or economic decline Ideal for illustrating concepts of financial loss and economic crisis. Decrease charts illustrations Dramatic Red 3D Arrow Plunging Downward on Financial Charts and Graphs Showing Market Decline AI generated. A striking 3D rendering depicts a red arrow. A striking 3D rendering depicts a red arrow dramatically falling over financial charts and graphs symbolizing a market downturn or economic decline Ideal for illustrating concepts of financial loss and economic crisis
Free with trial Slices of burnt toast with downward arrow charts popping out of a modern toaster on a marble countertop, symbolizing economic. Decrease charts illustrations Slices of burnt toast with downward arrow charts popping out of a modern toaster on a marble countertop, symbolizing economic.
Free with trial A hopeful medical technology science displays weight loss and glucose level data charts showing healthcare progress with syringe. Decrease charts illustrations Hopeful medical technology science displays weight loss and glucose level data charts showing healthcare progress with syringe. A hopeful medical technology. A hopeful medical technology science displays weight loss and glucose level data charts showing healthcare progress with syringe
Free with trial Financial Capability Month Colorful graphs and charts representing financial data analysis on desk. Colorful graphs and charts representing financial data. Decrease charts illustrations Financial Capability Month Colorful graphs and charts representing financial data analysis on desk. Colorful graphs and charts representing financial data
Free with trial Online sales analysis laptop, charts, shopping cart, office, detailed background Generative AI. Decrease charts illustrations Online sales analysis laptop, charts, shopping cart, office. Detailed background Generative AI
Free with trial A striking image depicting a large red downward arrow dramatically positioned over financial charts This illustrates market downturn economic recession or financial crisis visually Ideal for articles and presentations concerning economic hardship. Decrease charts illustrations Dramatic Red Down Arrow on Financial Charts Showing Market Decline Recession and Economic Crisis AI generated. A striking image depicting a large red downward. A striking image depicting a large red downward arrow dramatically positioned over financial charts This illustrates market downturn economic recession or financial crisis visually Ideal for articles and presentations concerning economic hardship
Free with trial The image features various financial data visualizations, including declining bar charts, pie charts, and downward trend graphs, which collectively illustrate a decrease in financial performance metrics. These elements serve as effective tools for analyzing business statistics and presenting reports. The visuals are designed to convey a clear message about trends and losses in the economy. This composition is made with AI. Decrease charts vectors Declining Bar Charts Pie Chart and Downward Trend Graphs for Financial Data Analysis and Business Reports. The image features various financial data. The image features various financial data visualizations, including declining bar charts, pie charts, and downward trend graphs, which collectively illustrate a decrease in financial performance metrics. These elements serve as effective tools for analyzing business statistics and presenting reports. The visuals are designed to convey a clear message about trends and losses in the economy. This composition is made with AI.
Free with trial The image displays a sharp, downward-sloping red arrow with a jagged path, symbolizing a significant decline or drop in numerical values, performance, or trends. The arrow's bold color and sharp angles emphasize a strong negative movement, often used in financial charts, data analytics, or presentations to indicate a decrease or loss over time. The visual impact is strong and immediately conveys. Decrease charts illustrations A bold red downward trending arrow indicating a decline or decrease in values. The image displays a sharp, downward-sloping red arrow with a jagged path. The image displays a sharp, downward-sloping red arrow with a jagged path, symbolizing a significant decline or drop in numerical values, performance, or trends. The arrow's bold color and sharp angles emphasize a strong negative movement, often used in financial charts, data analytics, or presentations to indicate a decrease or loss over time. The visual impact is strong and immediately conveys
Free with trial Three dimensional blue arrows and plus sign representing growth, progress, increase, decrease, statistics, data analysis, business, finance, charts, and trends. Decrease charts vectors Three dimensional blue arrows and plus sign symbolizing growth progress increase decrease statistics data analysis. Three dimensional blue arrows and plus sign. Three dimensional blue arrows and plus sign representing growth, progress, increase, decrease, statistics, data analysis, business, finance, charts, and trends
Free with trial This 3D rendering showcases colorful bar graphs, pie charts, and a calculator, vividly illustrating concepts of business growth, financial success, and data analysis. The upward-trending arrow emphasizes positive progress. Decrease charts illustrations Colorful 3D Charts and Calculator Illustrating Business Growth and Financial Success. This 3D rendering showcases colorful bar graphs, pie charts, and a. This 3D rendering showcases colorful bar graphs, pie charts, and a calculator, vividly illustrating concepts of business growth, financial success, and data analysis. The upward-trending arrow emphasizes positive progress.
Free with trial A close-up view of a laptop screen showing a stock market crash with candlestick charts and financial data, highlighting market volatility and investment risks - generated AI. Decrease charts illustrations Stock market decline displayed on laptop with financial charts. A close-up view of a laptop screen showing a stock market crash with candlestick charts and. A close-up view of a laptop screen showing a stock market crash with candlestick charts and financial data, highlighting market volatility and investment risks - generated AI
Free with trial This vibrant image showcases a collection of colorful 3D charts and graphs, including bar graphs, pie charts, and a line graph, all illustrating positive growth. A calculator and pencil are included, emphasizing the analytical and planning aspects of business success. Perfect for illustrating finan. Decrease charts illustrations Colorful 3D Financial Charts and Graphs with Calculator for Business Growth Presentation. This vibrant image showcases a collection of colorful 3D charts and. This vibrant image showcases a collection of colorful 3D charts and graphs, including bar graphs, pie charts, and a line graph, all illustrating positive growth. A calculator and pencil are included, emphasizing the analytical and planning aspects of business success. Perfect for illustrating finan
Free with trial Sketch image artwork composite photo collage of budget finance savings bank decrease loss money arrow down young lady hold support coins. Decrease charts illustrations Sketch image artwork composite photo collage of budget finance savings bank decrease loss money arrow down young lady. Hold support coins
Free with trial Red arrow plunges downward, financial charts graphs blurred background. Sharp decline percentage market value. Crisis, economic downturn, recession, business losses falling market. Decrease charts illustrations Red arrow plunges downward, financial charts graphs blurred background. Sharp decline percentage market value. Crisis, economic. Downturn, recession, business
Free with trial Businessman analyzes financial data on digital tablet. Graphs, charts display performance, cost reduction. Modern business strategy project management concepts in focus. Data analysis. Decrease charts illustrations Businessman analyzes financial data on digital tablet. Graphs, charts display performance, cost reduction. Modern business. Strategy project management concepts. Businessman analyzes financial data on digital tablet. Graphs, charts display performance, cost reduction. Modern business strategy project management concepts in focus. Data analysis.
Free with trial Economy, balloons or man on graph for crisis, stock market investment or inflation on white background. Financial decrease, crash or trader on charts for price drop or crypto profit risk in studio. Decrease charts illustrations Economy, balloons or man on graph for crisis, stock market investment or inflation on white background. Financial. Decrease, crash or trader on charts for price. Economy, balloons or man on graph for crisis, stock market investment or inflation on white background. Financial decrease, crash or trader on charts for price drop or crypto profit risk in studio.
Free with trial Colorful data charts, graphs, and infographics on white background, illustrating business analytics, breathtaking wallpaper background Generative AI. Decrease charts illustrations Colorful data charts, graphs, and infographics on white background, illustrating business analytics. Breathtaking wallpaper background Generative AI
Free with trial Stacks of coins on financial charts symbolize economic recession, financial instability, small business struggles, budget cuts, and investment losses. Spacious empty area designed for product displays and advertisements. Perfect for banners, branding, and marketing visuals. . Generative AI. Decrease charts illustrations Economic Downturn Impact on Small Businesses Stacks of coins on financial charts symbolize economic recession financial. Stacks of coins on financial charts. Stacks of coins on financial charts symbolize economic recession, financial instability, small business struggles, budget cuts, and investment losses. Spacious empty area designed for product displays and advertisements. Perfect for banners, branding, and marketing visuals. . Generative AI
Free with trial Metallic percentage symbol resting atop financial charts. Evokes concepts of interest, discounts, growth, or decline. Great for business, finance, or sales themes. Decrease charts illustrations Metallic percentage symbol resting atop financial charts. Evokes concepts of interest, discounts, growth, or decline. Great for. Business, finance, or sales
Free with trial Statistic graph progress, financial profit growth, increase, and decrease line icons set. Infographic charts with arrows, circles, and bars thin black outline symbols vector illustration. Decrease charts vectors Statistic graph progress, financial profit growth, increase and decrease line icons set. Statistic graph progress, financial profit growth, increase, and. Statistic graph progress, financial profit growth, increase, and decrease line icons set. Infographic charts with arrows, circles, and bars thin black outline symbols vector illustration.
Free with trial Statistic graph progress, financial profit growth, increase and decrease line icons set. Infographic charts with arrow, circles and bars thin black and red outline symbols vector illustration. Decrease charts vectors Statistic graph progress, financial profit growth, increase and decrease line icons set. Infographic charts with arrow, circles and bars thin black and red
Free with trial A futuristic bear walking through a glowing urban cityscape with stock market data charts and graphs symbolizing a bearish financial market trend. Generative AI. Decrease charts illustrations A futuristic bear walking through a glowing urban cityscape with stock market data charts and graphs symbolizing a bearish. Financial market trend. Generative
Free with trial A snarling bear against a backdrop of falling stock market charts. A powerful visual metaphor for economic downturn and market. Volatility ,Generative AI. Decrease charts illustrations A snarling bear against a backdrop of falling stock market charts. A powerful visual metaphor for economic downturn and market. Volatility ,Generative AI
Free with trial Creative picture collage young smiling laughing girl human hands economy charts decrease inflation crisis earnings downfall. Decrease charts illustrations Creative picture collage young smiling laughing girl human hands economy charts decrease inflation crisis earnings. Downfall
Free with trial A person analyzing stock market charts with a pointer. Vector art design using ai tool. Decrease charts vectors Stock Market Illustration Charts. A person analyzing stock market charts with a pointer. Vector art design using ai tool. A person analyzing stock market charts with a pointer. Vector art design using ai tool.
Free with trial A sharp downward-pointing arrow, symbolizing decline, decrease, or negative trend. Ideal for financial charts, market downturns, and challenging situations. Represents reduction and negative performance, perfect for business analytics or economic reports, vector design Generative AI. Decrease charts vectors Downward Trend Arrow Financial Decline, vector design Generative AI. A sharp downward-pointing arrow, symbolizing decline, decrease, or negative trend. Ideal for. A sharp downward-pointing arrow, symbolizing decline, decrease, or negative trend. Ideal for financial charts, market downturns, and challenging situations. Represents reduction and negative performance, perfect for business analytics or economic reports, vector design Generative AI
Free with trial The image showcases a collection of vibrant charts and graphs presenting data visualizations on a dark background. Decrease charts illustrations Colorful Data Visualization Charts And Graphs Display. The image showcases a collection of vibrant charts and graphs presenting data visualizations on a dark. The image showcases a collection of vibrant charts and graphs presenting data visualizations on a dark background
Free with trial Dark Theme Data Analytics Dashboard Displays Various Charts. A dark-themed dashboard displaying various charts and graphs visualizing business data analytics. Decrease charts illustrations Dark Theme Data Analytics Dashboard Displays Various Charts. A dark-themed dashboard displaying various charts and graphs visualizing business data analytics
Free with trial Barrel oil with stock charts of oil price quotes. Generative AI. Decrease charts illustrations Barrel oil with stock charts of oil price quotes. Generative AI
Free with trial A businessperson looking at declining financial charts. During a recession. Decrease charts illustrations A businessperson looking at declining financial charts. During a recession
Free with trial This image shows a calculator next to colorful 3D bar charts and pie charts illustrating business growth and financial success. The vibrant colors and upward-trending graph create a visually appealing representation of positive financial results. Decrease charts illustrations Colorful Calculator and 3D Charts Showing Business Growth. This image shows a calculator next to colorful 3D bar charts and pie charts illustrating business. This image shows a calculator next to colorful 3D bar charts and pie charts illustrating business growth and financial success. The vibrant colors and upward-trending graph create a visually appealing representation of positive financial results.
Free with trial Detailed 3D rendering of colorful bar charts, pie charts, line graphs, and calculator showcasing financial data analysis and business growth. Decrease charts illustrations Colorful 3D Business Charts, Graphs, and Calculator for Financial Success. Detailed 3D rendering of colorful bar charts, pie charts, line graphs, and calculator. Detailed 3D rendering of colorful bar charts, pie charts, line graphs, and calculator showcasing financial data analysis and business growth.
Free with trial This 3D rendering shows vibrant bar and pie charts illustrating business growth, data analysis, and statistical visualization. Perfect for presentations, reports, or marketing materials. Decrease charts illustrations Colorful 3D Bar and Pie Charts Representing Business Growth and Data Analysis. This 3D rendering shows vibrant bar and pie charts illustrating business growth. This 3D rendering shows vibrant bar and pie charts illustrating business growth, data analysis, and statistical visualization. Perfect for presentations, reports, or marketing materials.
Free with trial Declining bar chart with downward trend line, showing decrease and financial loss. AI generated. Decrease charts vectors Declining bar chart with downward trend line, showing decrease and financial loss. AI generated
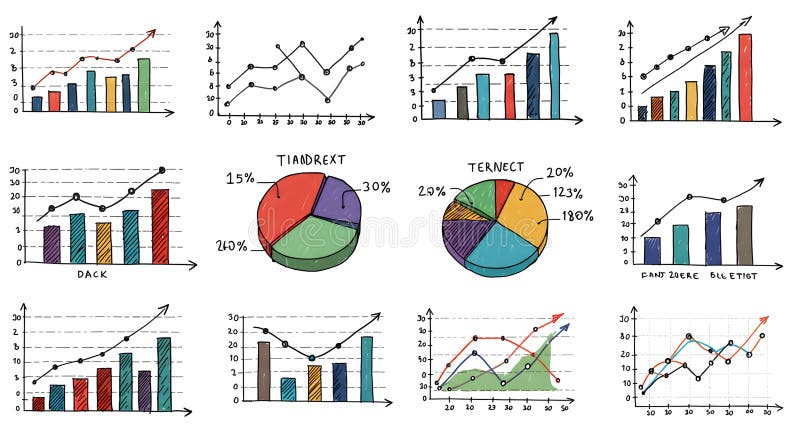
Free with trial A collection of hand-drawn style charts and diagrams that can be used to display data and analyze progress, ideal for business presentations, reports, or data visualizations. Decrease charts illustrations Hand-Drawn Collection of Statistical Charts and Diagrams for Business Analytics. A collection of hand-drawn style charts and diagrams that can be used to display. A collection of hand-drawn style charts and diagrams that can be used to display data and analyze progress, ideal for business presentations, reports, or data visualizations
Free with trial Square Format Infographic Poster Bold Typography Charts 1 Upscaled 4X clean composition. Featuring square, format, infographic. Neutral, commercial-friendly, with room for copy. Decrease charts illustrations Square Format Infographic Poster Bold Typography Charts 1 Upscaled 4X clean composition. Featuring square, format, infographic. Neutral, commercial-friendly
Free with trial A 3D rendered image of a businessman presenting financial data on a large screen, showing various charts and graphs. Decrease charts illustrations Businessman Presenting Financial Charts and Graphs. A 3D rendered image of a businessman presenting financial data on a large screen, showing various charts and. A 3D rendered image of a businessman presenting financial data on a large screen, showing various charts and graphs.
Free with trial Composite trend artwork sketch image collage of business trader arrow down lose money crisis charts down pile coins young lady sad sit. Decrease charts illustrations Composite trend artwork sketch image collage of business trader arrow down lose money crisis charts down pile coins. Young lady sad sit
Free with trial Vertical poster collage mature woman entrepreneur charts statistics hand body fragment pointing finger recession crisis loss. Decrease charts illustrations Vertical poster collage mature woman entrepreneur charts statistics hand body fragment pointing finger recession crisis. Loss
Free with trial Colorful data visualization with various charts and graphs. Visual representation of growth and performance metrics, breathtaking wallpaper background Generative AI. Decrease charts illustrations Colorful data visualization with various charts and graphs. Visual representation of growth and performance metrics. Breathtaking wallpaper background
Free with trial Infographic world map with charts, graphs, and data visualizations for business reports, presentations, and website content, vibrant background Generative AI. Decrease charts illustrations Infographic world map with charts, graphs, and data visualizations for business reports, presentations, and website content. Vibrant background Generative AI
Free with trial A wall display of framed blue data charts and graphs showing various financial trends and statistical information. A captivating fusion of imagination and modern design aesthetics. Generative AI. Decrease charts illustrations A wall display of framed blue data charts and graphs showing various financial trends and statistical information. Generative AI. A wall display of framed blue. A wall display of framed blue data charts and graphs showing various financial trends and statistical information. A captivating fusion of imagination and modern design aesthetics. Generative AI
Free with trial Tree illustration with bar graph displaying decrease in carbon emissions from wood pellets, Generated by AI. Decrease charts illustrations Tree illustration with bar graph displaying decrease in carbon emissions from wood pellets. Generated by AI
Free with trial Outline business icons featuring analytics, reports, charts, trends and performance management concepts. Decrease charts illustrations Business analytics line icons set with charts, reports and performance symbols. Outline business icons featuring analytics, reports, charts, trends and. Outline business icons featuring analytics, reports, charts, trends and performance management concepts
Free with trial A set of twenty-two black chart icons, illustrating various graph types on a white background. The icons feature line graphs, bar graphs, and pie charts, each depicting trends such as growth, decline, and fluctuations. Magnifying glass icons are used to represent analysis. The charts convey concepts of data visualization, statistical analysis, and business metrics tracking. The minimalistic design is characterized by simple, clean lines and solid fill, suitable for use in reports, presentations, or digital interfaces. Decrease charts vectors Increase and decrease glyph solid icons collection. A set of twenty-two black chart icons, illustrating various graph types on a white background. The icons. A set of twenty-two black chart icons, illustrating various graph types on a white background. The icons feature line graphs, bar graphs, and pie charts, each depicting trends such as growth, decline, and fluctuations. Magnifying glass icons are used to represent analysis. The charts convey concepts of data visualization, statistical analysis, and business metrics tracking. The minimalistic design is characterized by simple, clean lines and solid fill, suitable for use in reports, presentations, or digital interfaces.
Free with trial This striking graphic illustrates a significant economic downturn or market crash with a bold red arrow plunging downwards. Rendered by Ai, the image uses simple colors to maximize impact setting the alarming decline against subtle background charts. It effectively communicates concepts of loss decrease and a strong negative trend in business metrics. Decrease charts illustrations Red arrow showing sharp financial market decline. This striking graphic illustrates a significant economic downturn or market crash with a bold red arrow. This striking graphic illustrates a significant economic downturn or market crash with a bold red arrow plunging downwards. Rendered by Ai, the image uses simple colors to maximize impact setting the alarming decline against subtle background charts. It effectively communicates concepts of loss decrease and a strong negative trend in business metrics
Free with trial Icon set depicting financial growth and decline with upward and downward arrows over bar charts, perfect for business analytics and presentations. Decrease charts vectors Bar charts with curved arrows showing trends. Icon set depicting financial growth and decline with upward and downward arrows over bar charts, perfect for. Icon set depicting financial growth and decline with upward and downward arrows over bar charts, perfect for business analytics and presentations
Free with trial Unsuccessful investments cause negative emotions in woman standing among declining charts. Girl had bad luck and lost income or investments due to crisis and lack of financial analysis. Decrease charts vectors Unsuccessful investments cause negative emotions in woman standing among declining charts. Girl had bad luck and lost income or investments due to crisis and
Free with trial Business growth icons set with charts and graphs. Collection of black and white business and finance icons including charts, graphs, and analytics for reports. Decrease charts vectors Business growth icons set with charts and graphs. Collection of black and white business and finance icons including charts, graphs, and analytics for reports
Free with trial Price increase or decrease concept with wooden blocks and arrows. A hand points to the price cubes, with up and down arrows indicating change in value. Decrease charts illustrations Price increase or decrease concept with wooden blocks and arrows. A hand points to the price cubes, with up and down arrows indicating change in value
Free with trial Conceptual 3D illustration of a global economic recession and financial crisis. Features dramatic falling red candlestick charts, sharp downward arrows, and trend lines over a digital world map background, symbolizing stock market crash, inflation, economic downturn, and bearish market panic. Decrease charts illustrations Global financial crisis background with falling red stock market charts, downward arrows and world map. Conceptual 3D illustration of a global economic. Conceptual 3D illustration of a global economic recession and financial crisis. Features dramatic falling red candlestick charts, sharp downward arrows, and trend lines over a digital world map background, symbolizing stock market crash, inflation, economic downturn, and bearish market panic.
Free with trial A professional businessman analyzes private equity portfolio management data on a large screen, evaluating ebitda growth, revenue increase, and cost optimization charts while taking notes. Decrease charts vectors Man Analyzing Financial Charts for Private Equity Portfolio. A professional businessman analyzes private equity portfolio management data on a large screen. A professional businessman analyzes private equity portfolio management data on a large screen, evaluating ebitda growth, revenue increase, and cost optimization charts while taking notes
Free with trial A simple red curved arrow graphic pointing downwards, commonly used to represent financial loss, declining trends, or market drops in business charts. Decrease charts vectors Red curved arrow pointing down indicating a decrease or decline. A simple red curved arrow graphic pointing downwards, commonly used to represent financial loss. A simple red curved arrow graphic pointing downwards, commonly used to represent financial loss, declining trends, or market drops in business charts
Free with trial Simple hand-drawn black up and down arrows doodle isolated on white. Perfect for minimalist UI/UX design, finance charts, trade trends, navigation icons, and creative graphic elements. Decrease charts illustrations Simple Black Outline Directional Arrows, Cute Bold Sketch Symbols. Simple hand-drawn black up and down arrows doodle isolated on white. Perfect for minimalist UI. Simple hand-drawn black up and down arrows doodle isolated on white. Perfect for minimalist UI/UX design, finance charts, trade trends, navigation icons, and creative graphic elements.
Free with trial This image presents a clean, minimalist graphic illustrating economic trends. It features two distinct charts: a line graph on the left showing fluctuating data points over time, and a bar chart on the right comparing values across categories. The charts use a simple black and white color scheme with grayscale elements, making them versatile for various business and financial contexts. Labels like 'ECONOMIC', 'PARCTIRUM', and 'PLACTIRUM' suggest analysis of economic performance and market data. The overall design emphasizes clarity and data visualization. Decrease charts vectors Economic Growth Trends: Line and Bar Charts. This image presents a clean, minimalist graphic illustrating economic trends. It features two distinct charts: a. This image presents a clean, minimalist graphic illustrating economic trends. It features two distinct charts: a line graph on the left showing fluctuating data points over time, and a bar chart on the right comparing values across categories. The charts use a simple black and white color scheme with grayscale elements, making them versatile for various business and financial contexts. Labels like 'ECONOMIC', 'PARCTIRUM', and 'PLACTIRUM' suggest analysis of economic performance and market data. The overall design emphasizes clarity and data visualization.
Free with trial Growth and decline bar charts icon set in outline style. It represents financial analysis, business performance, profit increase, and market loss. Useful for investors and analysts in economic reporting and presentation materials. Decrease charts vectors Growth And Decline Bar Charts Icon Set For Financial Analysis And Business Performance Tracking. Growth and decline bar charts icon set in outline style. It. Growth and decline bar charts icon set in outline style. It represents financial analysis, business performance, profit increase, and market loss. Useful for investors and analysts in economic reporting and presentation materials
Free with trial Set of business infographic banners rising bar charts and light bulb icons for web landing pages. Strategy, development, success, failure, innovation, analytics, performance. Growth and decrease. Decrease charts illustrations Business Growth and Decline Infographic Set with Light Bulb Icons for Landing Page Banners. Set of business infographic banners rising bar charts and light bulb. Set of business infographic banners rising bar charts and light bulb icons for web landing pages. Strategy, development, success, failure, innovation, analytics, performance. Growth and decrease
Free with trial Graph and Charts Line Icon Set, Data Analytics Finance Vector Collection with Transparent Background. Data visualization and financial symbols representing graphs, charts, statistics, analytics, business performance, market trends, reports, and financial data. Suitable for websites, mobile apps, dashboards, presentations, infographics, financial reports, business analysis, and data-related design projects. Decrease charts illustrations Graph Charts Line Icon Set, Data Analytics Finance Vector Transparent Background. Graph and Charts Line Icon Set, Data Analytics Finance Vector Collection with. Graph and Charts Line Icon Set, Data Analytics Finance Vector Collection with Transparent Background. Data visualization and financial symbols representing graphs, charts, statistics, analytics, business performance, market trends, reports, and financial data. Suitable for websites, mobile apps, dashboards, presentations, infographics, financial reports, business analysis, and data-related design projects.
Free with trial A vibrant collection of flat design charts, including a bar graph and two pie charts, presented together to visualize data and trends effectively on a clean white background. Decrease charts vectors Illustration of colorful bar and pie charts isolated on white background. A vibrant collection of flat design charts, including a bar graph and two pie charts. A vibrant collection of flat design charts, including a bar graph and two pie charts, presented together to visualize data and trends effectively on a clean white background
Free with trial The composition presents a moment where financial troubles, displayed by falling charts and tech screens, appear over a new city scene. Decrease charts illustrations Financial troubles, shown by falling charts and tech screens, appear over a new city scene. The composition presents a moment where financial troubles, displayed. The composition presents a moment where financial troubles, displayed by falling charts and tech screens, appear over a new city scene
Free with trial The scene is structured around a view in which financial troubles, displayed by falling charts and tech screens, appear over a new city scene. Decrease charts illustrations Financial troubles, shown by falling charts and tech screens, appear over a new city scene. The scene is structured around a view in which financial troubles. The scene is structured around a view in which financial troubles, displayed by falling charts and tech screens, appear over a new city scene
Free with trial The visual focuses on a scene in which financial troubles, displayed by falling charts and tech screens, appear over a new city scene. Decrease charts illustrations Financial troubles, shown by falling charts and tech screens, appear over a new city scene. The visual focuses on a scene in which financial troubles, displayed. The visual focuses on a scene in which financial troubles, displayed by falling charts and tech screens, appear over a new city scene
Free with trial Tax blocks with percentage symbol and up and down arrows on financial charts, concept of tax rate changes and fiscal policy featuring taxes, taxation, percent with VAT and government elements for. Decrease charts illustrations Tax blocks with percentage symbol and up and down arrows on financial charts,. Concept of tax rate changes and fiscal policy featuring taxes, taxation, percent. Tax blocks with percentage symbol and up and down arrows on financial charts, concept of tax rate changes and fiscal policy featuring taxes, taxation, percent with VAT and government elements for
Free with trial Climate change, sustainability, eco-friendly practices, carbon footprint, energy efficiency, environmental awareness. Man pointing at charts and graphs. Environmental awareness and sustainability. Decrease charts vectors Environmental Data Analysis with Focus on Carbon Footprint, Emission Reduction, and Home Energy Efficiency. Climate change, sustainability, eco-friendly. Climate change, sustainability, eco-friendly practices, carbon footprint, energy efficiency, environmental awareness. Man pointing at charts and graphs. Environmental awareness and sustainability
Free with trial Financial newspaper showing stock market crash. With charts and numbers, concept of financial crisis. Decrease charts illustrations Financial newspaper showing stock market crash. With charts and numbers, concept of financial crisis
Free with trial Arrow curving downward with rough striped texture and tapered point, hand drawn and bold. Symbol of decline, drop, decrease, downturn, and direction for charts. Cartoon vector illustration. Decrease charts vectors Arrow Bending Down Hand Drawn. Arrow curving downward with rough striped texture and tapered point, hand drawn and bold. Symbol of decline, drop, decrease. Arrow curving downward with rough striped texture and tapered point, hand drawn and bold. Symbol of decline, drop, decrease, downturn, and direction for charts. Cartoon vector illustration.
Free with trial Sales performance, data analysis, business strategy, financial downturn, decision making, marketing insights. Arrow pointing down with sale text, charts check mark. Sales performance and data. Decrease charts vectors Sales Analytics and Performance Metrics with Downward Trends and Checkmark. Sales performance, data analysis, business strategy, financial downturn, decision. Sales performance, data analysis, business strategy, financial downturn, decision making, marketing insights. Arrow pointing down with sale text, charts check mark. Sales performance and data
Free with trial A modern flat design concept illustrating business analytics and sales performance. The scene features a laptop and smartphone displaying a dashboard with various charts, graphs, and statistics for a Q3 report. A world map with a magnifying glass signifies global market analysis and regional breakdown. Additional elements like a checklist and growth decrease icons represent strategic planning, auditing, and financial review. This versatile vector illustration is perfect for presentations, marketing materials, and web design related to finance, data visualization, and business intelligence. Decrease charts illustrations Business Analytics and Sales Performance Report Dashboard. A modern flat design concept illustrating business analytics and sales performance. The scene features. A modern flat design concept illustrating business analytics and sales performance. The scene features a laptop and smartphone displaying a dashboard with various charts, graphs, and statistics for a Q3 report. A world map with a magnifying glass signifies global market analysis and regional breakdown. Additional elements like a checklist and growth decrease icons represent strategic planning, auditing, and financial review. This versatile vector illustration is perfect for presentations, marketing materials, and web design related to finance, data visualization, and business intelligence.
Free with trial A collection of eight thin-line related to finance and business. The depict a stack of coins with a dollar sign, a document with a dollar sign, an upward trending graph over city buildings, and a bar chart with a plus sign. The bottom row coins and currency symbols, a calculator with a dollar sign, a document with a calculator and charts, and a person. Decrease charts illustrations Financial set with charts and calculator finance business. A collection of eight thin-line related to finance and business. The depict a stack of coins with a. A collection of eight thin-line related to finance and business. The depict a stack of coins with a dollar sign, a document with a dollar sign, an upward trending graph over city buildings, and a bar chart with a plus sign. The bottom row coins and currency symbols, a calculator with a dollar sign, a document with a calculator and charts, and a person
Free with trial Graphic features stylized oil barrel, pump jack, and pipeline alongside stock market indices including S&P 500 and Dow Jones. Detailed candlestick charts and volatility metrics illustrate energy market dynamics, supply demand trends, and global economic indicators. Decrease charts illustrations Oil market dynamics illustrated with graphs and price per barrel updates. Graphic features stylized oil barrel, pump jack, and pipeline alongside stock market. Graphic features stylized oil barrel, pump jack, and pipeline alongside stock market indices including S&P 500 and Dow Jones. Detailed candlestick charts and volatility metrics illustrate energy market dynamics, supply demand trends, and global economic indicators
Free with trial A digital illustration of stock market data visualization, featuring green and red arrows on a dark background. The image includes various charts and graphs, with numbers and symbols indicating market trends. The green arrows point upwards, suggesting growth and increase, while the red arrows point downwards, indicating decline and decrease. This image can be used to represent financial analysis, market fluctuations, and economic trends. Decrease charts illustrations Stock market data visualization with green and red arrows. A digital illustration of stock market data visualization, featuring green and red arrows on a dark. A digital illustration of stock market data visualization, featuring green and red arrows on a dark background. The image includes various charts and graphs, with numbers and symbols indicating market trends. The green arrows point upwards, suggesting growth and increase, while the red arrows point downwards, indicating decline and decrease. This image can be used to represent financial analysis, market fluctuations, and economic trends.
Free with trial This image features a collection of various black and white icons representing statistical graphics and charts. The icons include bar graphs, line graphs, and pie charts. The central image is a composite of a bar graph with an upward trending line graph and a pie chart. Surrounding this central image are smaller icons of similar graphs and charts. Decrease charts illustrations Collection of black and white statistical graphics and charts. This image features a collection of various black and white icons representing statistical. This image features a collection of various black and white icons representing statistical graphics and charts. The icons include bar graphs, line graphs, and pie charts. The central image is a composite of a bar graph with an upward trending line graph and a pie chart. Surrounding this central image are smaller icons of similar graphs and charts
 Sign in