Free with trial A clear vector illustration of a red downward trending line graph, symbolizing a decrease, decline, or negative performance. This icon is essential for financial reports, business presentations, data visualization, or any context indicating a reduction. Its simple, sharp design effectively communicates a downward trend in various metrics, vector design Generative AI. Decrease charts vectors Red Downward Trending Graph Line Icon, vector design Generative AI. A clear vector illustration of a red downward trending line graph, symbolizing a decrease. A clear vector illustration of a red downward trending line graph, symbolizing a decrease, decline, or negative performance. This icon is essential for financial reports, business presentations, data visualization, or any context indicating a reduction. Its simple, sharp design effectively communicates a downward trend in various metrics, vector design Generative AI
Free with trial A sharp vector illustration of a red downward-pointing arrow, symbolizing financial decline, losses, or a negative market trend. This impactful graphic is ideal for economic reports, business presentations, or any visual conveying a decrease in value or performance. vector design Generative AI. Decrease charts vectors Red Downward Arrow Financial Decline, vector design Generative AI. A sharp vector illustration of a red downward-pointing arrow, symbolizing financial decline. A sharp vector illustration of a red downward-pointing arrow, symbolizing financial decline, losses, or a negative market trend. This impactful graphic is ideal for economic reports, business presentations, or any visual conveying a decrease in value or performance. vector design Generative AI
Free with trial Business Meeting on Real Estate Market Analysis with Charts, Graphs, and Digital House Icon Showing Trends in Property Value Changes Sigmoid. Decrease charts illustrations Professionals discuss real estate market trends using data and analytics. A digital house icon symbolizes value changes. Business Meeting on Real Estate Market. Business Meeting on Real Estate Market Analysis with Charts, Graphs, and Digital House Icon Showing Trends in Property Value Changes Sigmoid
Free with trial A set of twelve diverse and versatile vector icons depicting various types of charts commonly used in business and data analysis. These include line graphs showing upward and fluctuating trends, bar charts illustrating data comparisons, and pie charts representing proportions. Ideal for presentations, reports, websites, and infographics related to finance, marketing, and statistics. Decrease charts vectors Collection of Line and Bar Charts & Pie Charts - Business Data Visualization Icons. A set of twelve diverse and versatile vector icons depicting various types of. A set of twelve diverse and versatile vector icons depicting various types of charts commonly used in business and data analysis. These include line graphs showing upward and fluctuating trends, bar charts illustrating data comparisons, and pie charts representing proportions. Ideal for presentations, reports, websites, and infographics related to finance, marketing, and statistics.
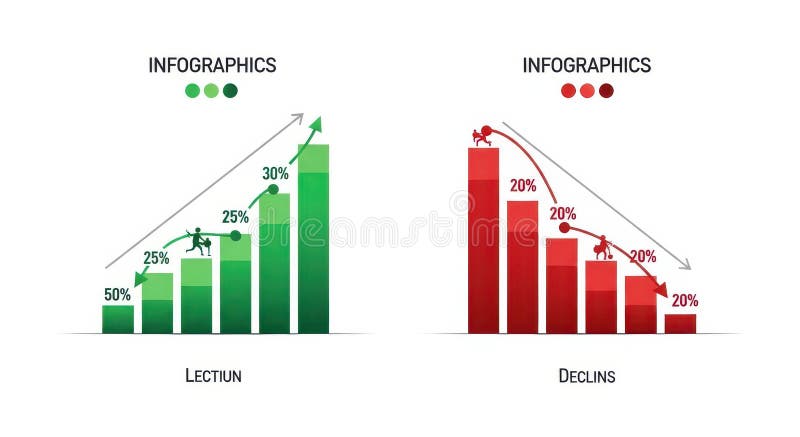
Free with trial The image displays two infographics side by side. the left infographic, titled "lection," depicts a green bar graph showing growth, starting at 50% and increasing to 30% with a figure climbing the bars. an upward-pointing arrow indicates positive growth. the right infographic, titled "declins," shows a red bar graph illustrating decline, starting at 20% and decreasing to 20% with a figure falling down the bars. a downward-pointing arrow indicates negative growth. Decrease charts illustrations Infographics showing growth and decline charts. The image displays two infographics side by side. the left infographic, titled 'lection,' depicts a green bar. the image displays two infographics side by side. the left infographic, titled "lection," depicts a green bar graph showing growth, starting at 50% and increasing to 30% with a figure climbing the bars. an upward-pointing arrow indicates positive growth. the right infographic, titled "declins," shows a red bar graph illustrating decline, starting at 20% and decreasing to 20% with a figure falling down the bars. a downward-pointing arrow indicates negative growth.
Free with trial Gold coins submerged in water within a glass bowl, placed on top of business charts, suggesting financial risk and investment uncertainty. Decrease charts illustrations Financial risk: Gold coins submerged in water within a glass bowl on top of business charts. Gold coins submerged in water within a glass bowl, placed on top of. Gold coins submerged in water within a glass bowl, placed on top of business charts, suggesting financial risk and investment uncertainty
Free with trial A 3D golden house model on a digital tablet with colorful graphs and charts in the background,. Decrease charts illustrations A 3D golden house model on a digital tablet with colorful graphs and charts in the background.
Free with trial Modern graphic business charts set featuring financial growth and decline for data visualization. AI generated. Decrease charts vectors Modern graphic business charts set featuring financial growth and decline for data visualization. AI generated
Free with trial The image displays a grid of twelve different statistical graphs and charts, each representing various data trends and distributions. The graphs include line charts, bar charts, and area charts, each showcasing unique data patterns. Some graphs show fluctuating data points, while others illustrate steady increases or decreases. The bar charts present different frequencies and distributions. Decrease charts illustrations Collection of various statistical graphs and charts illustrating data trends and distributions. The image displays a grid of twelve different statistical graphs. The image displays a grid of twelve different statistical graphs and charts, each representing various data trends and distributions. The graphs include line charts, bar charts, and area charts, each showcasing unique data patterns. Some graphs show fluctuating data points, while others illustrate steady increases or decreases. The bar charts present different frequencies and distributions.
Free with trial Two sets of simple flat design charts showing bar graphs with line graphs and three-segment pie charts in red, green, and blue. Decrease charts vectors Two bar charts with line graphs and two pie charts data visualization statistics. Two sets of simple flat design charts showing bar graphs with line graphs and. Two sets of simple flat design charts showing bar graphs with line graphs and three-segment pie charts in red, green, and blue
Free with trial Falling trend sketch of business finance graph with bar charts and arrow. AI generated. Decrease charts illustrations Falling trend sketch of business finance graph with bar charts and arrow. AI generated
Free with trial Colorful Charts and Graphs Data Visualization Infographic. Ai Generated. Decrease charts illustrations Colorful Charts and Graphs Data Visualization Infographic. Ai Generated
Free with trial A collection of monochrome icons representing various business and financial elements such as currency, people, documents, charts, and computer screens, all isolated on a clean white background. Decrease charts vectors Set of business and finance icons including money, people, charts, and documents. A collection of monochrome icons representing various business and financial. A collection of monochrome icons representing various business and financial elements such as currency, people, documents, charts, and computer screens, all isolated on a clean white background
Free with trial Featuring "LOW PRICE" text on a lightbox overlaid with downward candlestick charts and percentage performance data. Decrease charts illustrations Low price trends and market entry opportunities reflected through real-time financial metrics and volatile trading indicators. Featuring 'LOW PRICE' text on a. Featuring "LOW PRICE" text on a lightbox overlaid with downward candlestick charts and percentage performance data.
Free with trial Charts and Diagrams line icons. Interest rate, AI generate, Inflation icons. Report, 3D Chart, Block diagram and Dot Plot graph linear icons. Trend, Pyramid and Pie chart report symbols. Vector. Decrease charts vectors Charts and Diagrams line icons. Set of 3D Chart, Block diagram and Dot Plot graph icons. App line icons. Vector. Charts and Diagrams line icons. Interest rate. Charts and Diagrams line icons. Interest rate, AI generate, Inflation icons. Report, 3D Chart, Block diagram and Dot Plot graph linear icons. Trend, Pyramid and Pie chart report symbols. Vector
Free with trial Combining love growth and decline charts, symbolizing relationship ups and downs. Perfect for dating, counseling, and emotional data visualization projects. Decrease charts vectors Combining love growth and decline charts, symbolizing relationship ups and downs. Perfect for dating, counseling, and emotional. Data visualization projects
Free with trial A vibrant collection of hand-drawn business charts and graphs, rendered in shades of blue with a sketch-like aesthetic. The set includes various types of visualizations like bar charts, line graphs, pie charts, and donut charts, representing data, growth, and analysis. This versatile illustration is perfect for presentations, reports, infographics, and any project requiring a visual representation of financial or statistical information with a creative, hand-crafted feel. Decrease charts illustrations Hand-Drawn Business Charts and Graphs Collection. A vibrant collection of hand-drawn business charts and graphs, rendered in shades of blue with a sketch-like. A vibrant collection of hand-drawn business charts and graphs, rendered in shades of blue with a sketch-like aesthetic. The set includes various types of visualizations like bar charts, line graphs, pie charts, and donut charts, representing data, growth, and analysis. This versatile illustration is perfect for presentations, reports, infographics, and any project requiring a visual representation of financial or statistical information with a creative, hand-crafted feel.
Free with trial A futuristic visualization depicts data analysis, charts, and graphs within a digital, high-tech environment. Decrease charts illustrations Complex data analysis illustrated within an abstract futuristic environment. A futuristic visualization depicts data analysis, charts, and graphs within a. A futuristic visualization depicts data analysis, charts, and graphs within a digital, high-tech environment
Free with trial Business Growth Speed Concept. Hand drawn charts and clock showing business growth and speed AI generated. Decrease charts illustrations Business Growth Speed Concept. Hand drawn charts and clock showing business growth and speed AI generated
Free with trial Stacks of coins rise against a backdrop of financial charts and a blurred global map, illustrating financial growth and global investment. This image, generated by AI, depicts the complex interplay between monetary value and market trends, suggesting success and potential. Decrease charts illustrations AI-Generated Financial Growth Visualization. Stacks of coins rise against a backdrop of financial charts and a blurred global map, illustrating financial growth. Stacks of coins rise against a backdrop of financial charts and a blurred global map, illustrating financial growth and global investment. This image, generated by AI, depicts the complex interplay between monetary value and market trends, suggesting success and potential.
Free with trial A set of hand drawn black and white graphs and charts for business analysis. Decrease charts illustrations A collection of six hand drawn graphs and charts in black and white .ai generate. A set of hand drawn black and white graphs and charts for business analysis. a set of hand drawn black and white graphs and charts for business analysis.
Free with trial A close-up image of a red arrow pointing downwards on a financial report The charts and graphs in the background subtly suggest a negative trend illustrating concepts of market decline business loss or economic crisis The red arrow is prominent emphasizing the severity of the downturn. Decrease charts illustrations Red Down Arrow on Financial Report Showing Market Decline Business Loss Economic Crisis AI generated. A close-up image of a red arrow pointing downwards on a. A close-up image of a red arrow pointing downwards on a financial report The charts and graphs in the background subtly suggest a negative trend illustrating concepts of market decline business loss or economic crisis The red arrow is prominent emphasizing the severity of the downturn
Free with trial This image was created using Generative AI. A red zigzag arrow pointing downwards on a clean white background. This graphic symbol represents a decrease, loss, or drop. Ideal for financial charts, business reports, and data visualization showing negative trends. Decrease charts vectors Red Downward Arrow Symbolizing Decline on White. This image was created using Generative AI. A red zigzag arrow pointing downwards on a clean white background. This image was created using Generative AI. A red zigzag arrow pointing downwards on a clean white background. This graphic symbol represents a decrease, loss, or drop. Ideal for financial charts, business reports, and data visualization showing negative trends
Free with trial This image features a collection of vibrant watercolor-style icons representing various business and organizational concepts. The icons include bar charts, pie charts, line graphs, organizational charts, flow diagrams, financial symbols, and growth metaphors. Each icon is designed with a soft, artistic watercolor effect, making them visually appealing and versatile for presentations, educational materials, business reports, infographics, and digital content. These icons can be used in professional settings to illustrate data, processes, financial concepts, and organizational structures in a creative and engaging manner. Decrease charts illustrations Watercolor Business and Organizational Icons Set. This image features a collection of vibrant watercolor-style icons representing various business and. This image features a collection of vibrant watercolor-style icons representing various business and organizational concepts. The icons include bar charts, pie charts, line graphs, organizational charts, flow diagrams, financial symbols, and growth metaphors. Each icon is designed with a soft, artistic watercolor effect, making them visually appealing and versatile for presentations, educational materials, business reports, infographics, and digital content. These icons can be used in professional settings to illustrate data, processes, financial concepts, and organizational structures in a creative and engaging manner.
Free with trial A comprehensive collection of flat icons illustrating various data visualization concepts, including bar charts, line graphs, area charts, scatter plots, and distribution curves. The set features directional arrows symbolizing growth, trends, and strategic planning. Designed with a clean, modern aesthetic using a palette of blue, green, yellow, and orange, these icons are ideal for business presentations, financial reports, infographics, dashboards, and corporate branding materials. Decrease charts vectors Flat Icon Set of Business Charts and Growth Arrows. A comprehensive collection of flat icons illustrating various data visualization concepts, including bar. A comprehensive collection of flat icons illustrating various data visualization concepts, including bar charts, line graphs, area charts, scatter plots, and distribution curves. The set features directional arrows symbolizing growth, trends, and strategic planning. Designed with a clean, modern aesthetic using a palette of blue, green, yellow, and orange, these icons are ideal for business presentations, financial reports, infographics, dashboards, and corporate branding materials.
Free with trial A collage of colorful flat-style financial charts and graphs featuring red, blue and orange upward and downward arrows, line graphs and bar charts. Central icons include a house, gas pump and coins symbolizing housing, fuel and money trends. Modern business infographic set illustrating market growth, inflation, investment performance and economic forecasting. Ideal for finance presentations, economic reports, business articles, marketing materials and educational content about stock markets. Decrease charts vectors Collection of Financial Growth Charts and Graphs. A collage of colorful flat-style financial charts and graphs featuring red, blue and orange upward and downward. A collage of colorful flat-style financial charts and graphs featuring red, blue and orange upward and downward arrows, line graphs and bar charts. Central icons include a house, gas pump and coins symbolizing housing, fuel and money trends. Modern business infographic set illustrating market growth, inflation, investment performance and economic forecasting. Ideal for finance presentations, economic reports, business articles, marketing materials and educational content about stock markets.
Free with trial Cost versus quality optimization concept with business professional analyzing charts by increasing quality while reducing cost representing efficiency, performance improvement, cost management. Decrease charts illustrations Cost versus quality optimization concept with business professional analyzing charts by increasing quality while reducing cost. Representing efficiency. Cost versus quality optimization concept with business professional analyzing charts by increasing quality while reducing cost representing efficiency, performance improvement, cost management.
Free with trial This image shows colorful financial charts and graphs, generated by AI, illustrating various data points and percentages. The overlaid arrows suggest a downward trend, potentially indicating a negative market shift or economic decline. The visual representation aids in quick understanding of compl. Decrease charts illustrations Financial Data Analysis. This image shows colorful financial charts and graphs, generated by AI, illustrating various data points and percentages. The overlaid. This image shows colorful financial charts and graphs, generated by AI, illustrating various data points and percentages. The overlaid arrows suggest a downward trend, potentially indicating a negative market shift or economic decline. The visual representation aids in quick understanding of compl
Free with trial Collection of twenty-four colorful flat line oil and petroleum industry icons isolated on white background featuring barrels, pumpjack, rig, refinery, pipeline valve, tanker ship and truck, gas station pump, global maps, and financial charts showing price growth and decline. Perfect for illustrating energy market, crude trading, fuel costs, economy reports, business presentations, websites, and educational materials about fossil fuels. Decrease charts vectors Oil Industry Icons Set Including Barrels Charts. Collection of twenty-four colorful flat line oil and petroleum industry icons isolated on white background. Collection of twenty-four colorful flat line oil and petroleum industry icons isolated on white background featuring barrels, pumpjack, rig, refinery, pipeline valve, tanker ship and truck, gas station pump, global maps, and financial charts showing price growth and decline. Perfect for illustrating energy market, crude trading, fuel costs, economy reports, business presentations, websites, and educational materials about fossil fuels.
Free with trial Green bars and an upward arrow signify profit, contrasted by red bars and a downward arrow representing loss on a white background. Decrease charts illustrations Visual comparison of profit and loss using green ascending and red descending bar charts and arrows on a white. Green bars and an upward arrow signify profit. Green bars and an upward arrow signify profit, contrasted by red bars and a downward arrow representing loss on a white background
Free with trial Collection of thirty charts and graphs icons in line style. Decrease charts vectors Collection of thirty charts and graphs icons in line style. Collection of thirty charts and graphs icons in line
Free with trial Vector of a balance scale comparing income and expense for financial management concept. Left pan labeled income holds coins, cash, money bag with upward arrows and growth charts. Right pan labeled expense holds money bags, bills, coins, receipts with shopping cart and rising chart. Clean flat design on white background, ideal for budgeting, accounting, investment, economy articles, business presentations and personal finance education. Decrease charts vectors Income and Expense Balance Scale Financial Concept. Vector of a balance scale comparing income and expense for financial management concept. Left pan labeled. Vector of a balance scale comparing income and expense for financial management concept. Left pan labeled income holds coins, cash, money bag with upward arrows and growth charts. Right pan labeled expense holds money bags, bills, coins, receipts with shopping cart and rising chart. Clean flat design on white background, ideal for budgeting, accounting, investment, economy articles, business presentations and personal finance education.
Free with trial Sixteen simple yellow candlestick charts with black lines on a white background, arranged in a four by four grid. Decrease charts vectors Vector illustration of sixteen yellow candlestick charts. Sixteen simple yellow candlestick charts with black lines on a white background, arranged in a four by. Sixteen simple yellow candlestick charts with black lines on a white background, arranged in a four by four grid
Free with trial A set of nine minimalist vector icons depicting various types of charts and graphs including bar charts, progress bars, and trend lines for data visualization and analytics. Decrease charts vectors Collection of simple black glyph icons representing business charts graphs and data analysis. A set of nine minimalist vector icons depicting various types of. A set of nine minimalist vector icons depicting various types of charts and graphs including bar charts, progress bars, and trend lines for data visualization and analytics
Free with trial Set of six black business charts icons showing growth and decline trends with arrows and bars in vector style clear and simple design calm. Generative AI. Decrease charts vectors Business growth and decline charts arrows statistics bar graph icons vector illustration. Set of six black business charts icons showing growth and decline. Set of six black business charts icons showing growth and decline trends with arrows and bars in vector style clear and simple design calm. Generative AI
Free with trial This image was created using Generative AI. Red downward trending arrow on a white background symbolizes financial loss, market decline, or decrease in value. Ideal for business charts. Decrease charts vectors Red Downward Arrow Showing Decline and Loss Concept. This image was created using Generative AI. Red downward trending arrow on a white background symbolizes. This image was created using Generative AI. Red downward trending arrow on a white background symbolizes financial loss, market decline, or decrease in value. Ideal for business charts
Free with trial A collection of flat line finance and investment icons on white background featuring money bags, dollar signs, coins, banknotes, calculators, charts and percentage arrows in green orange and blue tones. Central large icon shows hand holding money bag with falling percent arrow. Perfect for banking, inflation, interest rates, profit loss, budgeting and economic concepts for websites, presentations, apps and infographics. Decrease charts vectors Financial Icons Set Money Growth Decrease Symbols. A collection of flat line finance and investment icons on white background featuring money bags, dollar signs. A collection of flat line finance and investment icons on white background featuring money bags, dollar signs, coins, banknotes, calculators, charts and percentage arrows in green orange and blue tones. Central large icon shows hand holding money bag with falling percent arrow. Perfect for banking, inflation, interest rates, profit loss, budgeting and economic concepts for websites, presentations, apps and infographics.
Free with trial Outline financial tax icons set featuring a book, magnifying glass, money, documents, and charts for financial. Accounting and business concept design. AI. Decrease charts illustrations Outline financial tax icons set featuring a book, magnifying glass, money, documents, and charts for financial. Accounting and business concept design. AI
Free with trial A set of 12 icons representing various business and productivity concepts including graphs gears briefcases and charts in a flat. Decrease charts vectors Business productivity icons collection of and vector. A set of 12 icons representing various business and productivity concepts including graphs gears briefcases. a set of 12 icons representing various business and productivity concepts including graphs gears briefcases and charts in a flat
Free with trial Charts and Diagrams line icons. Social media: share, comment, like icons. Report, Block diagram, 3D Chart and Dot Plot graph linear icons. Trend, Pyramid and Pie chart report symbols. Vector. Decrease charts illustrations Charts and Diagrams line icons. Set of 3D Chart, Block diagram and Dot Plot graph icons. Social media icons. Vector. Charts and Diagrams line icons. Social media. Charts and Diagrams line icons. Social media: share, comment, like icons. Report, Block diagram, 3D Chart and Dot Plot graph linear icons. Trend, Pyramid and Pie chart report symbols. Vector
Free with trial A collection of eight black silhouette representing various business analytics charts, including bar graphs, pie charts, and line graphs, against a white background. Decrease charts vectors Set of black silhouette for business analytics charts. A collection of eight black silhouette representing various business analytics charts, including bar. A collection of eight black silhouette representing various business analytics charts, including bar graphs, pie charts, and line graphs, against a white background
Free with trial A futuristic robotic hand reaches towards interactive financial charts, showcasing cutting-edge technology in data analysis and stock market trends with vivid color accents. Scalp. Decrease charts illustrations Advanced robotic hand interacting with dynamic financial charts and graphs, artificial intelligence analysis, stock. A futuristic robotic hand reaches towards. A futuristic robotic hand reaches towards interactive financial charts, showcasing cutting-edge technology in data analysis and stock market trends with vivid color accents. Scalp
Free with trial A modern workspace features a desktop computer displaying hand-drawn charts and graphs, representing data analysis and business insights. The screen shows various types of charts including bar graphs, line graphs, and pie charts. The overall image projects a sense of productivity and strategic pla. Decrease charts illustrations Data Visualization on Desktop. A modern workspace features a desktop computer displaying hand-drawn charts and graphs, representing data analysis and business. A modern workspace features a desktop computer displaying hand-drawn charts and graphs, representing data analysis and business insights. The screen shows various types of charts including bar graphs, line graphs, and pie charts. The overall image projects a sense of productivity and strategic pla
Free with trial This image shows a calculator, tablet, and financial charts, all generated by AI for illustrative purposes. The blue color scheme emphasizes the data-driven nature of modern finance and business analytics. The image suggests efficiency and precision in financial planning and analysis. Decrease charts illustrations Financial Data Analysis. This image shows a calculator, tablet, and financial charts, all generated by AI for illustrative purposes. The blue color scheme. This image shows a calculator, tablet, and financial charts, all generated by AI for illustrative purposes. The blue color scheme emphasizes the data-driven nature of modern finance and business analytics. The image suggests efficiency and precision in financial planning and analysis.
Free with trial Collection of colorful flat line business and finance icons isolated on white background including handshake, money bag, piggy bank, credit card, bar charts with upward arrows, dollar signs, mortgage documents, house, delivery truck, cargo ship, calculator, and tropical island symbols. Perfect for illustrating banking, investment, growth, real estate, trade, accounting concepts in presentations, websites, apps, and marketing materials. Decrease charts vectors Financial Business Icons Set Growth Investment Charts. Collection of colorful flat line business and finance icons isolated on white background including. Collection of colorful flat line business and finance icons isolated on white background including handshake, money bag, piggy bank, credit card, bar charts with upward arrows, dollar signs, mortgage documents, house, delivery truck, cargo ship, calculator, and tropical island symbols. Perfect for illustrating banking, investment, growth, real estate, trade, accounting concepts in presentations, websites, apps, and marketing materials.
Free with trial A dynamic 3D visualization of financial data, featuring an upward trending blue arrow graph, a series of white and blue bar graphs, and two pie charts. The composition is set against a dark blue, grid-like background, symbolizing data analysis, business growth, and financial success. This image is ideal for presentations, reports, and websites related to finance, economics, and market trends. Decrease charts illustrations 3D Financial Growth Chart with Pie Charts and Bar Graph. A dynamic 3D visualization of financial data, featuring an upward trending blue arrow graph, a series of. A dynamic 3D visualization of financial data, featuring an upward trending blue arrow graph, a series of white and blue bar graphs, and two pie charts. The composition is set against a dark blue, grid-like background, symbolizing data analysis, business growth, and financial success. This image is ideal for presentations, reports, and websites related to finance, economics, and market trends.
Free with trial A futuristic illustration of a hand manipulating glowing financial icons, including upward trend, percentage, dollar sign, and charts in a dark digital space. Decrease charts illustrations Digital finance hand controlling growth and profit icons. A futuristic illustration of a hand manipulating glowing financial icons, including upward trend. A futuristic illustration of a hand manipulating glowing financial icons, including upward trend, percentage, dollar sign, and charts in a dark digital space
Free with trial A diverse set of icons representing financial growth, market trends, and business analytics, including line graphs, bar charts, pie charts, and currency symbols. Decrease charts vectors Collection of Financial and Business Growth Icons and Charts. A diverse set of icons representing financial growth, market trends, and business analytics. A diverse set of icons representing financial growth, market trends, and business analytics, including line graphs, bar charts, pie charts, and currency symbols
Free with trial Illustration showing financial data analysis with charts, idea lightbulb, and location pins, perfect for finance and business concepts. Decrease charts illustrations Analyzing Financial Data and Performance Charts Illustration. Illustration showing financial data analysis with charts, idea lightbulb, and location pins. Illustration showing financial data analysis with charts, idea lightbulb, and location pins, perfect for finance and business concepts
Free with trial The image shows two bar charts side by side, each representing different financial trends. The chart on the left, depicted in green, shows an upward trend with increasing bar heights and an upward-pointing arrow, indicating growth. The chart on the right, depicted in red, shows a downward trend with decreasing bar heights and a downward-pointing arrow, indicating decline. Both charts use a 3D. Decrease charts illustrations Contrasting trends in financial growth and decline charts. The image shows two bar charts side by side, each representing different financial trends. The chart. The image shows two bar charts side by side, each representing different financial trends. The chart on the left, depicted in green, shows an upward trend with increasing bar heights and an upward-pointing arrow, indicating growth. The chart on the right, depicted in red, shows a downward trend with decreasing bar heights and a downward-pointing arrow, indicating decline. Both charts use a 3D
Free with trial This vector illustration shows a set of black graph icons with rising and falling charts indicated by arrows showing trends in data with clear simple design and sharp edges calm. Generative AI. Decrease charts vectors Black graph icons set rising and falling charts with arrows vector illustration simple design. This vector illustration shows a set of black graph icons with. This vector illustration shows a set of black graph icons with rising and falling charts indicated by arrows showing trends in data with clear simple design and sharp edges calm. Generative AI
Free with trial Arrangement shows white squares with bar charts, green and red squares with arrows indicating positive and negative trends, and a question mark, on a white background. Decrease charts illustrations Bar charts show mixed trends with positive and negative arrows beside a question mark. Arrangement shows white squares with bar charts, green and red squares. Arrangement shows white squares with bar charts, green and red squares with arrows indicating positive and negative trends, and a question mark, on a white background
Free with trial Comprehensive featuring business and financial infographic elements, bar charts, growth arrows, currency symbols, money bags, coins, documents, lightbulbs, and analytical graphs. Designed with a clean flat line art style on a white background, this graphic is ideal for corporate presentations, financial reports, business strategy concepts, economic analysis, banking promotions, and marketing materials related to investment, profit, and success. Decrease charts vectors Infographic Elements With Financial Charts And Business Icons. Comprehensive featuring business and financial infographic elements, bar charts, growth arrows. Comprehensive featuring business and financial infographic elements, bar charts, growth arrows, currency symbols, money bags, coins, documents, lightbulbs, and analytical graphs. Designed with a clean flat line art style on a white background, this graphic is ideal for corporate presentations, financial reports, business strategy concepts, economic analysis, banking promotions, and marketing materials related to investment, profit, and success.
Free with trial A versatile set of data visualization icons depicting various charts and graphs, perfect for business analysis, financial reports, or marketing strategy presentations. Decrease charts vectors Diverse array of data visualization icons, including pie charts, bar graphs, and line charts for financial reports. A versatile set of data visualization icons. A versatile set of data visualization icons depicting various charts and graphs, perfect for business analysis, financial reports, or marketing strategy presentations
Free with trial This image features a collection of data visualization icons, including charts, graphs, and organizational structures, perfect for illustrating data analysis and reporting. Decrease charts vectors Vector art of collection of data visualization icons showcasing various chart types and organizational structures for data. This image features a collection of. This image features a collection of data visualization icons, including charts, graphs, and organizational structures, perfect for illustrating data analysis and reporting
Free with trial Set of black and white icons illustrating various business analytics and data concepts including downward trend charts, funnel, report, magnifying glass, computer display, and focused chart with arrows. Generative AI. Decrease charts vectors Black and white business analytics and data icons set with charts and graphs. Set of black and white icons illustrating various business analytics and data. Set of black and white icons illustrating various business analytics and data concepts including downward trend charts, funnel, report, magnifying glass, computer display, and focused chart with arrows. Generative AI
Free with trial A conceptual photograph featuring the red word 'job' with a downward pointing arrow integrated into the letter 'o', symbolizing job loss, unemployment, economic downturn, or labor market crisis. The 3D text is placed on top of various financial reports, budget sheets, and charts showing negative trends. This image is ideal for corporate presentations, news articles about layoffs, economic reports, career counseling, and business strategy discussions regarding employment rates and financial struggles. Decrease charts illustrations Job Loss and Employment Crisis Concept with Financial Charts. A conceptual photograph featuring the red word 'job' with a downward pointing arrow integrated into. A conceptual photograph featuring the red word 'job' with a downward pointing arrow integrated into the letter 'o', symbolizing job loss, unemployment, economic downturn, or labor market crisis. The 3D text is placed on top of various financial reports, budget sheets, and charts showing negative trends. This image is ideal for corporate presentations, news articles about layoffs, economic reports, career counseling, and business strategy discussions regarding employment rates and financial struggles.
Free with trial This 3D rendered image shows a computer screen displaying various charts and graphs, including bar charts, pie charts, and line graphs. The data visualization is colorful and easy to understand, generated by AI for quick data interpretation. The design is simple and modern, ideal for presentations. Decrease charts illustrations AI-Generated Data Dashboard. This 3D rendered image shows a computer screen displaying various charts and graphs, including bar charts, pie charts, and line. This 3D rendered image shows a computer screen displaying various charts and graphs, including bar charts, pie charts, and line graphs. The data visualization is colorful and easy to understand, generated by AI for quick data interpretation. The design is simple and modern, ideal for presentations
Free with trial A close-up view of hands typing on a laptop, showcasing a digital overlay of arrows representing quality growth and cost reduction, symbolizing business efficiency. Qubit. Decrease charts illustrations Hands Typing on Laptop Keyboard with Overlay Graphs Indicating Quality Increase and Cost Decrease for Business Analytics. A close-up view of hands typing on a. A close-up view of hands typing on a laptop, showcasing a digital overlay of arrows representing quality growth and cost reduction, symbolizing business efficiency. Qubit
Free with trial Colorful business charts and graphs showing financial growth, data analysis, and stock market trends, ideal for corporate presentations and reports. Decrease charts illustrations Business data analysis charts graphs financial growth stock market trend generative ai. Colorful business charts and graphs showing financial growth, data. colorful business charts and graphs showing financial growth, data analysis, and stock market trends, ideal for corporate presentations and reports.
Free with trial Flat-design icons depicting Bitcoin cryptocurrency, wallets, mining tools, graphs, and price charts illustrating digital currency concepts. Decrease charts illustrations Flat-design icons depicting Bitcoin cryptocurrency, wallets, min. Ing tools, graphs, and price charts illustrating digital currency concepts
Free with trial Business data visualization with various charts. White background. Decrease charts illustrations Business data visualization with various charts. White background
Free with trial This image was created using Generative AI. Three bar charts showing downward trends with arrows pointing down, indicating decline. Decrease charts vectors Decreasing bar charts in three stages with arrows pointing down. This image was created using Generative AI. Three bar charts showing downward trends with arrows. This image was created using Generative AI. Three bar charts showing downward trends with arrows pointing down, indicating decline
Free with trial A person's hand is using a computer mouse on a laptop screen displaying stock market charts. Decrease charts illustrations A person using a laptop computer with a stock market chart on the screen. A person's hand is using a computer mouse on a laptop screen displaying stock market. A person's hand is using a computer mouse on a laptop screen displaying stock market charts
Free with trial Two 3D bar charts side by side illustrating data comparison or business growth trends in black and gray colors. Decrease charts illustrations Two black and gray bar charts showing business growth comparison. Two 3D bar charts side by side illustrating data comparison or business growth trends in black. Two 3D bar charts side by side illustrating data comparison or business growth trends in black and gray colors
Free with trial Modern laptop shows real time financial data analytics with line graphs bar charts and a pie chart. Decrease charts illustrations Laptop Screen Displaying Live Business Data Charts and Analytics. Modern laptop shows real time financial data analytics with line graphs bar charts and a pie. Modern laptop shows real time financial data analytics with line graphs bar charts and a pie chart
Free with trial Bright, glowing lines depict market fluctuations on a digital grid, representing data analysis created AI. Decrease charts illustrations Dynamic financial charts with glowing lines and a grid background. Bright, glowing lines depict market fluctuations on a digital grid, representing data analysis. Bright, glowing lines depict market fluctuations on a digital grid, representing data analysis created AI
Free with trial Two 3D bar charts side by side illustrating data comparison or business growth trends in black and gray colors. Decrease charts illustrations Two black and gray bar charts showing business growth comparison. Two 3D bar charts side by side illustrating data comparison or business growth trends in black. Two 3D bar charts side by side illustrating data comparison or business growth trends in black and gray colors
Free with trial The image depicts a series of bar charts with varying heights and colors. The first set of bars shows a descending trend from left to right. The second set of bars also shows a descending trend, with arrows pointing downward above the last two bars, emphasizing the decrease. The third set is a single bar with a downward arrow, further emphasizing a downward trend. Decrease charts illustrations Illustrative bar chart with descending trends and arrows. The image depicts a series of bar charts with varying heights and colors. The first set of bars shows a. The image depicts a series of bar charts with varying heights and colors. The first set of bars shows a descending trend from left to right. The second set of bars also shows a descending trend, with arrows pointing downward above the last two bars, emphasizing the decrease. The third set is a single bar with a downward arrow, further emphasizing a downward trend
Free with trial This image was created using Generative AI. Business balance scale comparing rising green investment graphs with diamonds against declining orange charts. Concept of financial weighing, risk analysis, and asset allocation. Decrease charts vectors Balance scale comparing investment growth charts and diamond value. This image was created using Generative AI. Business balance scale comparing rising green. This image was created using Generative AI. Business balance scale comparing rising green investment graphs with diamonds against declining orange charts. Concept of financial weighing, risk analysis, and asset allocation
Free with trial The image displays four distinct data visualizations. The top left and bottom left show bar charts with varying heights, indicating different data values. The top right presents a stacked bar chart, where each bar is divided into segments. The bottom right illustrates a line chart, showing data points connected by lines to depict trends over time. Decrease charts illustrations Various types of data visualizations including bar and line charts. The image displays four distinct data visualizations. The top left and bottom left show bar. The image displays four distinct data visualizations. The top left and bottom left show bar charts with varying heights, indicating different data values. The top right presents a stacked bar chart, where each bar is divided into segments. The bottom right illustrates a line chart, showing data points connected by lines to depict trends over time
Free with trial Set of three bar charts illustrating data trends, growth, and comparisons with varying heights and styles for business or financial presentations. Decrease charts illustrations Three different types of bar charts showing data growth and trends. Set of three bar charts illustrating data trends, growth, and comparisons with varying. Set of three bar charts illustrating data trends, growth, and comparisons with varying heights and styles for business or financial presentations
Free with trial Red fall arrow on graphs and charts. Space for text. Decrease charts illustrations Red fall arrow on graphs and charts. Space for text. Red fall arrow on graphs and charts. Space for text
Free with trial Colorful bar and pie charts illustrate data analysis. White background. Decrease charts illustrations Colorful bar and pie charts illustrate data analysis. White background
Free with trial This image was created using Generative AI. Collection of style business infographics featuring bar charts, horizontal data representations, and trend arrows indicating financial growth or decline. Decrease charts vectors Set of business infographics with bar charts and arrows showing growth. This image was created using Generative AI. Collection of style business infographics. This image was created using Generative AI. Collection of style business infographics featuring bar charts, horizontal data representations, and trend arrows indicating financial growth or decline
Free with trial Simple vector illustration of a green up arrow and a red down arrow icon for financial charts and analysis. Decrease charts illustrations Green up arrow and red down arrow symbols representing growth and decline trends. Simple vector illustration of a green up arrow and a red down arrow icon for. Simple vector illustration of a green up arrow and a red down arrow icon for financial charts and analysis
Free with trial A collection of nine simple, solid black icons on a white background, illustrating concepts of decline, loss, and negative trends using various charts like bar graphs, line graphs, and pie charts with downward pointing arrows. Decrease charts vectors Set of black icons representing financial decrease and downward trends. A collection of nine simple, solid black icons on a white background, illustrating. A collection of nine simple, solid black icons on a white background, illustrating concepts of decline, loss, and negative trends using various charts like bar graphs, line graphs, and pie charts with downward pointing arrows
Free with trial A vibrant infographic illustrating business growth, financial analysis, and data visualization with charts, graphs, and icons. Decrease charts vectors Infographic of Business Growth and Financial Analysis with Charts and Icons. A vibrant infographic illustrating business growth, financial analysis, and data. A vibrant infographic illustrating business growth, financial analysis, and data visualization with charts, graphs, and icons
Free with trial A detailed financial analysis scene featuring a whiteboard calculator, a magnifying glass hovering over pie charts, and gold coins scattered on documents with bar graphs. This overhead shot on a wooden desk conveys concepts of auditing, investment, and financial planning. This image was generated with the assistance of artificial intelligence. Decrease charts illustrations Financial Analysis Calculator, Magnifying Glass, Charts, and Coins on Desk. A detailed financial analysis scene featuring a whiteboard calculator, a magnifying. A detailed financial analysis scene featuring a whiteboard calculator, a magnifying glass hovering over pie charts, and gold coins scattered on documents with bar graphs. This overhead shot on a wooden desk conveys concepts of auditing, investment, and financial planning.This image was generated with the assistance of artificial intelligence.
Free with trial A grid of black and white icons depicting financial charts with rising and falling trends, magnifying glasses with download arrows, and dollar signs. Decrease charts vectors Collection of black and white icons representing financial charts and data analysis graph bar chart. A grid of black and white icons depicting financial charts. A grid of black and white icons depicting financial charts with rising and falling trends, magnifying glasses with download arrows, and dollar signs
 Sign in