Free with trial Isometric banner template showing inflation concept. Vector illustration of financial crisis, rising prices, and money value decrease. Data analysis report with charts and upward arrow for web design. Decrease charts vectors Inflation And Economic Crisis Data Analysis Isometric Banner Template Vector Illustration. Isometric banner template showing inflation concept. Vector. Isometric banner template showing inflation concept. Vector illustration of financial crisis, rising prices, and money value decrease. Data analysis report with charts and upward arrow for web design
Free with trial These black glyph icons display financial growth and market decline chart symbols. They represent business success, economic loss, profit increase, and sales reduction. Ideal for financial analysts and corporate presentations in business and economic contexts. Decrease charts vectors Growth and Decline Financial Charts Icon Set for Business Analytics, Profit Increase, Loss Decrease, and Market Trend Analysis. These black glyph icons display. These black glyph icons display financial growth and market decline chart symbols. They represent business success, economic loss, profit increase, and sales reduction. Ideal for financial analysts and corporate presentations in business and economic contexts
Free with trial A professional collection of 16 business and financial icons featuring various bar charts and line graphs. Perfect for UI dashboards, corporate presentations, and data-heavy infographics showing market growth or decline. Decrease charts vectors Business Growth Bar Charts and Financial Trend Line Graph Vector Icons Set. A professional collection of 16 business and financial icons featuring various bar. A professional collection of 16 business and financial icons featuring various bar charts and line graphs. Perfect for UI dashboards, corporate presentations, and data-heavy infographics showing market growth or decline.
Free with trial A professional collection of 16 business and financial icons featuring various bar charts and line graphs. Perfect for UI dashboards, corporate presentations, and data-heavy infographics showing market growth or decline. Decrease charts vectors Business Growth Bar Charts and Financial Trend Line Graph Vector Icons Set. A professional collection of 16 business and financial icons featuring various bar. A professional collection of 16 business and financial icons featuring various bar charts and line graphs. Perfect for UI dashboards, corporate presentations, and data-heavy infographics showing market growth or decline.
Free with trial This image showcases a variety of modern, flat-design charts and graphs commonly used in business, finance, and data analysis. It includes bar charts, pie charts, and line graphs, presented in a clean, minimalist style with teal and gray color accents. These visual representations are ideal for illustrating trends, statistics, performance, and financial data in presentations, reports, and web content. Decrease charts illustrations Collection of Business and Financial Charts and Graphs. This image showcases a variety of modern, flat-design charts and graphs commonly used in business. This image showcases a variety of modern, flat-design charts and graphs commonly used in business, finance, and data analysis. It includes bar charts, pie charts, and line graphs, presented in a clean, minimalist style with teal and gray color accents. These visual representations are ideal for illustrating trends, statistics, performance, and financial data in presentations, reports, and web content.
Free with trial Set of vector business growth charts, financial progress diagrams, and statistics icons with upward and downward arrows, bar graphs, and trend lines. Perfect for business presentations, financial reports, analytics, marketing, and web design concepts. Isolated on a white background. Decrease charts vectors Set of vector business growth charts, financial progress diagrams, and statistics icons with upward and downward arrows, bar. Graphs, and trend lines. Perfect. Set of vector business growth charts, financial progress diagrams, and statistics icons with upward and downward arrows, bar graphs, and trend lines. Perfect for business presentations, financial reports, analytics, marketing, and web design concepts. Isolated on a white background
Free with trial Set of vector business growth charts, financial progress diagrams, and statistics icons with upward and downward arrows, bar graphs, and trend lines. Perfect for business presentations, financial reports, analytics, marketing, and web design concepts. Isolated on a white background. Decrease charts vectors Set of vector business growth charts, financial progress diagrams, and statistics icons with upward and downward arrows, bar. Graphs, and trend lines. Perfect. Set of vector business growth charts, financial progress diagrams, and statistics icons with upward and downward arrows, bar graphs, and trend lines. Perfect for business presentations, financial reports, analytics, marketing, and web design concepts. Isolated on a white background
Free with trial A flat depicting two distinct financial charts against a white background. The left chart a bar graph with bars in shades of green and blue, topped by a jagged blue line graph ascending towards a green percentage symbol and an upward arrow. The right chart a bar graph with bars in yellow, orange, and red, with a red line graph descending from a yellow dollar sign. Decrease charts illustrations Upward and downward financial charts with percentage and dollar symbols. A flat depicting two distinct financial charts against a white background. The left. A flat depicting two distinct financial charts against a white background. The left chart a bar graph with bars in shades of green and blue, topped by a jagged blue line graph ascending towards a green percentage symbol and an upward arrow. The right chart a bar graph with bars in yellow, orange, and red, with a red line graph descending from a yellow dollar sign
Free with trial Financial market downturn and global economic crisis. businessman holding falling red stock charts, symbolizing crisis, investment loss, inflation impact, and bearish trend across world economy. Decrease charts illustrations Financial market downturn and global economic crisis. businessman holding falling red stock charts, symbolizing crisis, investment. Loss, inflation impact, and. financial market downturn and global economic crisis. businessman holding falling red stock charts, symbolizing crisis, investment loss, inflation impact, and bearish trend across world economy
Free with trial A close-up view of black financial and business chart icons arranged in a grid on a light background. Decrease charts illustrations Close-up of financial and business chart icons on a grid finance charts. A close-up view of black financial and business chart icons arranged in a grid on a. A close-up view of black financial and business chart icons arranged in a grid on a light background
Free with trial Collection of business growth and financial analysis icons featuring bar charts and arrows with editable line art and flat shape style. Editable vector icon set. Decrease charts vectors Collection of business growth and financial analysis icons featuring bar charts and arrows with editable line art and flat shape. Style. Editable vector icon
Free with trial Set of eight vector business growth charts, financial progress diagrams, and statistics icons with upward and downward arrows, bar graphs, and trend lines. Perfect for business presentations, financial reports, analytics, marketing, and web design concepts. Isolated on a white background. Decrease charts vectors Set of eight vector business growth charts, financial progress diagrams, and statistics icons with upward and downward arrows, bar. Graphs, and trend lines. Set of eight vector business growth charts, financial progress diagrams, and statistics icons with upward and downward arrows, bar graphs, and trend lines. Perfect for business presentations, financial reports, analytics, marketing, and web design concepts. Isolated on a white background
Free with trial Set of eight vector business growth charts, financial progress diagrams, and statistics icons with upward and downward arrows, bar graphs, and trend lines. Perfect for business presentations, financial reports, analytics, marketing, and web design concepts. Isolated on a white background. Decrease charts vectors Set of eight vector business growth charts, financial progress diagrams, and statistics icons with upward and downward arrows, bar. Graphs, and trend lines. Set of eight vector business growth charts, financial progress diagrams, and statistics icons with upward and downward arrows, bar graphs, and trend lines. Perfect for business presentations, financial reports, analytics, marketing, and web design concepts. Isolated on a white background
Free with trial This image presents a compelling visual representation of a global economic downturn. A prominent, three-dimensional white arrow dramatically plunges downward, superimposed on a world map rendered in dark, somber tones. The map serves as a backdrop to several red bar graphs, illustrating a decline in various economic indicators across different regions of the globe. The overall color scheme reinforces a sense of crisis and uncertainty. The arrow's sharp descent visually emphasizes the severity of the economic drop. Numerical data and graphical representations are included, further supporting the downward economic trend. Decrease charts illustrations Global Economic Downturn Visualized with 3D Arrow and Charts. This image presents a compelling visual representation of a global economic downturn. A prominent. This image presents a compelling visual representation of a global economic downturn. A prominent, three-dimensional white arrow dramatically plunges downward, superimposed on a world map rendered in dark, somber tones. The map serves as a backdrop to several red bar graphs, illustrating a decline in various economic indicators across different regions of the globe. The overall color scheme reinforces a sense of crisis and uncertainty. The arrow's sharp descent visually emphasizes the severity of the economic drop. Numerical data and graphical representations are included, further supporting the downward economic trend.
Free with trial Colorful bar charts illustrating positive and negative business trends from january to may provide a clear visual. Representation of performance. Decrease charts vectors Colorful bar charts illustrating positive and negative business trends from january to may provide a clear visual. Representation of performance
Free with trial Four colorful bar charts are displayed on a graph, representing trends, statistics, and timeline data, with a potential. Focus on business infographics elements. Decrease charts vectors Four colorful bar charts are displayed on a graph, representing trends, statistics, and timeline data, with a potential. Focus on business infographics elements
Free with trial Colorful bar charts are presenting statistical trends and business performance data across different time periods. Possibly days of the week. Using a vibrant color scheme of blue. Purple. And orange. Decrease charts vectors Colorful bar charts are presenting statistical trends and business performance data across different time periods. Possibly days of the week. Using a vibrant
Free with trial Colorful bar charts are presenting statistical trends and business performance data across different time periods. Possibly days of the week. Using a vibrant color scheme of blue. Purple. And orange. Decrease charts illustrations Colorful bar charts are presenting statistical trends and business performance data across different time periods. Possibly days of the week. Using a vibrant
Free with trial Four colorful bar charts are displayed on a graph, representing trends, statistics, and timeline data, with a potential. Focus on business infographics elements. Decrease charts illustrations Four colorful bar charts are displayed on a graph, representing trends, statistics, and timeline data, with a potential. Focus on business infographics elements
Free with trial Colorful bar charts illustrating positive and negative business trends from january to may provide a clear visual. Representation of performance. Decrease charts illustrations Colorful bar charts illustrating positive and negative business trends from january to may provide a clear visual. Representation of performance
Free with trial This image showcases a large collection of minimalist, line-style icons representing various charts and graphs. These icons depict data visualization elements commonly used in business, analytics, and reporting. high-quality professional. Decrease charts vectors Collection of diverse line style charts and graphs icons displayed neatly. This image showcases a large collection of minimalist, line-style icons representing. This image showcases a large collection of minimalist, line-style icons representing various charts and graphs. These icons depict data visualization elements commonly used in business, analytics, and reporting. high-quality professional
Free with trial Financial arrows up and down. Financial growth and decline. Graph with green and red arrows. Finance diagram, graphic charts icon set. Decrease charts vectors Financial arrows up and down. Financial growth and decline. Graph with green and red arrows. Finance diagram, graphic charts icon. Set
Free with trial Collection of Black Simple Flat Icons Representing Different Types of Data Analysis and Charts. Decrease charts vectors A set of nine simple, black, flat icons illustrating various charts and data analysis tools, including bar charts, line graphs,. Collection of Black Simple Flat. Collection of Black Simple Flat Icons Representing Different Types of Data Analysis and Charts
Free with trial A graphic illustration featuring two distinct charts on a white background. The upper chart displays three descending lines in black, red, and green, each ending with a downward-pointing arrow. Below this, a bar chart shows three black bars of increasing height, with arrows pointing upwards from the tallest bars. A stylized black graphic element resembling diverging paths or a funnel is positioned. Decrease charts vectors Downward and upward trending graphs with arrows chart. A graphic illustration featuring two distinct charts on a white background. The upper chart displays three. A graphic illustration featuring two distinct charts on a white background. The upper chart displays three descending lines in black, red, and green, each ending with a downward-pointing arrow. Below this, a bar chart shows three black bars of increasing height, with arrows pointing upwards from the tallest bars. A stylized black graphic element resembling diverging paths or a funnel is positioned
Free with trial Magnifying Glass Over Financial Reports and Charts. Charts and Pen A magnifying glass rests atop financial charts with a pen, displaying analysis and review. Decrease charts illustrations Magnifying Glass Over Financial Reports and Charts. Charts and Pen A magnifying glass rests atop financial charts with a pen, displaying analysis and review
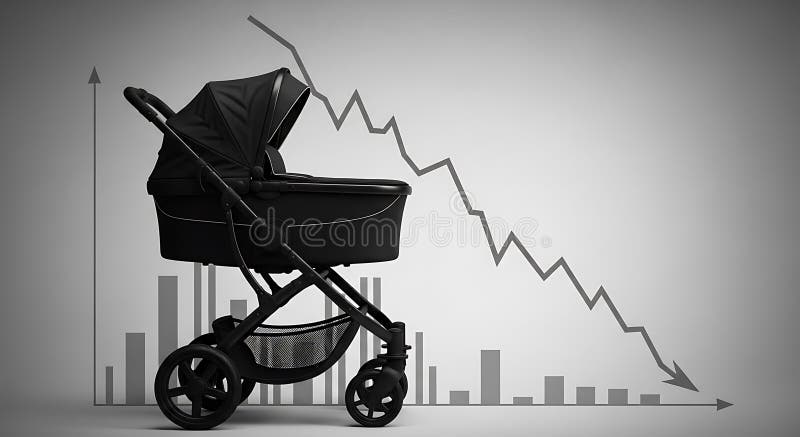
Free with trial A stark visual representation of demographic decline featuring a baby carriage silhouetted against a backdrop of a downward-trending graph and bar charts, symbolizing falling birth rates and. Decrease charts illustrations Demographic Decline Baby Carriage with Downturn Graph and Population Decrease Concept. A stark visual representation of demographic decline featuring a baby. A stark visual representation of demographic decline featuring a baby carriage silhouetted against a backdrop of a downward-trending graph and bar charts, symbolizing falling birth rates and
Free with trial A modern business analytics dashboard showcasing key performance indicators (KPIs) with engaging charts and graphs for data visualization Ideal for presentations and reports. Generative AI. Decrease charts illustrations Business Analytics Dashboard Graphs Charts Data Performance Growth Metrics KPI. A modern business analytics dashboard showcasing key performance indicators (KPIs. A modern business analytics dashboard showcasing key performance indicators (KPIs) with engaging charts and graphs for data visualization Ideal for presentations and reports. Generative AI
Free with trial Featuring four vibrant business charts illustrating increasing, decreasing, fluctuating, and peaking trends, perfect for enhancing presentations and reports with clear visual data analysis. Decrease charts vectors Featuring four vibrant business charts illustrating increasing, decreasing, fluctuating, and peaking trends, perfect for. Enhancing presentations and reports. Featuring four vibrant business charts illustrating increasing, decreasing, fluctuating, and peaking trends, perfect for enhancing presentations and reports with clear visual data analysis
Free with trial Icon set featuring business and financial symbols. Includes arrows indicating growth and decline, bar charts, line graphs, currency symbols, and gears. Colors are predominantly blue and light blue, with a clean, modern design. Icons are arranged in rows, each depicting different indicators of economic and financial trends, such as profit increase or loss. Suitable for presentations, reports, or financial software interfaces. Decrease charts vectors Increase Decrease icon set containing business growth trends, economic decline indicators, and financial chart designs. Icon set featuring business and. Icon set featuring business and financial symbols. Includes arrows indicating growth and decline, bar charts, line graphs, currency symbols, and gears. Colors are predominantly blue and light blue, with a clean, modern design. Icons are arranged in rows, each depicting different indicators of economic and financial trends, such as profit increase or loss. Suitable for presentations, reports, or financial software interfaces.
Free with trial Featuring four vibrant business charts illustrating increasing, decreasing, fluctuating, and peaking trends, perfect for enhancing presentations and reports with clear visual data analysis. Decrease charts illustrations Featuring four vibrant business charts illustrating increasing, decreasing, fluctuating, and peaking trends, perfect for. Enhancing presentations and reports. Featuring four vibrant business charts illustrating increasing, decreasing, fluctuating, and peaking trends, perfect for enhancing presentations and reports with clear visual data analysis
Free with trial Growth, profit, business vector icons. Black linear graphs, charts representing market trends, finance analytics. Perfect for. Economic forecasts, trend an. Decrease charts vectors Growth, profit, business vector icons. Black linear graphs, charts representing market trends, finance analytics. Perfect for. Economic forecasts, trend an
Free with trial Set of three bar charts illustrating data trends, growth, and comparisons with varying heights and styles for business or financial presentations. Decrease charts illustrations Three different types of bar charts showing data growth and trends. Set of three bar charts illustrating data trends, growth, and comparisons with varying. Set of three bar charts illustrating data trends, growth, and comparisons with varying heights and styles for business or financial presentations
Free with trial This futuristic dashboard, generated by AI, displays a comprehensive set of dynamic graphs and charts, ideal for visualizing complex datasets. The vibrant color scheme enhances readability, while the sleek design emphasizes efficiency and modern aesthetics. This is a perfect example of how AI can. Decrease charts illustrations AI-Generated Data Visualization Dashboard. This futuristic dashboard, generated by AI, displays a comprehensive set of dynamic graphs and charts, ideal for. This futuristic dashboard, generated by AI, displays a comprehensive set of dynamic graphs and charts, ideal for visualizing complex datasets. The vibrant color scheme enhances readability, while the sleek design emphasizes efficiency and modern aesthetics. This is a perfect example of how AI can
Free with trial Analytics icon set featuring 25 solid black icons for data analysis, metrics, KPI, ROI, segmentation, A B testing, charts, reports, and performance measurement. Versatile collection for marketing analytics, business dashboards, websites, mobile applications, presentations, and digital interface design. Decrease charts illustrations Analytics icon set with 25 solid icons. Data analysis, metrics, KPI, ROI, segmentation, A B testing, charts, reports and performan. Analytics icon set featuring. Analytics icon set featuring 25 solid black icons for data analysis, metrics, KPI, ROI, segmentation, A B testing, charts, reports, and performance measurement. Versatile collection for marketing analytics, business dashboards, websites, mobile applications, presentations, and digital interface design.
Free with trial The image depicts a combination of bar and line charts. The bar chart shows three descending bars in orange, yellow, and a lighter shade, indicating a decline in values. Overlaid on this is a downward-sloping line chart, reinforcing the trend of decrease. The overall design suggests a visual representation of a downward market trend or decline in performance metrics over time. Decrease charts illustrations Graphic illustration of declining market trends with bar and line chart combination. The image depicts a combination of bar and line charts. The bar chart shows. The image depicts a combination of bar and line charts. The bar chart shows three descending bars in orange, yellow, and a lighter shade, indicating a decline in values. Overlaid on this is a downward-sloping line chart, reinforcing the trend of decrease. The overall design suggests a visual representation of a downward market trend or decline in performance metrics over time
Free with trial A detailed view of gold bars and coins under a magnifying glass, set against a backdrop of financial charts and data streams. The image evokes a sense of careful scrutiny and investment analysis in the financial markets. The shiny gold textures contrast with the digital screens, creating a blend of. Decrease charts illustrations Golden Investment Analysis. A detailed view of gold bars and coins under a magnifying glass, set against a backdrop of financial charts and data streams. The. A detailed view of gold bars and coins under a magnifying glass, set against a backdrop of financial charts and data streams. The image evokes a sense of careful scrutiny and investment analysis in the financial markets. The shiny gold textures contrast with the digital screens, creating a blend of
Free with trial The image showcases a collection of visual representations of various business performance metrics, such as growth percentages, market shares, and financial gains. Each cube features different types of charts and graphs, including bar graphs, line graphs, pie charts, and target indicators, illustrating growth rates like 5%, 8%, 15%, and market share percentages. The visuals emphasize positive and. Decrease charts illustrations Diverse business performance metrics and growth indicators isolated on white background. The image showcases a collection of visual representations of various. The image showcases a collection of visual representations of various business performance metrics, such as growth percentages, market shares, and financial gains. Each cube features different types of charts and graphs, including bar graphs, line graphs, pie charts, and target indicators, illustrating growth rates like 5%, 8%, 15%, and market share percentages. The visuals emphasize positive and
Free with trial A businessman in a suit is intently working on a laptop, analyzing financial data displayed with charts and graphs, including a prominent red percentage symbol and a downward-pointing arrow, indicating a decline in performance or value. Decrease charts illustrations Businessman Analyzing Financial Data with Decreasing Percentage and Bar Graphs on Laptop. A businessman in a suit is intently working on a laptop, analyzing. A businessman in a suit is intently working on a laptop, analyzing financial data displayed with charts and graphs, including a prominent red percentage symbol and a downward-pointing arrow, indicating a decline in performance or value
Free with trial A detailed close-up shot of a stock market chart display featuring multiple graphs and charts divided into sections representing different market aspects, including a red line graph labeled OTC Markets, a blue line graph showing a downward trend, another section with an upward trend marked by a red downward arrow, and additional charts on the right side displaying stock performance over time with. Decrease charts illustrations Close-up view of multiple stock market charts and graphs showing OTC markets performance with upward and downward trends. A detailed close-up shot of a stock. A detailed close-up shot of a stock market chart display featuring multiple graphs and charts divided into sections representing different market aspects, including a red line graph labeled OTC Markets, a blue line graph showing a downward trend, another section with an upward trend marked by a red downward arrow, and additional charts on the right side displaying stock performance over time with
Free with trial Set of Black Finance and Data Analysis Icons with Charts, Graphs, Location, Percentage, and Time Symbols. Decrease charts vectors A collection of nine distinct black graphic icons representing various business and financial concepts including bar charts, line. Set of Black Finance and Data. Set of Black Finance and Data Analysis Icons with Charts, Graphs, Location, Percentage, and Time Symbols
Free with trial A vibrant digital explosion of glowing stock market data, featuring percentage gains and losses, trading volumes, and financial charts on a dark background. Decrease charts illustrations Digital Stock Market Data Explosion with Glowing Graphs Percentages and Financial Numbers. A vibrant digital explosion of glowing stock market data, featuring. A vibrant digital explosion of glowing stock market data, featuring percentage gains and losses, trading volumes, and financial charts on a dark background
Free with trial This infographic features a collection of colorful charts and graphs on a white background, surrounded by arrows pointing in different directions. The image represents business and finance concepts, such as data analysis, statistics, and trends. The vibrant colors and dynamic design make it visually appealing and engaging. Decrease charts vectors A colorful infographic with arrows and charts on a white background. This infographic features a collection of colorful charts and graphs on a white background. This infographic features a collection of colorful charts and graphs on a white background, surrounded by arrows pointing in different directions. The image represents business and finance concepts, such as data analysis, statistics, and trends. The vibrant colors and dynamic design make it visually appealing and engaging.
Free with trial Outline financial tax icons set featuring a book, magnifying glass, money, documents, and charts for financial. Accounting and business concept design. AI. Decrease charts vectors Outline financial tax icons set featuring a book, magnifying glass, money, documents, and charts for financial. Accounting and business concept design. AI
Free with trial A person's hand is reaching out towards a holographic display that shows various financial data charts and an infinity symbol, representing continuous growth and success in the financial market. Decrease charts illustrations Hand interacting with a holographic display showing financial data and an infinity symbol. A person's hand is reaching out towards a holographic display that. A person's hand is reaching out towards a holographic display that shows various financial data charts and an infinity symbol, representing continuous growth and success in the financial market
Free with trial This infographic-style image visually represents business growth and financial performance through various charts and graphs. A line graph illustrates revenue trends with percentage markers, a donut chart displays market share distribution, and a bar chart shows quarterly profit figures. Icons representing data, growth, and reports are subtly integrated into the background, creating a professional and informative visual for business and finance-related content. Decrease charts illustrations Business Growth and Financial Performance Analytics. This infographic-style image visually represents business growth and financial performance through various. This infographic-style image visually represents business growth and financial performance through various charts and graphs. A line graph illustrates revenue trends with percentage markers, a donut chart displays market share distribution, and a bar chart shows quarterly profit figures. Icons representing data, growth, and reports are subtly integrated into the background, creating a professional and informative visual for business and finance-related content.
Free with trial A simple and bold black curved arrow icon, isolated on a clean white background. This minimalist graphic element points downwards and to the right, symbolizing direction, movement, and flow. It can represent concepts such as decline, decrease, or a downward trend in business charts and infographics. This versatile vector-style illustration is perfect for use as a pointer, a navigation symbol in web design and user interfaces, or to guide attention in presentations and documents. The high contrast and clean design make it easy to integrate into any project. Decrease charts vectors Curved Black Arrow Pointing Down and Right Icon. A simple and bold black curved arrow icon, isolated on a clean white background. This minimalist graphic element. A simple and bold black curved arrow icon, isolated on a clean white background. This minimalist graphic element points downwards and to the right, symbolizing direction, movement, and flow. It can represent concepts such as decline, decrease, or a downward trend in business charts and infographics. This versatile vector-style illustration is perfect for use as a pointer, a navigation symbol in web design and user interfaces, or to guide attention in presentations and documents. The high contrast and clean design make it easy to integrate into any project.
Free with trial Abstract financial trading graph with candlestick charts and data analysis on a dark background. AI generated. Decrease charts illustrations Abstract financial trading graph with candlestick charts and data analysis on a dark background. AI generated
Free with trial Two distinct bar charts are depicted against a white background. The left chart a downward trend with bars in blue, yellow, and purple, accompanied by a yellow coin with a dollar sign and an arrow pointing down towards it from a small graph indicating a rising trend. The right chart an upward trend with bars in red, green, and blue, and a green coin with a dollar sign connected to a circle with a. Decrease charts illustrations Bar charts showing financial growth and decline with dollar symbols. Two distinct bar charts are depicted against a white background. The left chart a downward. Two distinct bar charts are depicted against a white background. The left chart a downward trend with bars in blue, yellow, and purple, accompanied by a yellow coin with a dollar sign and an arrow pointing down towards it from a small graph indicating a rising trend. The right chart an upward trend with bars in red, green, and blue, and a green coin with a dollar sign connected to a circle with a
Free with trial A vibrant and modern illustration showcasing various data visualization elements. The image features a collection of charts, graphs, and diagrams, including line graphs, bar graphs, pie charts, and circular diagrams, all rendered in a colorful and abstract style. The design incorporates gradients and geometric shapes, suggesting growth, analysis, and business concepts. Ideal for presentations, reports, websites, and marketing materials related to finance, economics, and data analysis. Decrease charts illustrations Abstract Data Visualization and Business Charts. A vibrant and modern illustration showcasing various data visualization elements. The image features a. A vibrant and modern illustration showcasing various data visualization elements. The image features a collection of charts, graphs, and diagrams, including line graphs, bar graphs, pie charts, and circular diagrams, all rendered in a colorful and abstract style. The design incorporates gradients and geometric shapes, suggesting growth, analysis, and business concepts. Ideal for presentations, reports, websites, and marketing materials related to finance, economics, and data analysis.
Free with trial A laptop screen displays financial data, illuminated against a blurry background, suggesting analysis. Decrease charts illustrations Laptop displays dynamic financial data represented in charts and graphs. A laptop screen displays financial data, illuminated against a blurry background. A laptop screen displays financial data, illuminated against a blurry background, suggesting analysis
Free with trial A collection of nine simple black icons on a white background depicting concepts of decrease loss and downward trends using graphs charts and arrows. Decrease charts vectors Set of black decline icons showing business failure and data reduction. A collection of nine simple black icons on a white background depicting concepts of. A collection of nine simple black icons on a white background depicting concepts of decrease loss and downward trends using graphs charts and arrows
Free with trial A bright red, three-dimensional arrow is depicted pointing directly downwards. The arrow has a glossy, reflective surface and is presented in isolation against a stark white background. This visual element commonly represents a downward trend, decrease, or negative movement. Decrease charts illustrations Shiny Red 3D Arrow Pointing Downwards on a White Background direction. A bright red, three-dimensional arrow is depicted pointing directly downwards. The arrow. A bright red, three-dimensional arrow is depicted pointing directly downwards. The arrow has a glossy, reflective surface and is presented in isolation against a stark white background. This visual element commonly represents a downward trend, decrease, or negative movement
Free with trial A versatile collection of flat vector icons illustrating concepts of decline, decrease, and loss. This set features various graphics, including downward-pointing arrows, negative trend line graphs, and falling bar charts in multiple colors. These symbols are perfect for representing financial crisis, economic recession, stock market crash, business failure, or any form of reduction. Ideal for use in infographics, presentations, financial reports, websites, and data visualization projects, these modern icons effectively communicate negative trends and downturns. Isolated on a white background for easy integration into any design. Decrease charts illustrations Financial Decline and Recession Vector Icon Set. A versatile collection of flat vector icons illustrating concepts of decline, decrease, and loss. This set. A versatile collection of flat vector icons illustrating concepts of decline, decrease, and loss. This set features various graphics, including downward-pointing arrows, negative trend line graphs, and falling bar charts in multiple colors. These symbols are perfect for representing financial crisis, economic recession, stock market crash, business failure, or any form of reduction. Ideal for use in infographics, presentations, financial reports, websites, and data visualization projects, these modern icons effectively communicate negative trends and downturns. Isolated on a white background for easy integration into any design.
Free with trial The image features a collection of colorful chart icons, including bar graphs, line graphs, and pie charts, symbolizing data analysis, business growth, and financial performance. Decrease charts illustrations Colorful chart icons representing data analysis and business growth. The image features a collection of colorful chart icons, including bar graphs, line graphs. The image features a collection of colorful chart icons, including bar graphs, line graphs, and pie charts, symbolizing data analysis, business growth, and financial performance
Free with trial A vibrant collection of hand-drawn business charts and graphs, rendered in blue tones. The set includes various types of visualizations like bar charts, line graphs, and a pie chart, all with a sketchy, illustrative style. These visuals are ideal for presentations, reports, and infographics related to finance, data analysis, growth, and business performance. Decrease charts illustrations Hand-Drawn Business Charts and Graphs Collection. A vibrant collection of hand-drawn business charts and graphs, rendered in blue tones. The set includes various. A vibrant collection of hand-drawn business charts and graphs, rendered in blue tones. The set includes various types of visualizations like bar charts, line graphs, and a pie chart, all with a sketchy, illustrative style. These visuals are ideal for presentations, reports, and infographics related to finance, data analysis, growth, and business performance.
Free with trial Four cylindrical bar charts are displayed against a light gray background. The charts represent four items labeled ITEM 11, ITEM 12, ITEM 13, and ITEM 14. Each chart displays data series with circular markers and labels. The data series are colored in shades of teal, blue, and dark blue. The charts have a 3D cylindrical appearance with a slight gradient. Horizontal grid lines with numerical labels. Decrease charts illustrations Four cylindrical bar charts with blue and teal data. Four cylindrical bar charts are displayed against a light gray background. The charts represent four items. Four cylindrical bar charts are displayed against a light gray background. The charts represent four items labeled ITEM 11, ITEM 12, ITEM 13, and ITEM 14. Each chart displays data series with circular markers and labels. The data series are colored in shades of teal, blue, and dark blue. The charts have a 3D cylindrical appearance with a slight gradient. Horizontal grid lines with numerical labels
Free with trial Vector. A collection of icons representing data analysis, charts, graphs, and statistics. Decrease charts vectors Vector. A collection of icons representing data analysis, charts, graphs, and statistics
Free with trial An overhead shot captures hands engaged in meticulous financial planning on a rustic wooden desk. Stacks of US quarters, a calculator, and a notebook filled with handwritten charts and graphs illustrate concepts of budgeting, savings, and investment. The scene suggests careful analysis of financial data, strategizing for future growth, or managing personal and business finances. Eyeglasses, a pen, and a coffee cup complete this focused work environment, ideal for themes of economy, wealth management, and financial success. Decrease charts illustrations Financial Planning and Savings: Hands Analyzing Data with Coins and Calculator. An overhead shot captures hands engaged in meticulous financial planning on a. An overhead shot captures hands engaged in meticulous financial planning on a rustic wooden desk. Stacks of US quarters, a calculator, and a notebook filled with handwritten charts and graphs illustrate concepts of budgeting, savings, and investment. The scene suggests careful analysis of financial data, strategizing for future growth, or managing personal and business finances. Eyeglasses, a pen, and a coffee cup complete this focused work environment, ideal for themes of economy, wealth management, and financial success.
Free with trial Collection of various red infographic elements including charts, graphs, diagrams, and symbols, perfect for presentations and data visualization. Ideal for showcasing data trends, progress, and comparisons. Easily customizable and adaptable to diverse projects. Decrease charts illustrations Red Infographic Elements. Collection of various red infographic elements including charts, graphs, diagrams, and symbols, perfect for presentations and data. Collection of various red infographic elements including charts, graphs, diagrams, and symbols, perfect for presentations and data visualization. Ideal for showcasing data trends, progress, and comparisons. Easily customizable and adaptable to diverse projects.
Free with trial The image features a line graph showing upward trends and a bar chart with various colored bars representing different data points. Decrease charts illustrations Graphs and charts illustrating data trends and comparisons in a colorful display. The image features a line graph showing upward trends and a bar chart with. The image features a line graph showing upward trends and a bar chart with various colored bars representing different data points
Free with trial A collage of various hand-drawn charts and graphs in shades of blue, illustrating business growth, data analysis, and financial trends. The collection includes bar charts, line graphs, and pie charts, all rendered with a sketchy, artistic style. These visuals are perfect for presentations, reports, or any project requiring a dynamic and informative representation of data and progress. Decrease charts illustrations Hand-Drawn Business Growth Charts and Graphs Collection. A collage of various hand-drawn charts and graphs in shades of blue, illustrating business growth, data. A collage of various hand-drawn charts and graphs in shades of blue, illustrating business growth, data analysis, and financial trends. The collection includes bar charts, line graphs, and pie charts, all rendered with a sketchy, artistic style. These visuals are perfect for presentations, reports, or any project requiring a dynamic and informative representation of data and progress.
Free with trial A horizontal arrangement of three electrocardiogram graphs displayed on a textured beige background illustrates distinct cardiac rhythms including normal sinus rhythm with green tracing, atrial fibrillation showing irregular red waveform patterns, and bradycardia demonstrated through slowed blue heartbeat tracings, providing educational visual comparison of arrhythmias for medical textbooks,. Decrease charts illustrations Three medical ECG heart rhythm comparison charts showing normal sinus atrial fibrillation and bradycardia on aged beige background. A horizontal arrangement of. A horizontal arrangement of three electrocardiogram graphs displayed on a textured beige background illustrates distinct cardiac rhythms including normal sinus rhythm with green tracing, atrial fibrillation showing irregular red waveform patterns, and bradycardia demonstrated through slowed blue heartbeat tracings, providing educational visual comparison of arrhythmias for medical textbooks,
Free with trial A set of nine minimalist vector icons depicting various types of charts and graphs including bar charts, progress bars, and trend lines for data visualization and analytics. Decrease charts vectors Collection of simple black glyph icons representing business charts graphs and data analysis. A set of nine minimalist vector icons depicting various types of. A set of nine minimalist vector icons depicting various types of charts and graphs including bar charts, progress bars, and trend lines for data visualization and analytics
Free with trial Colorful Charts on a Calculator Keyboard. Decrease charts illustrations Colorful Charts on a Calculator Keyboard.
Free with trial A collection of minimalist, gray 3D icons representing various data points and processes, including charts, graphs, documents, cloud computing, location markers, and alerts. The design suggests data analysis, project management, or business intelligence concepts. Decrease charts illustrations Data Visualization Icons. A collection of minimalist, gray 3D icons representing various data points and processes, including charts, graphs, documents, cloud. A collection of minimalist, gray 3D icons representing various data points and processes, including charts, graphs, documents, cloud computing, location markers, and alerts. The design suggests data analysis, project management, or business intelligence concepts.
Free with trial Graphs set with line charts, bar charts, and scatter plots illustrating upward and. Downward trends with arrows and data points. Decrease charts vectors Graphs set with line charts, bar charts, and scatter plots illustrating upward and. Downward trends with arrows and data points
Free with trial Two bar charts are displayed side by side. One shows a clear upward trend with a green arrow, while the other shows a downward trend with a red arrow. Decrease charts illustrations Bar charts showing contrasting upward and downward trends. Two bar charts are displayed side by side. One shows a clear upward trend with a green arrow, while. Two bar charts are displayed side by side. One shows a clear upward trend with a green arrow, while the other shows a downward trend with a red arrow
Free with trial Bar charts showing upward and downward trends. Two bar charts, one green showing growth and one red showing decline, with trend lines and arrows. Decrease charts illustrations Bar charts showing upward and downward trends. Two bar charts, one green showing growth and one red showing decline, with trend lines and arrows
Free with trial A business professional conducts a thorough analysis of financial data using a magnifying glass, illustrating market trends with graphs and charts on a digital interface. Scalp. Decrease charts illustrations Business Professional Analyzing Financial Data with a Magnifying Glass, Graphs, and Visual Representation of Market. A business professional conducts a thorough. A business professional conducts a thorough analysis of financial data using a magnifying glass, illustrating market trends with graphs and charts on a digital interface. Scalp
Free with trial Conceptual image illustrating digital property management. A miniature house sits in a shopping cart, symbolizing the purchase or management of real estate. A tablet displays property management apps and data, while a holographic interface shows charts and information. This image conveys the use of technology in modern real estate and property management. Decrease charts illustrations Digital Property Management Concept. Conceptual image illustrating digital property management. A miniature house sits in a shopping cart, symbolizing the. Conceptual image illustrating digital property management. A miniature house sits in a shopping cart, symbolizing the purchase or management of real estate. A tablet displays property management apps and data, while a holographic interface shows charts and information. This image conveys the use of technology in modern real estate and property management.
Free with trial A collection of nine simple, solid black icons on a white background, illustrating concepts of decline, loss, and negative trends using various charts like bar graphs, line graphs, and pie charts with downward pointing arrows. Decrease charts vectors Set of black icons representing financial decrease and downward trends. A collection of nine simple, solid black icons on a white background, illustrating. A collection of nine simple, solid black icons on a white background, illustrating concepts of decline, loss, and negative trends using various charts like bar graphs, line graphs, and pie charts with downward pointing arrows
Free with trial Abstract colorful bar charts display statistical data and financial trend analysis. Decrease charts vectors Colorful abstract bar charts representing data analysis and statistical visualization. Abstract colorful bar charts display statistical data and financial trend. Abstract colorful bar charts display statistical data and financial trend analysis.
Free with trial The image shows a 3D-rendered easel holding a canvas with a bar and line chart. The bar chart illustrates a declining trend in growth, with the first bar being the tallest and each subsequent bar progressively shorter. Overlaid on the bars is a red downward-sloping line, emphasizing the decrease. The scene is set against a plain white background, highlighting the chart's elements clearly. Decrease charts illustrations Easing economic growth depicted through a declining bar and line chart on an easel. The image shows a 3D-rendered easel holding a canvas with a bar and line. The image shows a 3D-rendered easel holding a canvas with a bar and line chart. The bar chart illustrates a declining trend in growth, with the first bar being the tallest and each subsequent bar progressively shorter. Overlaid on the bars is a red downward-sloping line, emphasizing the decrease. The scene is set against a plain white background, highlighting the chart's elements clearly
Free with trial Wooden blocks show 2027 budget in front of financial graphs and charts, illustrating economic growth and planning strategies in a professional setting. Decrease charts illustrations Wooden blocks displaying 2027 budget with financial graphs and charts in the background representing economic growth and planning. Wooden blocks show 2027 budget. Wooden blocks show 2027 budget in front of financial graphs and charts, illustrating economic growth and planning strategies in a professional setting
Free with trial Futuristic Robot Hand Displaying Graph of Cost Reduction and Quality Improvement with Rising Arrows and Bar Charts in a Digital Setting. Bitwise. Decrease charts illustrations Futuristic Robot Hand Displaying Graph of Cost Reduction and Quality Improvement with Rising Arrows and Bar Charts in a. Digital Setting. Bitwise
Free with trial Vector depicting rising fuel costs and economic inflation with a gas pump nozzle dripping fuel over a small car, upward red and blue arrows, bar charts, falling coins, shopping cart, and weight symbols indicating pressure. Isolated on white background in flat modern style. Ideal for articles, presentations and reports about gasoline prices, energy crisis, cost of living, recession, budgeting and financial markets. Decrease charts vectors Rising Fuel Prices and Inflation Economic Concept. Vector depicting rising fuel costs and economic inflation with a gas pump nozzle dripping fuel over a small. Vector depicting rising fuel costs and economic inflation with a gas pump nozzle dripping fuel over a small car, upward red and blue arrows, bar charts, falling coins, shopping cart, and weight symbols indicating pressure. Isolated on white background in flat modern style. Ideal for articles, presentations and reports about gasoline prices, energy crisis, cost of living, recession, budgeting and financial markets.
Free with trial Investors and traders studying candlestick charts, evaluating market trends, developing strategies, and responding to shifts in currency values. Decrease charts vectors Investors and traders interacting with candlestick charts, analyzing market trends, strategizing, and reacting to currency. Investors and traders studying. Investors and traders studying candlestick charts, evaluating market trends, developing strategies, and responding to shifts in currency values
Free with trial Financial market analysis with data charts and line graphs in blue tone. A dynamic display of market trends with charts and graphs in a cool blue color scheme. Decrease charts illustrations Financial market analysis with data charts and line graphs in blue tone. A dynamic display of market trends with charts and graphs in a cool blue color scheme
Free with trial Vibrant financial decisions shown through floating digital market charts --chaos 55 --ar 16:9 --profile 8vfa4lb --v 7 Job ID: 73c43520-d3ac-4d75-940e-9fab8db6f1ed. Generative AI. Decrease charts illustrations Red Arrow Decrease on Stock Market Graph Showing Economic Downturn and Financial Decline. Vibrant financial decisions shown through floating digital market. Vibrant financial decisions shown through floating digital market charts --chaos 55 --ar 16:9 --profile 8vfa4lb --v 7 Job ID: 73c43520-d3ac-4d75-940e-9fab8db6f1ed. Generative AI
 Sign in