Free with trial Cycle infographic with slice circle create round object with arrow direction with 6 point stage with modern dark style for slide presentation vector. Decrease diagram vector illustrations Cycle infographic with slice circle create round object with arrow direction with 6 point stage with modern dark style for slide
Free with trial Reduction chart icon vector line logo mark or symbol set collection outline style. Decrease diagram vector vectors Reduction chart icon thin line illustration. Reduction chart icon vector line logo mark or symbol set collection outline style
Free with trial Up and down graph icon vector in circular line. Outline bar chart with uptrend and downtrend arrow symbol. Decrease diagram vector vectors Up and down graph icon in circular line. Outline bar chart with uptrend and downtrend arrow symbol
Free with trial Line Global economic crisis icon isolated on white background. World finance crisis. Abstract banner with liquid shapes. Vector. Decrease diagram vector illustrations Line Global economic crisis icon isolated on white background. World finance crisis. Abstract banner with liquid shapes
Free with trial Abstract dotted financial graph chart sparkling background. Vector minimal tech design. Decrease diagram vector vectors Abstract dotted financial graph chart sparkling background
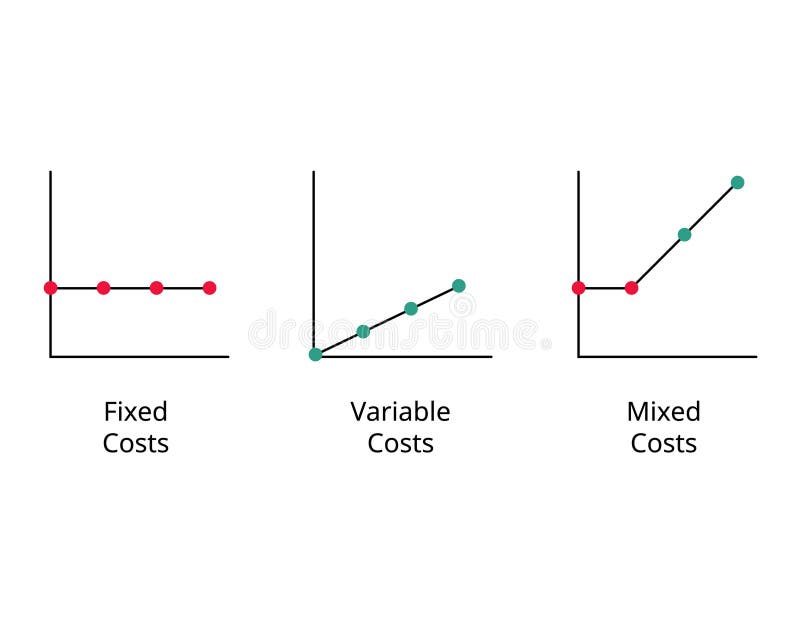
Free with trial Sales with total cost and profit with variable cost and fix cost vector. Decrease diagram vector vectors Sales with total cost and profit with variable cost and fix cost
Free with trial Business failure. Symbol of loss. Unsuccessful business investment. Businessman standing looking at a falling arrow graph. vector illustration flat. Decrease diagram vector illustrations Business failure. Symbol of loss. Unsuccessful business investment
Free with trial This image shows a bar chart with a downward trend line, indicating economic decline. Vector illustration design using ai tool. Decrease diagram vector vectors Economic recession chart. This image shows a bar chart with a downward trend line, indicating economic decline. Vector illustration design using ai tool.
Free with trial Video player icon set. Containing play or start button, pause or stop, media, camera, live, cinema, multimedia, film, handycam, clapperboard, movie, streaming or online video. Vector illustration. Decrease diagram vector illustrations Video player icon set
Free with trial High-Quality Vector Icons Collection with Editable Stroke. Ideal for Professional and Creative Projects. Decrease diagram vector vectors Influencer icons . High-Quality Vector Icons Collection with Editable Stroke. Ideal for Professional and Creative. High-Quality Vector Icons Collection with Editable Stroke. Ideal for Professional and Creative Projects.
Free with trial Blue and red lines show economic decline. Vector illustration design using ai tool. Decrease diagram vector vectors Recession chart. Blue and red lines show economic decline. Vector illustration design using ai tool.
Free with trial Carbon neutral, co2 gas emissions reduction vector icon, eps 10 file, easy to edit. Decrease diagram vector vectors Carbon neutral, co2 gas emissions reduction icon. carbon neutral, co2 gas emissions reduction vector icon, eps 10 file, easy to edit
Free with trial Vector Illustration. Stock Price Fall. Arrow On Chart Pointing Down. Bear Head. Stock Market Concept. Decrease diagram vector vectors Bear Market Icon Color. Vector Illustration. Stock Price Fall. Arrow On Chart Pointing Down. Bear Head. Stock Market Concept
Free with trial Bitcoin icons High-Quality Vector Icons Collection with Editable Stroke. Ideal for Professional and Creative Projects. Decrease diagram vector vectors Bitcoin icons High-Quality Vector Icons Collection with Editable Stroke. Ideal for Professional and Creative Projects.
Free with trial Vector illustration of a red arrow trending down. Decrease diagram vector vectors Red arrow downward trend. vector illustration of a red arrow trending down
Free with trial This image features two variations of a graph icon showing a downward trend. One is a simple outline, while the other is a solid black silhouette. Both depict a graph with a sharp decline, represented by a line with a downward-pointing arrow. The icons are suitable for illustrating concepts like financial loss, economic downturn, negative growth, or any situation involving a decrease in value or performance. Decrease diagram vector illustrations Declining Graph Icon Set. This image features two variations of a graph icon showing a downward trend. One is a simple outline, while the other is a solid black silhouette. Both depict a graph with a sharp decline, represented by a line with a downward-pointing arrow. The icons are suitable for illustrating concepts like financial loss, economic downturn, negative growth, or any situation involving a decrease in value or performance.
Free with trial Three red, 3D arrows curving downwards, generated by AI, symbolize decline, decrease, or downturn. The image offers a visual representation of negative trends or a downward trajectory, suitable for presentations or reports. Decrease diagram vector illustrations Red Arrows Pointing Down. Three red, 3D arrows curving downwards, generated by AI, symbolize decline, decrease, or downturn. The image offers a visual representation of negative trends or a downward trajectory, suitable for presentations or reports.
Free with trial This image features two variations of a decreasing graph icon. One is an outline version, and the other is a solid black version. Both show a bar graph with descending bars and a curved arrow pointing downwards, symbolizing a decline or decrease. These icons are suitable for illustrating concepts like loss, recession, negative trends, or falling statistics in various contexts. Decrease diagram vector illustrations Decreasing Graph Icon Set. This image features two variations of a decreasing graph icon. One is an outline version, and the other is a solid black version. Both show a bar graph with descending bars and a curved arrow pointing downwards, symbolizing a decline or decrease. These icons are suitable for illustrating concepts like loss, recession, negative trends, or falling statistics in various contexts.
Free with trial A black outline icon featuring a rectangular frame with a horizontal line in the center, symbolizing a minimize function, a minus button, or a subtraction operation. This minimalist vector graphic is isolated on a clean white background, making it versatile for web design, app interfaces, software development, and educational materials. Represents reduction, removal, or collapsing elements. Generated by AI. Decrease diagram vector vectors Minimize Window Outline Icon. A black outline icon featuring a rectangular frame with a horizontal line in the center, symbolizing a minimize function, a minus button, or a subtraction operation. This minimalist vector graphic is isolated on a clean white background, making it versatile for web design, app interfaces, software development, and educational materials. Represents reduction, removal, or collapsing elements. Generated by AI
Free with trial Graph of Fixed cost, variable costs, mixed cost to compare vector. Decrease diagram vector vectors Graph of Fixed cost, variable costs, mixed cost to compare
Free with trial A simple line graph illustration showing fluctuations and an upward trend. The graph is drawn on a grid with a black line and red data points, indicating a period of increase, followed by a decrease, and then a final increase. This image can be used to represent business trends, financial analysis, stock market data, or any data that shows changes over time. Decrease diagram vector vectors Line Graph with Fluctuations. A simple line graph illustration showing fluctuations and an upward trend. The graph is drawn on a grid with a black line and red data points, indicating a period of increase, followed by a decrease, and then a final increase. This image can be used to represent business trends, financial analysis, stock market data, or any data that shows changes over time.
Free with trial Vector Icon Global Warming, Tsunami, Fire, Earthquake, and More. Decrease diagram vector vectors Climate Change Icon Set. Vector Icon Global Warming, Tsunami, Fire, Earthquake, and More
Free with trial Upward and downward zigzag arrow line icon vector with long shadow. Decrease diagram vector vectors Upward and downward zigzag arrow line icon with long shadow
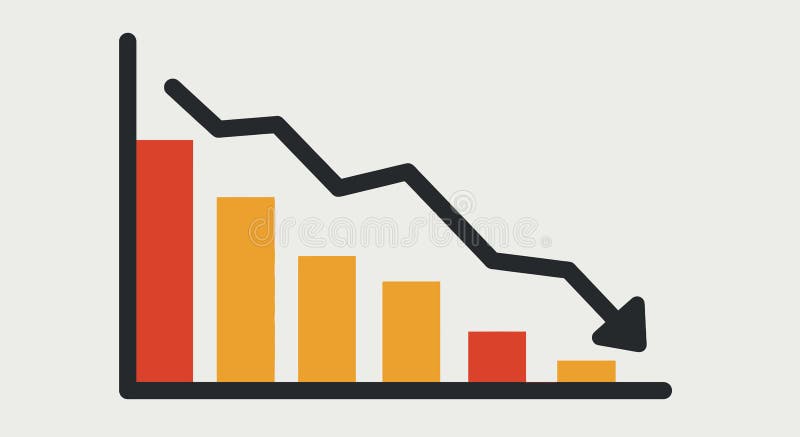
Free with trial A stylized illustration depicts a bar chart with blue bars of varying heights against a dark blue grid background. A prominent red and yellow arrow, symbolizing a downward trend, dramatically descends across the chart. This graphic represents financial decline, market crash, economic recession, or negative growth. Its clean, vector-style design makes it suitable for presentations, reports, and articles on business, finance, and economics. Decrease diagram vector illustrations Declining Bar Chart with Red Arrow. A stylized illustration depicts a bar chart with blue bars of varying heights against a dark blue grid background. A prominent red and yellow arrow, symbolizing a downward trend, dramatically descends across the chart. This graphic represents financial decline, market crash, economic recession, or negative growth. Its clean, vector-style design makes it suitable for presentations, reports, and articles on business, finance, and economics.
Free with trial Stock market crash. Red 3D down arrow and 3D coins with bitcoin symbol. Cryptocurrency crash, crypto trading. Design for banners, posters and advertising materials. Vector illustration. Decrease diagram vector vectors Stock market crash. Red 3D down arrow and 3D coins with bitcoin symbol. Cryptocurrency crash
Free with trial Upward and downward zigzag arrow line icon vector on square background. Decrease diagram vector vectors Upward and downward zigzag arrow line icon on square background
Free with trial Upward and downward zigzag arrow line icon vector on circle background. Decrease diagram vector vectors Upward and downward zigzag arrow line icon on circle background
Free with trial Economics Financial Loss Analytics chart vector illustration. Decrease diagram vector vectors Economics Financial Loss Analytics chart
Free with trial A versatile set of business and finance icons isolated on a white background. This collection features various data visualization elements, including bar charts, line graphs, pie charts, and diagrams. The clean, vector style represents concepts like statistical analysis, market growth, financial reporting, and economic trends. These infographic elements are perfect for presentations, business reports, websites, and marketing materials to illustrate progress, performance, and data-driven insights. Decrease diagram vector vectors Business and Finance Chart and Graph Icon Set. A versatile set of business and finance icons isolated on a white background. This collection features various data visualization elements, including bar charts, line graphs, pie charts, and diagrams. The clean, vector style represents concepts like statistical analysis, market growth, financial reporting, and economic trends. These infographic elements are perfect for presentations, business reports, websites, and marketing materials to illustrate progress, performance, and data-driven insights.
Free with trial A modern flat design icon representing financial data analysis and market trends. This vector illustration features a combination of a green bar chart and a dark grey line graph, showing fluctuations in performance. An upward arrow indicates initial growth, followed by a volatile trend line symbolizing concepts like market instability, economic changes, profit and loss, or business analytics. This versatile graphic is perfect for infographics, financial reports, presentations, websites, and applications related to business, finance, statistics, and economics. Isolated on a white background for easy use. Decrease diagram vector vectors Financial Market Fluctuation Graph Icon. A modern flat design icon representing financial data analysis and market trends. This vector illustration features a combination of a green bar chart and a dark grey line graph, showing fluctuations in performance. An upward arrow indicates initial growth, followed by a volatile trend line symbolizing concepts like market instability, economic changes, profit and loss, or business analytics. This versatile graphic is perfect for infographics, financial reports, presentations, websites, and applications related to business, finance, statistics, and economics. Isolated on a white background for easy use.
Free with trial Economic crisis icon of economy depreciation and business downturn, vector line symbol. Banking investment recession, stock exchange trade fall and money value inflation icon of financial crisis. Decrease diagram vector vectors Economic crisis icon economy business depreciation. Economic crisis icon of economy depreciation and business downturn, vector line symbol. Banking investment recession, stock exchange trade fall and money value inflation icon of financial crisis
Free with trial Reduction chart icon vector logo set collection for web app ui. Decrease diagram vector vectors Reduction chart icon Thin line illustration set. Reduction chart icon vector logo set collection for web app ui
Free with trial Red and Black Line Diagram Icon. Decrease diagram vector vectors Bankrupt and diagram icon concept. Red and Black Line Diagram Icon
Free with trial Black and Blue Line Diagram and Report Icon. Decrease diagram vector illustrations Bankrupt and diagram icon concept. Black and Blue Line Diagram and Report Icon
Free with trial Red and Black Line Diagram Icon. Decrease diagram vector vectors Low Sales and diagram icon concept. Red and Black Line Diagram Icon
Free with trial Financial crisis. The collapse of the economy. Bankruptcy, economic downturn. Vector illustration on white background. Decrease diagram vector illustrations Financial crisis. The collapse of the economy. Bankruptcy, economic downturn
Free with trial Line art vector icon of stacks of coins with some arrows pointing up and some pointing down, representing market volatility. Decrease diagram vector vectors Money increasing and decreasing showing market volatility icon. Line art vector icon of stacks of coins with some arrows pointing up and some pointing down, representing market volatility
Free with trial Ascending and descending graph set. Vector illustration. Decrease diagram vector vectors Ascending and descending graph set.
Free with trial Office supplies web icons set in duotone flat design. Pack pictograms with manager, presentation, contract, email, briefcase, brainstorm, coffee maker, call, file folder, other. Vector illustration. Decrease diagram vector vectors Office supplies web icons set in duotone flat design. Pack pictograms with manager, presentation, contract, email
Free with trial A vector illustration showing a magnifying glass focused on a bar graph and line chart indicating growth. The magnifying glass has a blue frame and red handle. The chart depicts an upward trend, suggesting positive business performance. This image is suitable for illustrating data analysis, business strategy, market research, and financial growth concepts. Decrease diagram vector vectors Analyzing Growth: Magnifying Glass on Business Chart. A vector illustration showing a magnifying glass focused on a bar graph and line chart indicating growth. The magnifying glass has a blue frame and red handle. The chart depicts an upward trend, suggesting positive business performance. This image is suitable for illustrating data analysis, business strategy, market research, and financial growth concepts.
Free with trial Red and Black Line Diagram Icon. Decrease diagram vector vectors Investment Loss and diagram icon concept. Red and Black Line Diagram Icon
Free with trial Black and Blue Line Diagram and Report Icon. Decrease diagram vector illustrations Investment Loss and diagram icon concept. Black and Blue Line Diagram and Report Icon
Free with trial Creative Up and Down Arrow Set with Percentage for Business and Finance and Pictogram Element Vector Illustration Isolated on Transparent Background. Decrease diagram vector vectors Up and Down Arrow with Percent Set Icon Clipart Vector Illustration. Creative Up and Down Arrow Set with Percentage for Business and Finance and Pictogram Element Vector Illustration Isolated on Transparent Background
Free with trial Arrow trend-down icon. Decrease diagram vector vectors Arrow trend-down vector icon set in black and white outlines. Arrow trend-down icon
Free with trial A flat vector illustration depicting a business downturn and bankruptcy. A graph with a sharp downward trend terminates in a broken light bulb, symbolizing failure. Isolated on a white background for versatility. Decrease diagram vector illustrations Dramatic Business Decline: Graph Ends in Broken Bulb Symbolizing Failure. 8k. A flat vector illustration depicting a business downturn and bankruptcy. A graph. A flat vector illustration depicting a business downturn and bankruptcy. A graph with a sharp downward trend terminates in a broken light bulb, symbolizing failure. Isolated on a white background for versatility
Free with trial 3d cylinder chart showing downward trend. Business and finance decline vector illustration. Decrease diagram vector vectors 3d cylinder chart showing downward trend. Business and finance decline illustration
Free with trial Report line icon. Neumorphic, Flat shadow, 3d buttons. Column graph, pie chart sign. Market analytics symbol. Line report icon. Social media icons. Vector. Decrease diagram vector vectors Report line icon. Column graph, pie chart sign. Neumorphic buttons. Vector. Report line icon. Neumorphic, Flat shadow, 3d buttons. Column graph, pie chart sign. Market analytics symbol. Line report icon. Social media icons. Vector
Free with trial Dollar down arrow icon. Economic downtrend symbol. Business decline sign vector. Decrease diagram vector vectors Dollar down arrow icon. Economic downtrend symbol. Business decline sign
Free with trial Three stacked Jack O' Lantern pumpkins with carved, sharp, triangular eyes and jagged mouths, creating a spooky expression. Each pumpkin is orange with yellow and red highlights emphasizing the facial features. The pumpkins decrease in size from bottom to top, and the top one has a short, green stem. The image is simple and cartoon-like, with a white background. Decrease diagram vector vectors Stacked Halloween Jack O Lantern pumpkins with a spooky grin. Three stacked Jack O' Lantern pumpkins with carved, sharp, triangular eyes and jagged mouths, creating a spooky expression. Each pumpkin is orange with yellow and red highlights emphasizing the facial features. The pumpkins decrease in size from bottom to top, and the top one has a short, green stem. The image is simple and cartoon-like, with a white background.
Free with trial Up and Down Arrow Set with Percentage for Business and Finance and Pictogram Element Vector Illustration Isolated on Transparent Background. Decrease diagram vector vectors Creative Percentage Up and Down Arrow Set Icon Clipart Vector Illustration. Up and Down Arrow Set with Percentage for Business and Finance and Pictogram Element Vector Illustration Isolated on Transparent Background
Free with trial Dot plot graph line icon. Neumorphic, Flat shadow, 3d buttons. Presentation chart sign. Market analytics symbol. Line dot plot icon. Social media icons. Vector. Decrease diagram vector illustrations Dot plot graph line icon. Presentation chart sign. Neumorphic buttons. Vector. Dot plot graph line icon. Neumorphic, Flat shadow, 3d buttons. Presentation chart sign. Market analytics symbol. Line dot plot icon. Social media icons. Vector
Free with trial Growth and declining graph bar icon with flat rounded cartoon style. Charts with bar growth and declining. Graph trending upwards arrow and downwards arrow. Eps 10 vector illustration. Decrease diagram vector vectors Growth and declining graph bar icon with flat rounded cartoon style
Free with trial Reduction chart icon set in thin line outline style and linear vector sign. Decrease diagram vector vectors Reduction chart icon thin line illustration. Reduction chart icon set in thin line outline style and linear vector sign
Free with trial Up and down graph icon in line style. Outline bar chart with uptrend and downtrend arrow symbol vector. Decrease diagram vector vectors Up and down graph icon in line style. Outline bar chart with uptrend and downtrend arrow symbol
Free with trial A small and simple infographic showing the abstract dynamics of declining prices in the offshore oil and gas industry. Vector illustration. Decrease diagram vector vectors Infographic of price decline in the offshore oil and gas industry. A small and simple infographic showing the abstract dynamics of declining prices in the offshore oil and gas industry. Vector illustration.
Free with trial Economy business crisis and graph investment down on red background. arrow trading chart candlestick fall. vector illustration fantastic technology. Decrease diagram vector vectors Economy business crisis and graph investment down on red background. arrow trading chart candlestick fall.
Free with trial Clean and simple abstract infographic about falling prices in the oil industry. Vector illustration. Decrease diagram vector vectors A simple infographic about falling oil industry prices. Clean and simple abstract infographic about falling prices in the oil industry. Vector illustration.
Free with trial Graph line icons. Interest rate, AI generate, Inflation icons. Set of Chart presentation, Report, Increase growth graph icons. Analytics testing, Falling demand, Pie chart report. Vector. Decrease diagram vector vectors Graph line icons. Set of Chart presentation, Report and Increase growth graph icons. App line icons. Vector. Graph line icons. Interest rate, AI generate, Inflation icons. Set of Chart presentation, Report, Increase growth graph icons. Analytics testing, Falling demand, Pie chart report. Vector
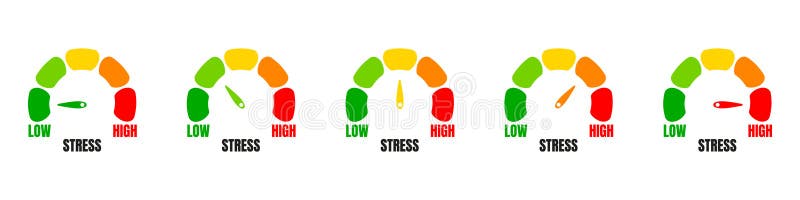
Free with trial Stress level meter, progress bar gauge isolated over white background, stress meter vector medical illustration. vector. Decrease diagram vector vectors Stress level meter, progress bar gauge isolated over white background, stress meter vector medical illustration
Free with trial Graph up and down icon vector in circular line. Outline bar chart with arrow symbol. Analytics concept. Decrease diagram vector vectors Graph up and down icon in circular line. Outline bar chart with arrow symbol. Analytics concept
Free with trial Financial crisis, business bankruptcy, money loss, and economy collapse concepts. Vector of crisis financial, bankruptcy and recession illustration. Decrease diagram vector vectors Financial crisis, business bankruptcy, money loss, and economy collapse concepts
Free with trial Business decline icon with downward arrow. Loss, failure, or economic crisis symbol vector in black circle. Decrease diagram vector vectors Business decline icon with downward arrow. Loss, failure, or economic crisis symbol in black circle
Free with trial Interest growth icon Black line art vector in black and white outline set collection sign. Decrease diagram vector vectors Financial Icon Illustrating Growth, Investment Success, and Economic Prosperity. Interest growth icon Black line art vector in black and white outline set collection sign
Free with trial Line graph up and down icon in black circle. Outline bar chart with arrow symbol vector. Analytics concept. Decrease diagram vector vectors Line graph up and down icon in black circle. Outline bar chart with arrow symbol. Analytics concept
Free with trial Dollar Vector illustration on a transparent background. Premium quality symmbols. Line Color vector icons for concept and graphic design. Decrease diagram vector vectors Dollar network money banking investment. Dollar Vector illustration on a transparent background. Premium quality symmbols. Line Color vector icons for concept and graphic design
Free with trial Abstract vector illustration of colorful bar graphs for business analysis and trends. Decrease diagram vector vectors Multiple colorful bar charts abstractly representing data and statistics. Abstract vector illustration of colorful bar graphs for business analysis and trends.
Free with trial Report line icon. Continuous line with share plane. Column graph, pie chart sign. Market analytics symbol. 3d heart in speech bubble. Report single line ribbon. Loop curve pattern. Vector. Decrease diagram vector vectors Report line icon. Column graph, pie chart sign. Continuous line with plane. Vector. Report line icon. Continuous line with share plane. Column graph, pie chart sign. Market analytics symbol. 3d heart in speech bubble. Report single line ribbon. Loop curve pattern. Vector
Free with trial The graph of the economy went down, the growth of unemployment. Market trading problems. Women are sitting on the graph and are sad vector illustration. Business is low and arrow fall. Lost money. Decrease diagram vector vectors The graph of the economy went down, the growth of unemployment. Market trading problems. Women are sitting on the graph and are
Free with trial Growth and decline. Business chart icon. Profit loss symbol. Vector illustration. EPS 10. Decrease diagram vector vectors Growth and decline. Business chart icon. Profit loss symbol. Vector illustration.
Free with trial Vector icons showing business growth and decline trends with arrows and magnifying glass for detailed analysis, representing financial and market data in a clear style. Professional and informative. Generative AI. Decrease diagram vector vectors Business growth and decline infographic icons with arrows and magnifying glass for analysis. Vector icons showing business growth and decline trends with arrows and magnifying glass for detailed analysis, representing financial and market data in a clear style. Professional and informative. Generative AI
Free with trial Uptrend and downtrend business chart icon. Economic growth and decline symbol with green up and red down arrow vector. Decrease diagram vector vectors Uptrend and downtrend business chart icon. Economic growth and decline symbol with green up and red down arrow
Free with trial Data analysis graphs with up and down arrow line icons set. Increase and reduction of economy or trend charts, price boost, stock market research thin black and red outline symbols vector illustration. Decrease diagram vector vectors Data analysis graphs with up and down arrow, economy or trend charts line icons set. Data analysis graphs with up and down arrow line icons set. Increase and reduction of economy or trend charts, price boost, stock market research thin black and red outline symbols vector illustration
Free with trial Increase and reduction of economy or trend charts, price boost, stock market research thin black outline symbols vector illustration. Data analysis graphs with up and down arrow line icons set. Decrease diagram vector vectors Data analysis graphs with up and down arrow, economy or trend charts line icons set. Increase and reduction of economy or trend charts, price boost, stock market research thin black outline symbols vector illustration. Data analysis graphs with up and down arrow line icons set.
Free with trial Graph going Up and Down sign with green and red arrows vector set. Flat design vector set of a concept of sales bar chart symbol icon with arrow moving down and sales bar chart with arrow moving up. Decrease diagram vector vectors Graph going Up and Down sign with green and red arrows vector set. Vector set of a concept of sales bar chart symbol icon. Graph going Up and Down sign with green and red arrows vector set. Flat design vector set of a concept of sales bar chart symbol icon with arrow moving down and sales bar chart with arrow moving up.
Free with trial Up and Down sign with green and red arrows set vector illustration. Set of a Concept of sales bar chart symbol icon with arrow moving down and sales bar chart with arrow moving up. Decrease diagram vector vectors Up and Down sign with green and red arrows set vector illustration. Set of a Concept of sales bar chart symbol icon with arrows. Up and Down sign with green and red arrows set vector illustration. Set of a Concept of sales bar chart symbol icon with arrow moving down and sales bar chart with arrow moving up.
Free with trial Graph going Up and Down with red arrows vector. Blue chart bar vector illustration concept of sales bar chart symbol icon with arrow moving down and sales bar chart with arrow moving up. Decrease diagram vector vectors Graph going Up and Down with red arrows vector. Blue chart bar vector illustration concept of sales bar chart symbol icon
Free with trial Set of Chart presentation, Report, Increase growth graph icons. Design shape elements. Graph line icons. Analytics testing, Falling demand, Pie chart report. Calendar statistics, Stats. Vector. Decrease diagram vector vectors Graph line icons. Set of Chart presentation, Report and Increase growth graph icons. Design elements. Vector. Set of Chart presentation, Report, Increase growth graph icons. Design shape elements. Graph line icons. Analytics testing, Falling demand, Pie chart report. Calendar statistics, Stats. Vector
Free with trial A simple vector illustration of a graph showing a sharp downward trend, representing a financial crisis or market decline. Perfect for illustrating economic downturn concepts. Decrease diagram vector vectors Trending Downward Graph Financial Crisis Icon Stock Market Decline Illustration. A simple vector illustration of a graph showing a sharp downward trend, representing a financial crisis or market decline. Perfect for illustrating economic downturn concepts.
Free with trial Graph going Up and Down with green and red arrows vector. Blue chart bar vector illustration concept of sales bar chart symbol icon with arrow moving down and sales bar chart with arrow moving up. Decrease diagram vector vectors Graph going Up and Down with green and red arrows vector. Blue chart bar vector illustration concept of sales bar chart symbol. Graph going Up and Down with green and red arrows vector. Blue chart bar vector illustration concept of sales bar chart symbol icon with arrow moving down and sales bar chart with arrow moving up.
Free with trial Line graph up and down icon vector. Outline bar chart with arrow symbol. Analytics concept. Decrease diagram vector vectors Line graph up and down icon. Outline bar chart with arrow symbol. Analytics concept