Free with trial This compelling image depicts a visual representation of the current state of the real estate market. Wooden houses, symbolic of residential properties, are nestled within an empty shopping cart. A red downward-trending chart, overlaid with a soft bokeh effect, graphically illustrates the negative market trend. This visual narrative conveys a significant drop in sales, a decrease in property. Decrease financial trends illustrations Wooden Homes in Shopping Cart A Visual Representation of the Declining Real Estate Market and Reduced Demand. This compelling image depicts a visual representation of the current state of the real estate market. Wooden houses, symbolic of residential properties, are nestled within an empty shopping cart. A red downward-trending chart, overlaid with a soft bokeh effect, graphically illustrates the negative market trend. This visual narrative conveys a significant drop in sales, a decrease in property
Free with trial Declining fuel prices are visually represented by a downward red arrow intersecting a falling bar graph and a red dispenser suggesting financial relief and market trends Use for economic reports. Decrease financial trends illustrations Fuel Price Decreasing Concept with Red Arrow and Dispenser. Declining fuel prices are visually represented by a downward red arrow intersecting a falling bar graph and a red dispenser suggesting financial relief and market trends Use for economic reports
Free with trial A person holds a hand-drawn graph depicting a sharp market decline, generated by AI. The image symbolizes economic downturn, financial loss, or market instability. It's a visual representation perfect for illustrating articles or presentations about economic trends. Decrease financial trends illustrations Declining Market Trend. A person holds a hand-drawn graph depicting a sharp market decline, generated by AI. The image symbolizes economic downturn, financial loss, or market instability. It's a visual representation perfect for illustrating articles or presentations about economic trends.
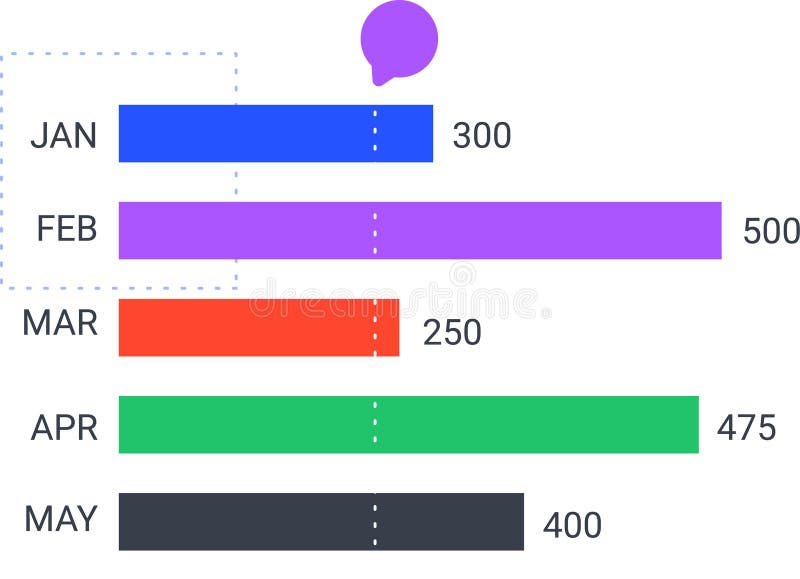
Free with trial Colorful horizontal bar chart is displaying monthly statistics from january to may, indicating trends and performance with a speech bubble above. Decrease financial trends vectors Colorful horizontal bar chart is displaying monthly statistics from january to may, indicating trends and performance
Free with trial This sleek, minimalist linear bar graph is perfect for showcasing downward trends in your business data. Ideal for presentations, reports, and dashboards, this editable graphic allows you to easily customize stroke width and colors to match your brand. The clean design and simple layout make complex data easily digestible, highlighting key performance indicators and areas needing attention. Decrease financial trends illustrations Editable Linear Bar Graph Visualize Downward Trends for Powerful Business Analytics Reports and Presentations. This sleek, minimalist linear bar graph is perfect for showcasing downward trends in your business data. Ideal for presentations, reports, and dashboards, this editable graphic allows you to easily customize stroke width and colors to match your brand. The clean design and simple layout make complex data easily digestible, highlighting key performance indicators and areas needing attention.
Free with trial Interest growth icon vector logo set collection for web app ui. Decrease financial trends vectors Interest Growth Icon Showing Financial Increase, Investment Success, and Economic Trends. Interest growth icon vector logo set collection for web app ui
Free with trial A futuristic bear walking through a glowing urban cityscape with stock market data charts and graphs symbolizing a bearish financial market trend. Generative AI. Decrease financial trends illustrations A futuristic bear walking through a glowing urban cityscape with stock market data charts and graphs symbolizing a bearish
Free with trial Image of businessman standing in modern office with hands on head looking distressed at large screen displaying fluctuating financial red charts indicating bear market. Recession, stock market concept. Decrease financial trends illustrations Image of businessman standing in modern office with hands on head looking distressed at large screen displaying fluctuating
Free with trial A close-up of a magnifying glass focusing on vibrant financial charts, illustrating trends and market analysis, Generative AI. Decrease financial trends illustrations Magnifying glass over a falling interest rate chart, detailed analysis of economic trends. A close-up of a magnifying glass focusing on vibrant financial charts, illustrating trends and market analysis, Generative AI.
Free with trial A close-up view of a monitor displaying complex financial data, including stock market charts and numerical values. Stock market Data Displayed on a Monitor. Decrease financial trends illustrations Stock market Data Displayed on a Monitor
Free with trial Image of businessman standing in modern office with hands on head looking distressed at large screen displaying fluctuating financial red charts indicating bear market. Recession, stock market concept. Decrease financial trends illustrations Image of businessman standing in modern office with hands on head looking distressed at large screen displaying fluctuating
Free with trial Image of businessman standing in modern office with hands on head looking distressed at large screen displaying fluctuating financial red charts indicating bear market. Recession, stock market concept. Decrease financial trends illustrations Image of businessman standing in modern office with hands on head looking distressed at large screen displaying fluctuating
Free with trial Professional monitoring business expenses. Woman at desk, assessing financial charts with declining trends and dollar signs. Cost management and reduction focus. Flat vector illustration. Decrease financial trends vectors Professional monitoring business expenses. Woman
Free with trial A 3D icon depicting an orange arrow pointing downwards in a zigzag pattern. The icon suggests downward movement, decline, decrease, or negative progress. It's commonly used to represent falling trends, negative changes, or downward movement in data or statistics. Decrease financial trends vectors Arrow Chart Down 3D Icon. A 3D icon depicting an orange arrow pointing downwards in a zigzag pattern. The icon suggests downward movement, decline, decrease, or negative progress. It's commonly used to represent falling trends, negative changes, or downward movement in data or statistics.
Free with trial Professional monitoring business expenses. Woman at desk, assessing financial charts with declining trends and dollar signs. Cost management and reduction focus. Flat vector illustration. Decrease financial trends vectors Professional monitoring business expenses. Woman at desk, assessing
Free with trial A vibrant red arrow points downward, resting on a silver coin, signifying a market decline. This 3D rendering, generated by AI, visually represents economic downturn or price reduction. Use it to illustrate concepts related to financial loss, market trends, and economic instability. Decrease financial trends illustrations Falling Prices. A vibrant red arrow points downward, resting on a silver coin, signifying a market decline. This 3D rendering, generated by AI, visually represents economic downturn or price reduction. Use it to illustrate concepts related to financial loss, market trends, and economic instability.
Free with trial A downward trending red arrow, generated by AI, rests on a smartphone displaying a graph, symbolizing a market decline. This visualization is a powerful representation of negative financial trends and economic downturn, ideal for illustrating news reports or financial analyses. Decrease financial trends illustrations Mobile Market Crash. A downward trending red arrow, generated by AI, rests on a smartphone displaying a graph, symbolizing a market decline. This visualization is a powerful representation of negative financial trends and economic downturn, ideal for illustrating news reports or financial analyses.
Free with trial A hand-drawn chart on a napkin depicts a market downturn, alongside cash and coins. This image, generated by AI, symbolizes economic uncertainty and the informal nature of financial planning. It visually represents potential anxieties surrounding investments and personal finances. Decrease financial trends illustrations Napkin Market Crash. A hand-drawn chart on a napkin depicts a market downturn, alongside cash and coins. This image, generated by AI, symbolizes economic uncertainty and the informal nature of financial planning. It visually represents potential anxieties surrounding investments and personal finances.
Free with trial A close-up of a stock market chart showing a sharp downturn. The orange line graph against a dark background with gridlines illustrates the volatility and potential risks in financial markets. The image captures the urgency and anxiety associated with market fluctuations. The "MA 1000" text is visib. Decrease financial trends illustrations Stock Market Downturn. A close-up of a stock market chart showing a sharp downturn. The orange line graph against a dark background with gridlines illustrates the volatility and potential risks in financial markets. The image captures the urgency and anxiety associated with market fluctuations. The "MA 1000" text is visib
Free with trial A 3D rendered illustration depicting business growth. The image showcases two upward-trending arrow charts, one in gold and the other in blue, representing positive trends, progress, and success. The charts are set against a clean, light background, emphasizing the upward movement and potential for financial gain. Suitable for illustrating economic growth, investment strategies, and business performance. Decrease financial trends illustrations Growth Chart with Arrows. A 3D rendered illustration depicting business growth. The image showcases two upward-trending arrow charts, one in gold and the other in blue, representing positive trends, progress, and success. The charts are set against a clean, light background, emphasizing the upward movement and potential for financial gain. Suitable for illustrating economic growth, investment strategies, and business performance.
Free with trial A 3D rendering shows a red arrow plummeting downwards, disintegrating into particles. This dramatic visualization, generated by AI, symbolizes market decline and financial instability. The image is perfect for illustrating economic downturns or similar concepts. Decrease financial trends illustrations Crumbling Market Trends. A 3D rendering shows a red arrow plummeting downwards, disintegrating into particles. This dramatic visualization, generated by AI, symbolizes market decline and financial instability. The image is perfect for illustrating economic downturns or similar concepts.
Free with trial A computer displays a dramatic downward trending graph, generated by AI, symbolizing a market crash or economic downturn. The image is a 3D rendering showing a clean, modern workspace setting, highlighting the severity of the financial decline depicted on screen. Decrease financial trends illustrations Market Crash Simulation. A computer displays a dramatic downward trending graph, generated by AI, symbolizing a market crash or economic downturn. The image is a 3D rendering showing a clean, modern workspace setting, highlighting the severity of the financial decline depicted on screen.
Free with trial A minimalist bar chart with a descending line graph overlay, symbolizing financial loss, performance decline, or negative data trends. Ideal for presentations, dashboards, economic reports, and warning visuals. Decrease financial trends vectors Downward Trend Bar Chart Icon. A minimalist bar chart with a descending line graph overlay, symbolizing financial loss, performance decline, or negative data trends. Ideal for presentations, dashboards, economic reports, and warning visuals
Free with trial A simple, bold red arrow trending downwards against a white background. The arrow zigzags downwards, ending with an arrowhead pointing down, resting on a horizontal red line. This image represents concepts like financial loss, economic downturn, market crash, failure, and negative trends. It's suitable for illustrating articles, presentations, or reports dealing with business, finance, and economics. Decrease financial trends illustrations Red Downward Trend Arrow. A simple, bold red arrow trending downwards against a white background. The arrow zigzags downwards, ending with an arrowhead pointing down, resting on a horizontal red line. This image represents concepts like financial loss, economic downturn, market crash, failure, and negative trends. It's suitable for illustrating articles, presentations, or reports dealing with business, finance, and economics.
Free with trial A hand holds a piece of paper showing a sharply declining graph, representing a downturn in the market. The image is generated by AI and symbolizes financial loss or economic recession. Decrease financial trends illustrations Falling Stock Market Graph. A hand holds a piece of paper showing a sharply declining graph, representing a downturn in the market. The image is generated by AI and symbolizes financial loss or economic recession.
Free with trial A collection of hand-drawn, black and white icons representing growth, decline, and financial concepts. The set includes upward and downward arrows, percentage symbols, and a bar graph illustrating trends. The simple line art style makes these icons versatile for various applications, including presentations, infographics, and website design. They convey concepts of progress, success, loss, and market fluctuations. Decrease financial trends illustrations Growth and Decline Icons Set. A collection of hand-drawn, black and white icons representing growth, decline, and financial concepts. The set includes upward and downward arrows, percentage symbols, and a bar graph illustrating trends. The simple line art style makes these icons versatile for various applications, including presentations, infographics, and website design. They convey concepts of progress, success, loss, and market fluctuations.
Free with trial Image of a stock market chart with a red and blue candlestick pattern, plotted on a dark grid, suggesting financial trends and investment analysis. Image is generated using AI. Decrease financial trends illustrations Stock Market Chart on a Grid. Image of a stock market chart with a red and blue candlestick pattern, plotted on a dark grid, suggesting financial trends and investment analysis. Image is generated using AI
Free with trial A simple line graph illustration showing fluctuations and an upward trend. The graph is drawn on a grid with a black line and red data points, indicating a period of increase, followed by a decrease, and then a final increase. This image can be used to represent business trends, financial analysis, stock market data, or any data that shows changes over time. Decrease financial trends vectors Line Graph with Fluctuations. A simple line graph illustration showing fluctuations and an upward trend. The graph is drawn on a grid with a black line and red data points, indicating a period of increase, followed by a decrease, and then a final increase. This image can be used to represent business trends, financial analysis, stock market data, or any data that shows changes over time.
Free with trial A tablet displays a colorful bar graph, showcasing data trends. The image emphasizes visual data analysis and modern business tools. The warm wood background adds a professional yet inviting feel. Decrease financial trends illustrations Tablet Showing Business Graph. A tablet displays a colorful bar graph, showcasing data trends. The image emphasizes visual data analysis and modern business tools. The warm wood background adds a professional yet inviting feel.
Free with trial This whiteboard displays hand-drawn charts illustrating a sharp market decline. The red lines, representing a dramatic downturn, are prominently featured, alongside other less defined financial graphs. This image was generated by AI for illustrative purposes. Decrease financial trends illustrations Red Ink Market Crash Whiteboard. This whiteboard displays hand-drawn charts illustrating a sharp market decline. The red lines, representing a dramatic downturn, are prominently featured, alongside other less defined financial graphs. This image was generated by AI for illustrative purposes.
Free with trial Black and white line icons depicting currency devaluation, falling stocks, and market data analysis. Decrease financial trends vectors Financial downturn and market analysis icons. Black and white line icons depicting currency devaluation, falling stocks, and market data analysis
Free with trial A 3D rendered image of a metallic percentage sign with arrows pointing both upwards and downwards. The upward arrow on top and downward arrow on the bottom symbolize the fluctuating nature of interest rates, inflation, or market trends. The metallic texture adds a sense of solidity and importance to the concept. Suitable for financial, economic, or business-related content. Decrease financial trends illustrations Fluctuating Interest Rates Concept. A 3D rendered image of a metallic percentage sign with arrows pointing both upwards and downwards. The upward arrow on top and downward arrow on the bottom symbolize the fluctuating nature of interest rates, inflation, or market trends. The metallic texture adds a sense of solidity and importance to the concept. Suitable for financial, economic, or business-related content.
Free with trial A clean, minimalist 3D render of a blue bar chart with a blue trend line connecting circular data points. The bars vary in height, illustrating growth and fluctuations. The background is a bright, clean white, emphasizing the chart's elements. This graphic is ideal for representing financial data, business growth, market trends, statistics, and performance analysis in a modern and professional style. Decrease financial trends illustrations 3D Blue Bar Chart with Trend Line. A clean, minimalist 3D render of a blue bar chart with a blue trend line connecting circular data points. The bars vary in height, illustrating growth and fluctuations. The background is a bright, clean white, emphasizing the chart's elements. This graphic is ideal for representing financial data, business growth, market trends, statistics, and performance analysis in a modern and professional style.
Free with trial A bold, red, downward-pointing arrow graphic on a clean white background. This simple yet impactful visual represents decline, decrease, or negative trends. The design is clean and modern, making it suitable for various applications. It can be used to illustrate financial losses, falling sales, or any downward movement or negative trend. The image is versatile and can be used in presentations, reports, websites, and infographics. Decrease financial trends vectors Red Downward Arrow Icon on White Background. A bold, red, downward-pointing arrow graphic on a clean white background. This simple yet impactful visual represents decline, decrease, or negative trends. The design is clean and modern, making it suitable for various applications. It can be used to illustrate financial losses, falling sales, or any downward movement or negative trend. The image is versatile and can be used in presentations, reports, websites, and infographics.
Free with trial A conceptual representation of inflation captured through money and assorted objects. Ideal for financial topics and economic discussions. Decrease financial trends illustrations Analyzing Inflation Through Currency. A conceptual representation of inflation captured through money and assorted objects. Ideal for financial topics and economic discussions
Free with trial This image depicts a downward trending graph, generated by AI, illustrating a sharp decline in market performance. The 3D rendered red arrow emphasizes the severity of the fall. It symbolizes economic downturn, financial crisis, or market instability. Decrease financial trends illustrations Declining Market Trends. This image depicts a downward trending graph, generated by AI, illustrating a sharp decline in market performance. The 3D rendered red arrow emphasizes the severity of the fall. It symbolizes economic downturn, financial crisis, or market instability.
Free with trial A versatile set of business and finance icons isolated on a white background. This collection features various data visualization elements, including bar charts, line graphs, pie charts, and diagrams. The clean, vector style represents concepts like statistical analysis, market growth, financial reporting, and economic trends. These infographic elements are perfect for presentations, business reports, websites, and marketing materials to illustrate progress, performance, and data-driven insights. Decrease financial trends vectors Business and Finance Chart and Graph Icon Set. A versatile set of business and finance icons isolated on a white background. This collection features various data visualization elements, including bar charts, line graphs, pie charts, and diagrams. The clean, vector style represents concepts like statistical analysis, market growth, financial reporting, and economic trends. These infographic elements are perfect for presentations, business reports, websites, and marketing materials to illustrate progress, performance, and data-driven insights.
Free with trial This image shows a person's hand holding a smartphone displaying a stock market chart. In the background, a larger monitor mirrors similar stock data. The scene conveys trading, investment, and financial analysis through technology. The focus is on digital finance, with the smartphone symbolizing accessibility and immediacy in market engagement. The red and green lines in the graphs represent market fluctuations, essential for traders monitoring stock performance. Decrease financial trends illustrations Stock Trading on Smartphone: Analyzing Market Data. This image shows a person's hand holding a smartphone displaying a stock market chart. In the background, a larger monitor mirrors similar stock data. The scene conveys trading, investment, and financial analysis through technology. The focus is on digital finance, with the smartphone symbolizing accessibility and immediacy in market engagement. The red and green lines in the graphs represent market fluctuations, essential for traders monitoring stock performance.
Free with trial A clean, minimalist bar chart illustration set against a solid green background. The chart features three white vertical bars of different heights, representing data points or progress over time. A simple white grid and axes are visible, indicating a clear visual representation of statistics. This versatile graphic is ideal for conveying concepts of business growth, financial analysis, market trends, statistical reporting, or educational content in a modern, easy-to-understand format. Perfect for presentations, infographics, websites, and applications. Decrease financial trends vectors Minimalist Bar Chart Icon on Green Background. A clean, minimalist bar chart illustration set against a solid green background. The chart features three white vertical bars of different heights, representing data points or progress over time. A simple white grid and axes are visible, indicating a clear visual representation of statistics. This versatile graphic is ideal for conveying concepts of business growth, financial analysis, market trends, statistical reporting, or educational content in a modern, easy-to-understand format. Perfect for presentations, infographics, websites, and applications.
Free with trial A miniature wooden house model is depicted alongside a prominent white percentage symbol and a large red arrow pointing downwards, all resting on a light wooden surface. This visual metaphor effectively illustrates concepts related to falling housing prices, decreasing mortgage interest rates, or a general decline in the real estate market. It's ideal for financial news, economic reports, articles on property investment trends, or advertisements highlighting lower rates and market adjustments. The clean, minimalist composition emphasizes the critical financial message. Decrease financial trends illustrations Falling Home Prices and Mortgage Rates Concept. A miniature wooden house model is depicted alongside a prominent white percentage symbol and a large red arrow pointing downwards, all resting on a light wooden surface. This visual metaphor effectively illustrates concepts related to falling housing prices, decreasing mortgage interest rates, or a general decline in the real estate market. It's ideal for financial news, economic reports, articles on property investment trends, or advertisements highlighting lower rates and market adjustments. The clean, minimalist composition emphasizes the critical financial message.
Free with trial BALANCE BETWEEN THE DOLLAR AND THE EURO CURRENCY - Dollar against euro concept - Futuristic stock market background with charts, numbers, and financial trends. Decrease financial trends illustrations BALANCE BETWEEN THE DOLLAR AND THE EURO CURRENCY - Dollar against euro concept - Futuristic stock market background
Free with trial Percentage arrow up and down glyph icon with percent sign. Represents financial growth, decline, interest rates, banking, credit, investment, and economic trends. Decrease financial trends vectors Percentage Arrow Up and Down Glyph Icon
Free with trial 3D colorful pie chart and bar graph on a stack of documents illustrating business data and financial analysis. Perfect for presentations or reports. Decrease financial trends illustrations Colorful 3D Pie Chart and Bar Graph on Documents. 3D colorful pie chart and bar graph on a stack of documents illustrating business data and financial analysis. Perfect for presentations or reports.
Free with trial This image portrays the concept of analyzing stock market trends through the use of candlestick charts. The red candlestick represents a bearish trend, indicating a decrease in stock prices. The various lines and shapes on the chart represent patterns and indicators used by traders to predict future market movements. This image conveys the importance of careful analysis and strategic decision-making in the stock market. The flickering flame of the candlestick adds a sense of urgency and volatility to the overall message. Overall, this image is perfect for presentations or articles related to finance, trading, and investment. Decrease financial trends illustrations Red Candlestick Analysis: Stock Market Trading Charts. This image portrays the concept of analyzing stock market trends through the use of candlestick charts. The red candlestick represents a bearish trend, indicating a decrease in stock prices. The various lines and shapes on the chart represent patterns and indicators used by traders to predict future market movements. This image conveys the importance of careful analysis and strategic decision-making in the stock market. The flickering flame of the candlestick adds a sense of urgency and volatility to the overall message. Overall, this image is perfect for presentations or articles related to finance, trading, and investment.
Free with trial A girl stands confidently, pointing at a finance chart displayed on a large screen. Her expression is focused and determined, highlighting key trends and data that drive her presentation. Decrease financial trends illustrations The girl is pointing at the finance chart. A girl stands confidently, pointing at a finance chart displayed on a large screen. Her expression is focused and determined, highlighting key trends and data that drive her presentation.
Free with trial This vector icon set features graph diagrams with arrows indicating growth and decline. The icons represent business metrics and financial performance, with arrows pointing upward for growth and downward for decline. These symbols are ideal for visualizing trends, success, and changes in finance reports or business charts. The clean, simple design ensures clarity, making these icons suitable for use in presentations, reports, or dashboards to effectively communicate financial or business performance. Decrease financial trends vectors Growing up and down vector icon set. Graph diagram with arrow. Business growth success chart. Finance report symbol. This vector icon set features graph diagrams with arrows indicating growth and decline. The icons represent business metrics and financial performance, with arrows pointing upward for growth and downward for decline. These symbols are ideal for visualizing trends, success, and changes in finance reports or business charts. The clean, simple design ensures clarity, making these icons suitable for use in presentations, reports, or dashboards to effectively communicate financial or business performance.
Free with trial A stressed businessman in a suit stands on steps against a wall, holding a downward-trending red arrow graph, symbolizing economic recession, market decline, and financial crisis. The image represents business failure, loss, and negative trends, but also offers potential for problem-solving and finding solutions, generated by AI. Decrease financial trends illustrations Businessman holding downward trending red arrow graph. A stressed businessman in a suit stands on steps against a wall, holding a downward-trending red arrow graph, symbolizing economic recession, market decline, and financial crisis. The image represents business failure, loss, and negative trends, but also offers potential for problem-solving and finding solutions, generated by AI.
Free with trial A set of financial icons depicting market trends, investment growth, and money management, including charts, coins, and graphs for economic analysis. Decrease financial trends vectors Financial graph and money icons on transparent background. A set of financial icons depicting market trends, investment growth, and money management, including charts, coins, and graphs for economic analysis.
Free with trial A 3D rendering shows a red, downward-trending graph on a tablet screen, illustrating a market decline. The image, generated by AI, vividly represents financial loss and market instability. This visualization is ideal for illustrating economic trends and analysis. Decrease financial trends illustrations AI-Generated Market Decline Visualization. A 3D rendering shows a red, downward-trending graph on a tablet screen, illustrating a market decline. The image, generated by AI, vividly represents financial loss and market instability. This visualization is ideal for illustrating economic trends and analysis.
Free with trial This 3D graphic depicts a sharp market downturn, visualized with a red arrow plummeting downwards along a gridded bar chart. The image is generated by AI, offering a compelling visual representation of economic decline and financial loss. It showcases the potential for significant drops in various. Decrease financial trends illustrations AI-Generated Market Decline Visualization. This 3D graphic depicts a sharp market downturn, visualized with a red arrow plummeting downwards along a gridded bar chart. The image is generated by AI, offering a compelling visual representation of economic decline and financial loss. It showcases the potential for significant drops in various
Free with trial A stylized digital graph depicts fluctuating market trends using bar columns and a connected line with bright orange data points. Decrease financial trends illustrations Abstract digital graph showing financial market trends. A stylized digital graph depicts fluctuating market trends using bar columns and a connected line with bright orange data points
Free with trial A large red arrow points downwards on a green field with a city skyline in the background, often used to depict economic downturn or negative trends. Decrease financial trends illustrations Red Arrow Pointing Down on Grass Field with City Skyline. A large red arrow points downwards on a green field with a city skyline in the background, often used to depict economic downturn or negative trends
Free with trial Red to green arrow represents both positive and negative trends within one visual element Perfect for illustrating financial or economic concepts. Decrease financial trends illustrations Directional Arrow Showing Up and Down Growth in Red and Green. Red to green arrow represents both positive and negative trends within one visual element Perfect for illustrating financial or economic concepts
Free with trial A 3D render of a bar chart displaying a significant downward trend. Blue bars of varying heights represent data points, intersected by a sharp orange line that clearly illustrates a decline over time. The dark, reflective surface below the chart suggests a digital display or a futuristic interface. This image is ideal for representing financial losses, market crashes, performance decline, or negative trends in various industries. Decrease financial trends illustrations Downtrending Bar Chart with Orange Line on Dark Background. A 3D render of a bar chart displaying a significant downward trend. Blue bars of varying heights represent data points, intersected by a sharp orange line that clearly illustrates a decline over time. The dark, reflective surface below the chart suggests a digital display or a futuristic interface. This image is ideal for representing financial losses, market crashes, performance decline, or negative trends in various industries.
Free with trial Percentage arrow up and down glyph icon with percent sign. Represents financial growth, decline, interest rates, banking, credit, investment, and economic trends. Decrease financial trends vectors Percentage arrow up and down glyph Icon set.Vector illustration. Percentage arrow up and down glyph icon with percent sign. Represents financial growth, decline, interest rates, banking, credit, investment, and economic trends
Free with trial 3D Bar Chart Visualizing Business Performance Decline Trends - Business performance decline shown with a 3D bar chart to analyze negative trends. Decrease financial trends illustrations 3D Bar Chart Visualizing Business Performance Decline Trends
Free with trial An abstract and futuristic digital visualization of financial data, featuring glowing blue bar charts and candlestick patterns reflecting on a sleek, dark surface. The dynamic composition, set against a deep blue background with subtle grid lines, evokes concepts of technology, business growth, and market analysis. Ideal for illustrating topics related to stock market trends, investment strategies, economic reports, big data analytics, and the future of finance in a modern, high-tech context. Decrease financial trends illustrations Futuristic Digital Finance Chart with Glowing Blue Data Bars. An abstract and futuristic digital visualization of financial data, featuring glowing blue bar charts and candlestick patterns reflecting on a sleek, dark surface. The dynamic composition, set against a deep blue background with subtle grid lines, evokes concepts of technology, business growth, and market analysis. Ideal for illustrating topics related to stock market trends, investment strategies, economic reports, big data analytics, and the future of finance in a modern, high-tech context.
Free with trial This image displays a dynamic business analytics dashboard featuring both bar and line graphs. The bar chart illustrates varying percentages (15%, 50%, 75%, 85%), suggesting performance metrics or growth stages. The line chart, with its intersecting blue lines and data points, represents trends, fluctuations, and comparisons over time or across different categories. The clean, modern design makes it ideal for financial reports, business presentations, and data visualization concepts. Decrease financial trends illustrations Business Growth and Performance Analysis with Bar and Line Charts. This image displays a dynamic business analytics dashboard featuring both bar and line graphs. The bar chart illustrates varying percentages (15%, 50%, 75%, 85%), suggesting performance metrics or growth stages. The line chart, with its intersecting blue lines and data points, represents trends, fluctuations, and comparisons over time or across different categories. The clean, modern design makes it ideal for financial reports, business presentations, and data visualization concepts.
Free with trial A hand manipulates a red arrow pointing downwards, superimposed on a bar graph, illustrating a market downturn. This image, generated by AI, symbolizes economic recession, financial crisis, or business failure, showcasing the impact of negative trends. Decrease financial trends illustrations Declining Market Trend. A hand manipulates a red arrow pointing downwards, superimposed on a bar graph, illustrating a market downturn. This image, generated by AI, symbolizes economic recession, financial crisis, or business failure, showcasing the impact of negative trends.
Free with trial Arrows pointing downwards towards a falling coin and a cloud suggesting financial decline, economic loss, or monetary dynamics. Ideal for economy, finance, loss, business, recession, investment. Decrease financial trends illustrations Falling Coin and Cloud with Arrows Representing Economic Impact and Financial Flow. Arrows pointing downwards towards a falling coin and a cloud suggesting financial decline, economic loss, or monetary dynamics. Ideal for economy, finance, loss, business, recession, investment
Free with trial A Vector Dollar Up Icon Symbol represents an increase in value, price, or positive movement in financial markets, often associated with economic growth or profit. This symbol is commonly used in financial contexts to indicate a rise in currency value or favorable trends. Decrease financial trends vectors Vector Dollar Up Icon Symbol
Free with trial Magnifying glass focuses on a graphic pie chart over document, highlighting trends and potential insights Use for data analysis and business concept. Decrease financial trends illustrations Analyzing Graphic Pie Chart with Magnifying Glass for Insights. Magnifying glass focuses on a graphic pie chart over document, highlighting trends and potential insights Use for data analysis and business concept
Free with trial This 3D illustration shows a colorful bar graph with pastel-colored cylinders on a white circular base, representing upward business growth trends. The chart includes a line graph illustrating various data points. Decrease financial trends illustrations 3D Colorful Cylindrical Bar Graph Chart Showing Business Growth. This 3D illustration shows a colorful bar graph with pastel-colored cylinders on a white circular base, representing upward business growth trends. The chart includes a line graph illustrating various data points.
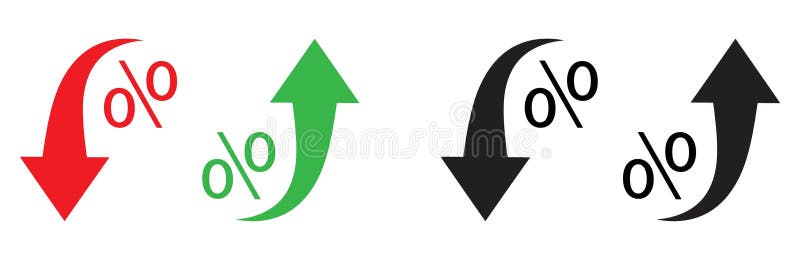
Free with trial Red and black arrows point downward, while green and black arrows point upward. Each arrow is curved, paired with a percentage symbol (%), indicating changes in rate or value. The red and black arrows denote decrease, and the green and black arrows denote increase, suggesting economic or statistical trends. The arrows and symbols are bold and stylized for emphasis. Decrease financial trends vectors Percent arrow icon. Growth, increase, decrease arrow filled icons. Up arrows, down arrows. Red and black arrows point downward, while green and black arrows point upward. Each arrow is curved, paired with a percentage symbol (%), indicating changes in rate or value. The red and black arrows denote decrease, and the green and black arrows denote increase, suggesting economic or statistical trends. The arrows and symbols are bold and stylized for emphasis.
Free with trial Stock market showing closeup of stock market display with green and red percentage changes and arrows. resolution use. Clear details and vibrant colors enhance visual appeal. stock market, financial data, percentage changes. Decrease financial trends illustrations Closeup of stock market display with green and red percentage changes and arrows. Stock market showing closeup of stock market display with green and red. Stock market showing closeup of stock market display with green and red percentage changes and arrows. resolution use. Clear details and vibrant colors enhance visual appeal. stock market, financial data, percentage changes
Free with trial A Vector Dollar Down Icon Symbol represents a decline in value or price, commonly associated with financial markets or economic trends. It is designed to visually convey a drop in currency value or downward movement related to money. Decrease financial trends vectors Vector Dollar Down Icon Symbol
Free with trial A screen shows a declining market trend with bar graphs and data visuals, useful for financial market analysis presentations. Decrease financial trends illustrations Analyzing Declining Market Trends Showing Data on Screen Display. A screen shows a declining market trend with bar graphs and data visuals, useful for financial market analysis presentations
Free with trial This cheerful 3D rendered illustration depicts a friendly cartoon businessman confidently presenting positive business growth charts and data, showcasing key performance indicators and financial success. The image is ideal for business, finance, and marketing concepts. Decrease financial trends illustrations Charming 3D Cartoon Businessman Presenting Growth Charts and Data. This cheerful 3D rendered illustration depicts a friendly cartoon businessman confidently presenting positive business growth charts and data, showcasing key performance indicators and financial success. The image is ideal for business, finance, and marketing concepts.
Free with trial Bar graph consisting of rectangular blocks in different colors: blue, green, yellow, orange, purple, and pink, decreasing in height. Overlaying the graph is a bold, zigzagging red arrow pointing downward, representing a declining trend. The red arrow contrasts sharply with the pastel-colored bars, emphasizing a negative change or trend. Set against a white background for clarity and focus. Decrease financial trends illustrations Declining Trends: A Bar Graph with a Downward Red Arrow. Generative AI. Bar graph consisting of rectangular blocks in different colors: blue, green, yellow, orange, purple, and pink, decreasing in height. Overlaying the graph is a bold, zigzagging red arrow pointing downward, representing a declining trend. The red arrow contrasts sharply with the pastel-colored bars, emphasizing a negative change or trend. Set against a white background for clarity and focus.
Free with trial This image features a bold threedimensional red arrow pointing downwards set against a clean white background The arrow is centrally positioned creating a strong focal point The simple design lends itself to conveying themes of direction decrease or downward trends It could be used to illustrate concepts like loss decline or a need to move forward or downward depending on context The clean lines. Decrease financial trends illustrations Bright Red Arrow Pointing Down on a White Background Illustration. This image features a bold threedimensional red arrow pointing downwards set against a clean white background The arrow is centrally positioned creating a strong focal point The simple design lends itself to conveying themes of direction decrease or downward trends It could be used to illustrate concepts like loss decline or a need to move forward or downward depending on context The clean lines
Free with trial This 3D rendering shows a downward trending arrow, generated by AI, dramatically illustrating a market downturn or economic decline. The visual is clean and impactful, suitable for presentations or reports on financial trends. It represents a clear visual metaphor for negative growth and instabilit. Decrease financial trends illustrations AI-Generated Market Decline. This 3D rendering shows a downward trending arrow, generated by AI, dramatically illustrating a market downturn or economic decline. The visual is clean and impactful, suitable for presentations or reports on financial trends. It represents a clear visual metaphor for negative growth and instabilit
Free with trial Downward blue arrow paired with stacked coins and musical notes representing revenue decline in music. Ideal for economics, music pricing, financial loss, digital sales, charts, trends, simple flat. Decrease financial trends vectors Declining Trend in Music Revenue Represented by Arrow, Money Coins, and Musical Notes. Downward blue arrow paired with stacked coins and musical notes representing revenue decline in music. Ideal for economics, music pricing, financial loss, digital sales, charts, trends, simple flat
Free with trial This image features a striking red neon-style line graph on a black background, symbolizing decline, decrease, or downward trend in data visualization. Ideal for business, finance, and analytics concepts, it visually represents performance drops or negative growth in a modern, eye-catching manner. Decrease financial trends illustrations Red Neon Declining Graph Line Icon for Business Data Visualization. This image features a striking red neon-style line graph on a black background, symbolizing decline, decrease, or downward trend in data visualization. Ideal for business, finance, and analytics concepts, it visually represents performance drops or negative growth in a modern, eye-catching manner.
Free with trial 3D rendering of a business growth down icon isolated on a white background symbolizing market decline and downward trends. Decrease financial trends illustrations Business growth down sign UI icon 3D isolated on white. 3D rendering of a business growth down icon isolated on a white background symbolizing market decline and downward trends
Free with trial A collection of simple finance graphic element icons, depicting trends, charts, and money. These icons can be used to visualize various financial concepts, such as growth, decline, and investment. Decrease financial trends vectors Simple Style Finance Graphic Element Icons with Trend, Chart and Money. A collection of simple finance graphic element icons, depicting trends, charts, and money. These icons can be used to visualize various financial concepts, such as growth, decline, and investment.
Free with trial A digital illustration showing a blue, dotted Earth globe overlaid with red and blue stock market trend lines, representing global market fluctuations and financial data analysis. Decrease financial trends illustrations Global Market Fluctuations: Red and Blue Stock Trends Over Earth Globe. A digital illustration showing a blue, dotted Earth globe overlaid with red and blue stock market trend lines, representing global market fluctuations and financial data analysis
Free with trial This image shows a calculator next to colorful 3D bar charts and pie charts illustrating business growth and financial success. The vibrant colors and upward-trending graph create a visually appealing representation of positive financial results. Decrease financial trends illustrations Colorful Calculator and 3D Charts Showing Business Growth. This image shows a calculator next to colorful 3D bar charts and pie charts illustrating business growth and financial success. The vibrant colors and upward-trending graph create a visually appealing representation of positive financial results.
Free with trial A close-up shot of a laptop screen displaying a business analytics dashboard. The screen showcases various charts and graphs, including bar graphs, line graphs, and pie charts, illustrating data related to revenue, sales performance, customer growth, and market share. The data visualizations are presented in a clean, modern design with a dark background, highlighting the key performance indicators (KPIs) and trends. This image is suitable for illustrating concepts of data analysis, business intelligence, financial reporting, and technology. Decrease financial trends illustrations Business Analytics Dashboard on Laptop Screen. A close-up shot of a laptop screen displaying a business analytics dashboard. The screen showcases various charts and graphs, including bar graphs, line graphs, and pie charts, illustrating data related to revenue, sales performance, customer growth, and market share. The data visualizations are presented in a clean, modern design with a dark background, highlighting the key performance indicators (KPIs) and trends. This image is suitable for illustrating concepts of data analysis, business intelligence, financial reporting, and technology.
Free with trial A Vector Dollar Up and Down Icon Symbol represents the fluctuation or volatility of financial markets, typically indicating both rising and falling trends in currency value, stock prices, or overall economic performance. This symbol is useful for portraying financial dynamics in reports, apps, and dashboards. Decrease financial trends vectors Vector Dollar Up And Down Icon Symbol
Free with trial Two lines illustrate a contrasting trend, one declining and the other rising, blending harmoniously in shades of orange, evoking a sense of change. Decrease financial trends illustrations Dynamic Trends Showcased Through Contrasting Lines in Warm Hues of Orange. Two lines illustrate a contrasting trend, one declining and the other rising, blending harmoniously in shades of orange, evoking a sense of change