Free with trial The image depicts an abstract and colorful representation of financial data and market trends. It uses vivid colors and shapes. Decrease financial trends illustrations An abstract visual representation of fluctuating financial data analysis. The image depicts an abstract and colorful representation of financial data and market trends. It uses vivid colors and shapes
Free with trial Generated with the use of AI. Stock market trading graph in red color as economy 3D illustration background. Trading trends and economic development. Generative AI. Decrease financial trends illustrations Stock market trading graph in red color as economy 3D illustration background. Trading trends and economic development. Generative
Free with trial Icon set depicting financial growth and decline with upward and downward arrows over bar charts, perfect for business analytics and presentations. Decrease financial trends vectors Bar charts with curved arrows showing trends. Icon set depicting financial growth and decline with upward and downward arrows over bar charts, perfect for business analytics and presentations
Free with trial Incorporating advanced technology to visually illustrate stock market patterns and conduct data analysis. Decrease financial trends illustrations Take advantage of cuttingedge technology trends for advanced analysis of the market. Incorporating advanced technology to visually illustrate stock market patterns and conduct data analysis
Free with trial Modern rendered line graph with yellow marker points rising and falling vertically, forming a white trend line that fluctuates across the screen. The graph represents business data such as growth, decrease, profit, and market performance. Set against a blurred office background, the image has a clean, digital aesthetic ideal for financial presentations, company reports, startup pitches, and data analysis. This visual is suitable for showcasing trading performance, corporate strategy, and economic trends. Decrease financial trends illustrations Business Trend Line Graph Showing Growth and Market Fluctuations. Modern rendered line graph with yellow marker points rising and falling vertically, forming a white trend line that fluctuates across the screen. The graph represents business data such as growth, decrease, profit, and market performance. Set against a blurred office background, the image has a clean, digital aesthetic ideal for financial presentations, company reports, startup pitches, and data analysis. This visual is suitable for showcasing trading performance, corporate strategy, and economic trends.
Free with trial View falling Trends in Market And Economic Downturn, Chart Analysis, Indicators , layered depth. Decrease financial trends illustrations View falling Trends in Market And Economic Downturn, Chart Analysis, Indicators
Free with trial A bold red arrow trends downwards, symbolizing financial loss or market decline, set against a somber gradient background Perfect for illustrating business failures. Decrease financial trends illustrations Red Arrow Graph Symbolizing Economic Downturn or Market Crash. A bold red arrow trends downwards, symbolizing financial loss or market decline, set against a somber gradient background Perfect for illustrating business failures
Free with trial A bold red arrow trends downwards, symbolizing financial loss or market decline, set against a somber gradient background Perfect for illustrating business failures. Decrease financial trends illustrations Red Arrow Graph Symbolizing Economic Downturn or Market Crash. A bold red arrow trends downwards, symbolizing financial loss or market decline, set against a somber gradient background Perfect for illustrating business failures
Free with trial A hand-drawn graph showing a decreasing trend. The chart depicts a decline in business performance, market downturn, or financial losses, created as a minimalist doodle. Decrease financial trends illustrations Hand-Drawn Graph Illustration Showing Market Decline and Decreasing Trends. A hand-drawn graph showing a decreasing trend. The chart depicts a decline in business performance, market downturn, or financial losses, created as a minimalist doodle
Free with trial Analyzing Dynamic Stock Market Trends with Red Graph Lines on Black Background. Generative AI. Decrease financial trends illustrations Analyzing Dynamic Stock Market Trends with Red Graph Lines on Black Background
Free with trial Digital globe with rising and falling stock market trends, represented by red and blue lines, symbolizing global financial fluctuations and economic uncertainty in a high-tech, futuristic style. Decrease financial trends illustrations Global Market Fluctuations: A Digital Earth with Rising and Falling Stock Trends. Digital globe with rising and falling stock market trends, represented by red and blue lines, symbolizing global financial fluctuations and economic uncertainty in a high-tech, futuristic style
Free with trial A close-up, shallow depth of field shot of a digital stock market ticker board. The screen displays rows of stock symbols and their corresponding prices in bright red and green LED lights against a dark background. Some numbers are in green, indicating gains, while others are in red, signifying losses or negative trends. The bokeh effect from out-of-focus lights adds a dynamic and professional feel, perfect for illustrating financial concepts. Decrease financial trends illustrations Stock Market Ticker Display with Red and Green Numbers. A close-up, shallow depth of field shot of a digital stock market ticker board. The screen displays rows of stock symbols and their corresponding prices in bright red and green LED lights against a dark background. Some numbers are in green, indicating gains, while others are in red, signifying losses or negative trends. The bokeh effect from out-of-focus lights adds a dynamic and professional feel, perfect for illustrating financial concepts.
Free with trial A bold, solid blue arrow points downwards, indicating a decrease or decline. To the right of the arrow, a vibrant pink circular icon features a white percentage sign. The entire graphic is isolated on a plain white background, commonly used to represent concepts like sales, discounts, or negative trends. Decrease financial trends illustrations Blue Downward Arrow with Pink Percentage Sign Icon on White Background image photo. A bold, solid blue arrow points downwards, indicating a decrease or decline. To the right of the arrow, a vibrant pink circular icon features a white percentage sign. The entire graphic is isolated on a plain white background, commonly used to represent concepts like sales, discounts, or negative trends
Free with trial This compelling visual representation showcases a clear negative trend. A vibrant red downward arrow icon serves as a potent indicator of decline, positioned prominently against a pristine white background. The simple, yet impactful, chart surrounding the arrow depicts a consistently sloping downward line, visually reinforcing the concept of a fall or decrease in value. This graphic serves as a. Decrease financial trends illustrations Visualizing Declining Trends A Downward Arrow Chart Illustrates Negative Performance. This compelling visual representation showcases a clear negative trend. A vibrant red downward arrow icon serves as a potent indicator of decline, positioned prominently against a pristine white background. The simple, yet impactful, chart surrounding the arrow depicts a consistently sloping downward line, visually reinforcing the concept of a fall or decrease in value. This graphic serves as a
Free with trial Close-up of a modern computer screen displaying stock market data and financial charts. Decrease financial trends illustrations Analyzing live stock market data on a computer screen, offering insights into trends. Close-up of a modern computer screen displaying stock market data and financial charts.
Free with trial This vibrant image showcases a 3D rendering of colorful cylinders arranged on a pink platform, overlaid with a rising line graph symbolizing upward trends and positive growth. Perfect for illustrating business success, financial progress, or marketing presentations. Decrease financial trends illustrations Colorful 3D Cylinders and Rising Line Graph on Pink Platform: Business Growth Concept. This vibrant image showcases a 3D rendering of colorful cylinders arranged on a pink platform, overlaid with a rising line graph symbolizing upward trends and positive growth. Perfect for illustrating business success, financial progress, or marketing presentations.
Free with trial Image depicting a downward trend in business costs, visualized with wooden blocks spelling 'COST' and a falling graph. Decrease financial trends illustrations Decreasing Business Costs: Financial Strategy and Economic Downturn Impact on Expenses. Image depicting a downward trend in business costs, visualized with wooden blocks spelling 'COST' and a falling graph
Free with trial Colorful growth chart with red and teal bars showing upward and downward arrows on a light background representing data trends progress decline business performance and financial analytics visual. Decrease financial trends illustrations Colorful growth chart with red and teal bars and upward and downward arrows on light background. colorful growth chart with red and teal bars showing upward and downward arrows on a light background representing data trends progress decline business performance and financial analytics visual
Free with trial This vibrant image showcases a collection of colorful 3D charts and graphs, including bar graphs, pie charts, and a line graph, all illustrating positive growth. A calculator and pencil are included, emphasizing the analytical and planning aspects of business success. Perfect for illustrating finan. Decrease financial trends illustrations Colorful 3D Financial Charts and Graphs with Calculator for Business Growth Presentation. This vibrant image showcases a collection of colorful 3D charts and graphs, including bar graphs, pie charts, and a line graph, all illustrating positive growth. A calculator and pencil are included, emphasizing the analytical and planning aspects of business success. Perfect for illustrating finan
Free with trial Man pointing at declining chart in office symbolizing loss and economic downturn in business strategy a man pointing at a declining chart ,Generative ai. Decrease financial trends illustrations Businessman Pointing at Declining Chart Showing Negative Growth in Financial Analysis Presentation Businessman. Man pointing at declining chart in office symbolizing loss and economic downturn in business strategy a man pointing at a declining chart ,Generative ai
Free with trial A vibrant graph displays two contrasting lines, one rising and the other falling, set against a blurred backdrop of light reflections, conveying a sense of motion and change. Decrease financial trends illustrations Dynamic Trends Illustrate Contrasting Growth and Decline in Statistical Data Visualization. A vibrant graph displays two contrasting lines, one rising and the other falling, set against a blurred backdrop of light reflections, conveying a sense of motion and change
Free with trial A vibrant red arrow points downward against a clean, solid-colored backdrop, symbolizing a decline or shift in focus. This visual representation effectively conveys motion and change. Decrease financial trends illustrations Red downward arrow on a solid background indicating a decrease or direction change in trends. A vibrant red arrow points downward against a clean, solid-colored backdrop, symbolizing a decline or shift in focus. This visual representation effectively conveys motion and change.
Free with trial Three stacks of gold coins decrease in height from left to right, with a red arrow pointing downwards across them. Isolated on a transparent background. Decrease financial trends vectors Stacks of gold coins with red downward trend arrow isolated on a transparent background money. Three stacks of gold coins decrease in height from left to right, with a red arrow pointing downwards across them. Isolated on a transparent background
Free with trial Colorful growth chart featuring orange and teal bars with upward and downward arrows on a clean white background representing progress decline business data trends and financial performance metrics. Decrease financial trends illustrations Colorful growth chart with orange and teal bars and upward and downward arrows on white background. colorful growth chart featuring orange and teal bars with upward and downward arrows on a clean white background representing progress decline business data trends and financial performance metrics
Free with trial Abstract digital illustration featuring blue and red bar charts and line graphs on a dark blue background. Orange and light blue points highlight data trends. The style is clean and modern. Decrease financial trends illustrations Abstract Financial Data Visualization Blue Red Charts Graphs Lines Points finance business. Abstract digital illustration featuring blue and red bar charts and line graphs on a dark blue background. Orange and light blue points highlight data trends. The style is clean and modern
Free with trial A 3D rendered illustration features a large blue downward-pointing arrow positioned diagonally on a white background. Overlapping the arrow is a small pink circle containing a white percentage symbol. This visual effectively communicates concepts such as discounts, sales, price reductions, negative trends, or financial decline. Decrease financial trends illustrations Blue Downward Arrow with Pink Circle and Percentage Symbol on White Background image photo. A 3D rendered illustration features a large blue downward-pointing arrow positioned diagonally on a white background. Overlapping the arrow is a small pink circle containing a white percentage symbol. This visual effectively communicates concepts such as discounts, sales, price reductions, negative trends, or financial decline
Free with trial A financial chart displaying market analysis and business growth with increasing and decreasing trends. Decrease financial trends illustrations Financial chart showing growth and market analysis data isolated on transparent background. A financial chart displaying market analysis and business growth with increasing and decreasing trends.
Free with trial Orange Pencil on Paper with Fluctuating Line Graph Representing Business Trends and Analysis, Generated by AI. Decrease financial trends illustrations Orange Pencil on Paper with Fluctuating Line Graph Representing Business Trends and Analysis
Free with trial This image visually depicts the impact of declining currency and interest rates within an economic context. A percentage model, a fundamental tool in economic analysis, serves as the foundation. The downward-pointing arrow dramatically illustrates the negative trend, signifying a decrease in both the value of a specific currency and the interest rates associated with loans and investments. This. Decrease financial trends illustrations Understanding Declining Currency and Interest Rates: A Visual Representation of Economic Trends. This image visually depicts the impact of declining currency and interest rates within an economic context. A percentage model, a fundamental tool in economic analysis, serves as the foundation. The downward-pointing arrow dramatically illustrates the negative trend, signifying a decrease in both the value of a specific currency and the interest rates associated with loans and investments. This
Free with trial A minimalistic illustration features a diminishing stack of coins alongside a downward arrow, representing reduced spending. The design uses clean vector style and balanced white tones for clarity. Decrease financial trends illustrations Shrinking stack of coins with downward arrow indicating reduced spending and financial decline. A minimalistic illustration features a diminishing stack of coins alongside a downward arrow, representing reduced spending. The design uses clean vector style and balanced white tones for clarity
Free with trial This long exposure photograph powerfully portrays the devastating impact of a plummeting market. Blurred light trails, indicative of rapid, downward movement, are a stark visual representation of falling prices and a stock market crash. The dark background emphasizes the mood of financial instability and economic hardship, creating a haunting stillness that encapsulates the uncertainty and risk. Decrease financial trends illustrations Long Exposure Captures the Haunting Stillness of a Plunging Stock Market and Economic Downturn. This long exposure photograph powerfully portrays the devastating impact of a plummeting market. Blurred light trails, indicative of rapid, downward movement, are a stark visual representation of falling prices and a stock market crash. The dark background emphasizes the mood of financial instability and economic hardship, creating a haunting stillness that encapsulates the uncertainty and risk
Free with trial This stock photo illustrates an economic crisis using virtual reality technology to visualize financial downtrends, highlighting the risks and challenges in the market. XDMCP. Decrease financial trends illustrations Economic Crisis Representation with Virtual Reality and Financial Downtrends Visualized Through Interactive Graphics. This stock photo illustrates an economic crisis using virtual reality technology to visualize financial downtrends, highlighting the risks and challenges in the market. XDMCP
Free with trial Blue graph and arrow visualize declining market trends in business, finance, and investment. Decrease financial trends illustrations Declining Trends: Visualizing Market Downturn with Blue Graph & Arrow. Business, Finance, and Investment Concepts. Blue graph and arrow visualize declining market trends in business, finance, and investment
Free with trial The image depicts a business professional in a suit interacting with a transparent digital chart displaying a declining trend in business performance. The visualization includes green bar charts and a line graph, complemented by a prominent downward arrow and percentage symbol indicating a decrease. This modern digital interface symbolizes data-driven decision-making, financial analysis, and real-time monitoring of business metrics for strategic planning. Decrease financial trends illustrations Business Performance Decline Visualization with Interactive Data Analytics and Percentage Drop Indicator. The image depicts a business professional in a suit interacting with a transparent digital chart displaying a declining trend in business performance. The visualization includes green bar charts and a line graph, complemented by a prominent downward arrow and percentage symbol indicating a decrease. This modern digital interface symbolizes data-driven decision-making, financial analysis, and real-time monitoring of business metrics for strategic planning.
Free with trial A flat vector illustration depicting a business or financial crisis. A worried man and a concerned woman stand beside a large bar chart. A bold red arrow trends downwards across the graph, symbolizing a market crash, loss, failure, or recession. The modern composition is isolated on a white background with decorative plant elements. This image was created with AI. Decrease financial trends vectors Conceptual illustration of a financial crisis with concerned people looking at a falling red arrow chart. A flat vector illustration depicting a business or financial crisis. A worried man and a concerned woman stand beside a large bar chart. A bold red arrow trends downwards across the graph, symbolizing a market crash, loss, failure, or recession. The modern composition is isolated on a white background with decorative plant elements. This image was created with AI.
Free with trial Illustration of a businessman skateboarding down a red arrow representing a market crash, symbolizing economic downturn. Decrease financial trends illustrations Businessman Riding Skateboard Downward Trend, Economic Downturn, Financial Crisis, Global Recession, Market Crash. Illustration of a businessman skateboarding down a red arrow representing a market crash, symbolizing economic downturn
Free with trial This infographic illustrates a crucial aspect of data analysis: recognizing and interpreting downward trends. The chart clearly displays a decreasing arrow, highlighting a negative slope and a reduction in value over time. Understanding these downward trends is critical in various fields, from finance and business to investment and market analysis. The visual representation aids in quickly. Decrease financial trends illustrations Analyzing Downward Trends in Data A Comprehensive Guide to Understanding Decreasing Charts and Graphs in Business. This infographic illustrates a crucial aspect of data analysis: recognizing and interpreting downward trends. The chart clearly displays a decreasing arrow, highlighting a negative slope and a reduction in value over time. Understanding these downward trends is critical in various fields, from finance and business to investment and market analysis. The visual representation aids in quickly
Free with trial This vibrant bar chart infographic is a powerful tool for communicating complex data in a clear and engaging way. Ideal for business presentations, reports, and marketing materials, this visually appealing design highlights key performance indicators and trends. The clean, modern aesthetic ensures your message stands out, while the colorful bars and clear labels make understanding the statistics. Decrease financial trends illustrations Colorful Bar Chart Infographic Diagram A Modern Effective Data Visualization Template for Business Presentations. This vibrant bar chart infographic is a powerful tool for communicating complex data in a clear and engaging way. Ideal for business presentations, reports, and marketing materials, this visually appealing design highlights key performance indicators and trends. The clean, modern aesthetic ensures your message stands out, while the colorful bars and clear labels make understanding the statistics
Free with trial This compelling stock image showcases a stark red arrow pointing downwards, a powerful visual representation of decline. The minimalist design focuses solely on the downward trend, making the message of negative movement immediately apparent. Perfect for conveying a range of concepts, from a downturn in business performance to a falling market share or a project that's fallen behind schedule. Decrease financial trends illustrations Visualizing Declining Trends A Minimalist Stock Photo of a Dramatic Red Arrow Down Illustrating Business Performance. This compelling stock image showcases a stark red arrow pointing downwards, a powerful visual representation of decline. The minimalist design focuses solely on the downward trend, making the message of negative movement immediately apparent. Perfect for conveying a range of concepts, from a downturn in business performance to a falling market share or a project that's fallen behind schedule.
Free with trial This compelling data visualization showcases a clear downward trend, perfect for illustrating declining performance, market share, or other metrics. The dark background provides a striking contrast to the graph's lines, emphasizing the trend's trajectory. The visual clarity makes it an excellent tool for conveying complex information effectively, whether for internal reports, presentations to. Decrease financial trends illustrations Visualizing Declining Trends A Dark Night Graph Depicts a Downward Trajectory in Data Ideal for Reports Presentations. This compelling data visualization showcases a clear downward trend, perfect for illustrating declining performance, market share, or other metrics. The dark background provides a striking contrast to the graph's lines, emphasizing the trend's trajectory. The visual clarity makes it an excellent tool for conveying complex information effectively, whether for internal reports, presentations to
Free with trial Piles of gold coins stacked, growing, illustrating finance economy, investment, saving concept. Business success, growth, wealth inflation rising. Economic prosperity, financial. Decrease financial trends illustrations Piles of gold coins stacked, growing, illustrating finance, economy, investment, saving concept. Business success, growth, wealth. Piles of gold coins stacked, growing, illustrating finance economy, investment, saving concept. Business success, growth, wealth inflation rising. Economic prosperity, financial.
Free with trial Data charts shown on mobile devices displayed with a bar graph represent growth and financial analysis on a tech interface Perfect for illustrating investment or business trends. Decrease financial trends illustrations Analyzing Stock Market Data with Mobile Tech and Bar Graph. Data charts shown on mobile devices displayed with a bar graph represent growth and financial analysis on a tech interface Perfect for illustrating investment or business trends
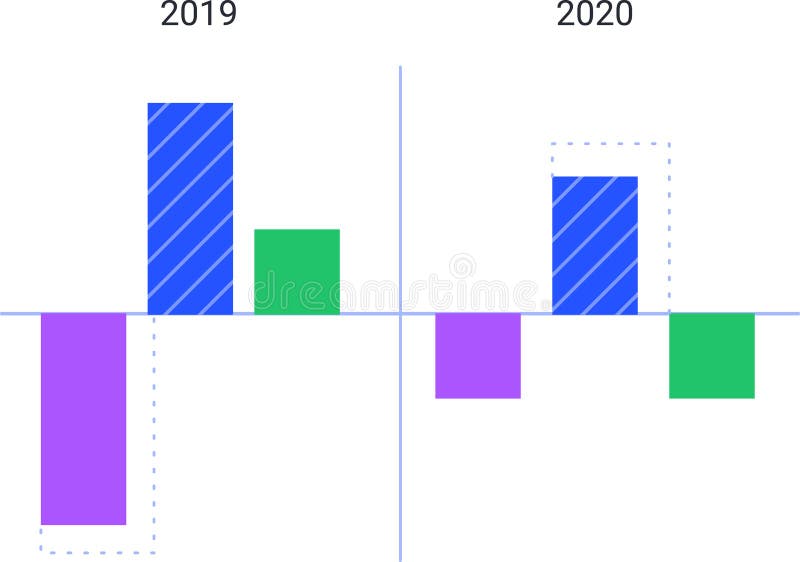
Free with trial Colorful bar charts are comparing data from 2019 and 2020, visualizing trends and statistics with positive and negative values represented by upward and downward bars. Decrease financial trends vectors Colorful bar charts are comparing data from 2019 and 2020, visualizing trends and statistics with positive and negative
Free with trial Colorful bar charts are comparing data from 2019 and 2020, visualizing trends and statistics with positive and negative values represented by upward and downward bars. Decrease financial trends illustrations Colorful bar charts are comparing data from 2019 and 2020, visualizing trends and statistics with positive and negative
Free with trial Generated with the use of AI. Stock market trading graph in red as economy 3D illustration background. Trading trends and economic statistics. Generative AI. Decrease financial trends illustrations Stock market trading graph in red as economy 3D illustration background. Trading trends and economic statistics. Generative AI
Free with trial Generated with the use of AI. Stock market trading graph in red as economy 3D illustration background. Trading trends and economic statistics. Generative AI. Decrease financial trends illustrations Stock market trading graph in red as economy 3D illustration background. Trading trends and economic statistics. Generative AI
Free with trial Generated with the use of AI. Stock market trading graph in red as economy 3D illustration background. Trading trends and economic statistics. Generative AI. Decrease financial trends illustrations Stock market trading graph in red as economy 3D illustration background. Trading trends and economic statistics. Generative AI
Free with trial Generated with the use of AI. Stock market trading graph in red as economy 3D illustration background. Trading trends and economic statistics. Generative AI. Decrease financial trends illustrations Stock market trading graph in red as economy 3D illustration background. Trading trends and economic statistics. Generative AI
Free with trial Generated with the use of AI. Stock market trading graph in red color as economy 3D illustration background. Trading trends and economic development. Generative AI. Decrease financial trends illustrations Stock market trading graph in red color as economy 3D illustration background. Trading trends and economic development. Generative
Free with trial Generated with the use of AI. Stock market trading graph in red color as economy 3D illustration background. Trading trends and economic development. Generative AI. Decrease financial trends illustrations Stock market trading graph in red color as economy 3D illustration background. Trading trends and economic development. Generative
Free with trial Generated with the use of AI. Stock market trading graph in red color as economy 3D illustration background. Trading trends and economic development. Generative AI. Decrease financial trends illustrations Stock market trading graph in red color as economy 3D illustration background. Trading trends and economic development. Generative
Free with trial Inflation post it on blue background. Decrease financial trends illustrations Inflation post it on blue
Free with trial Analytics, rising and falling trend. Deposits and loans. Economy and business. Income and Loss. Stock exchange trading. Decrease financial trends illustrations Analytics, rising and falling trend. Deposits and loans.
Free with trial A person meticulously studies complex financial or historical data displayed on a paper chart. The brass-rimmed magnifying glass highlights crucial upticks and downward trends in the graph line. Rendered by Ai. This scene captures the essence of deep research, analysis, and discovery in a vintage setting. Decrease financial trends illustrations Magnifying glass focused on a detailed stock chart. A person meticulously studies complex financial or historical data displayed on a paper chart. The brass-rimmed magnifying glass highlights crucial upticks and downward trends in the graph line. Rendered by Ai. This scene captures the essence of deep research, analysis, and discovery in a vintage setting
Free with trial A clean, flat design set of icons showing upward and downward arrows and a bar graph, perfect for illustrating financial trends, data, or concepts. Decrease financial trends vectors Green up arrow, red down arrow, and bar chart. A clean, flat design set of icons showing upward and downward arrows and a bar graph, perfect for illustrating financial trends, data, or concepts
Free with trial A clean flat design vector illustration featuring opposing arrows symbolizing growth and decline, perfect for financial or business concepts. Decrease financial trends vectors Black zigzag arrows indicating market trends. A clean flat design vector illustration featuring opposing arrows symbolizing growth and decline, perfect for financial or business concepts
Free with trial Abstract bull and bear market graph. Decrease financial trends illustrations Bull and Bear Neon Silhouettes on Stock Market Data Chart Background. Abstract bull and bear market graph
Free with trial Business analysis, performance tracking, resource management, environmental monitoring, sustainability, decline. Declining arrow with graph and water droplet. Business analysis and environmental. Decrease financial trends vectors Data Analysis Concept with Decline Arrow, Chart, and Blue Water Droplet Icon. Business analysis, performance tracking, resource management, environmental monitoring, sustainability, decline. Declining arrow with graph and water droplet. Business analysis and environmental
Free with trial Sales analysis. Sales with charts highlighting performance and revenue decline. Sales data optimization for retail strategies, e-commerce insights, and business reports. Decrease financial trends vectors Data Analytics and Sales Decline Concept with Graphs and Marketing Visuals on Screen. Sales analysis. Sales with charts highlighting performance and revenue decline. Sales data optimization for retail strategies, e-commerce insights, and business reports
Free with trial Gear icon beside descending bar chart emphasizing reduction trends. Ideal for performance assessment, process decline, economic studies, management, analytics, workflow, simple flat metaphor. Decrease financial trends illustrations Gear and Declining Bar Chart Representing Process Downsizing or Performance Reduction. Gear icon beside descending bar chart emphasizing reduction trends. Ideal for performance assessment, process decline, economic studies, management, analytics, workflow, simple flat metaphor
Free with trial Cartoon illustration of a declining green arrow over a pile of golden coins, representing falling gold prices or economic downturn. Investment value and economic decline stock trends. Decrease financial trends vectors Gold Price Drop Falling Arrow and Coin Stack Vector Illustration. Cartoon illustration of a declining green arrow over a pile of golden coins, representing falling gold prices or economic downturn. Investment value and economic decline stock trends
Free with trial Outline icons set depicting stock market concepts like surge, decline, performance, savings, and activity. Preferably at the end of the sentence. Decrease financial trends vectors Outline icons set depicting stock market concepts like surge, decline,... Outline icons set depicting stock market concepts like surge, decline, performance, savings, and activity. Preferably at the end of the sentence.
Free with trial A magnifying glass highlights glowing red business growth chart on dark background. Decrease financial trends illustrations Magnifying glass highlights glowing red business growth chart on dark background
Free with trial A 3D rendered graphic featuring a large, smooth blue arrow pointing downwards. Attached to the side of the arrow is a small, round pink icon containing a white percent symbol. The entire graphic is isolated on a white background, suggesting a concept related to discounts, price reductions, or negative trends. Decrease financial trends illustrations 3D Render of a Blue Downward Arrow with a Pink Circle and Percent Symbol down arrow. A 3D rendered graphic featuring a large, smooth blue arrow pointing downwards. Attached to the side of the arrow is a small, round pink icon containing a white percent symbol. The entire graphic is isolated on a white background, suggesting a concept related to discounts, price reductions, or negative trends
Free with trial Currency depreciation. Visual elements showcase currency symbols, stackable coins, and a sad face indicating economic instability. Currency depreciation impacts markets, finance, global economy. Decrease financial trends illustrations Currency Depreciation Concept with Growing Coins and Sad Face Symbol. Currency depreciation. Visual elements showcase currency symbols, stackable coins, and a sad face indicating economic instability. Currency depreciation impacts markets, finance, global economy
Free with trial Bitcoin icon within circular outline, large downward arrow, and stack of blue documents. Ideal for cryptocurrency, finance, blockchain, decreasing trends, data transfer, document management simple. Decrease financial trends vectors Bitcoin Logo with Downward Arrow and Document Stack in Minimalistic Style. Bitcoin icon within circular outline, large downward arrow, and stack of blue documents. Ideal for cryptocurrency, finance, blockchain, decreasing trends, data transfer, document management simple
Free with trial Economic growth and decline. Profit and loss. Trading on stock exchanges and markets. Bring your business into profit. Decrease financial trends illustrations Economic growth and decline. Profit and loss.
Free with trial A conceptual image representing a downturn in the real estate market. A hand guides a red arrow pointing downwards towards a miniature house. The word "SALE" is formed by wooden blocks on top of a contract. A set of keys lies nearby. This visual symbolizes a decline in property values and sales, potentially due to economic factors or market trends. Suitable for articles, reports, and presentations on real estate, finance, and economics. Decrease financial trends illustrations Real Estate Market Downturn. A conceptual image representing a downturn in the real estate market. A hand guides a red arrow pointing downwards towards a miniature house. The word "SALE" is formed by wooden blocks on top of a contract. A set of keys lies nearby. This visual symbolizes a decline in property values and sales, potentially due to economic factors or market trends. Suitable for articles, reports, and presentations on real estate, finance, and economics.
Free with trial Red bar graph with a descending line and arrow on a white background. The graph features four bars of varying heights, depicting a decline in values from left to right. The red line starts at the top of the first bar, dips below the second, rises over the third, then slopes downward with a pronounced arrow pointing to the right, indicating a decrease in data or performance. The image suggests themes of loss or negative financial trends. Decrease financial trends vectors Red bar graph with a descending line and arrow on a white background.
Free with trial Two bar graphs, one green showing growth and one red showing decline, with trend lines indicating opposite directions. Decrease financial trends illustrations Bar graphs showing upward and downward trends. Two bar graphs, one green showing growth and one red showing decline, with trend lines indicating opposite directions
Free with trial A professional office setting showcasing teamwork in data analysis, emphasizing a digital graph reflecting cost reduction trends over time. Perfect for business concepts. Raster. Decrease financial trends illustrations Business Analysis with Transparent Graph Showing Cost Decrease Over Time with Team Collaborating on Digital Devices in. A professional office setting showcasing teamwork in data analysis, emphasizing a digital graph reflecting cost reduction trends over time. Perfect for business concepts. Raster
Free with trial An isometric 3D bar chart with four descending bars, made of a clear glass with a modern, holographic, and iridescent finish in pink and blue. Concept of financial decline or decreasing data trends. Decrease financial trends vectors Isometric Bar Chart Showing Decline with Iridescent Bars. An isometric 3D bar chart with four descending bars, made of a clear glass with a modern, holographic. An isometric 3D bar chart with four descending bars, made of a clear glass with a modern, holographic, and iridescent finish in pink and blue. Concept of financial decline or decreasing data trends
Free with trial Abstract 3d bar charts illustrating data visualization, financial statistics, and business analysis, presenting growth and decline trends in a report format. Decrease financial trends illustrations Business data visualization showing 3d bar graphs. Abstract 3d bar charts illustrating data visualization, financial statistics, and business analysis, presenting growth and decline trends in a report format
Free with trial A hand uses chalk to draw a large downward-pointing arrow on a dark chalkboard, symbolizing financial decline, market crash, economic recession, or business loss. The stark contrast highlights the concept of falling values and negative trends. Decrease financial trends illustrations Hand Drawing Downward Arrow on Chalkboard Representing Decline and Loss. A hand uses chalk to draw a large downward-pointing arrow on a dark chalkboard, symbolizing financial decline, market crash, economic recession, or business loss. The stark contrast highlights the concept of falling values and negative trends
Free with trial Conceptual Image of Cost Analysis with Hands Reaching Out to Digital Graphs and Icons Representing Business Strategy and Financial Planning Quark. Decrease financial trends illustrations Conceptual Image of Cost Analysis with Hands Reaching Out to Digital Graphs and Icons Representing Business Strategy and
Free with trial A conceptual image featuring a series of ascending wooden blocks, with a green upward arrow on a lower block and a red downward arrow on a higher block, symbolizing the fluctuating nature of business, market trends, and financial performance. The image conveys concepts of success, failure, progress, and setback in a clear and concise manner. Decrease financial trends illustrations Wooden Blocks with Up and Down Arrows Representing Business Growth and Decline. A conceptual image featuring a series of ascending wooden blocks, with a green upward arrow on a lower block and a red downward arrow on a higher block, symbolizing the fluctuating nature of business, market trends, and financial performance. The image conveys concepts of success, failure, progress, and setback in a clear and concise manner