Free with trial Doodle style Bitcoin digital currency symbol with arrows up and down to indicate inflation, deflation, evaluation, or devaluation as economic indicators. Vector format. Decrease indicators vectors Bitcoin digital currency value sketch. Doodle style Bitcoin digital currency symbol with arrows up and down to indicate inflation, deflation, evaluation, or devaluation as economic indicators. Vector format.
Free with trial Falling financial indicators, business profits, investment fund, investments, reduction of monetary savings, budget planning, income fall concept. Illustration in paper cut art style. Decrease indicators vectors Falling financial indicators. Illustration in paper cut art style. Falling financial indicators, business profits, investment fund, investments, reduction of monetary savings, budget planning, income fall concept. Illustration in paper cut art style.
Free with trial Doodle style Japanese Yen international currency symbol with arrows up and down to indicate inflation, deflation, evaluation, or devaluation as economic indicators. Vector format. Decrease indicators vectors Japanese Yen currency value sketch. Doodle style Japanese Yen international currency symbol with arrows up and down to indicate inflation, deflation, evaluation, or devaluation as economic indicators. Vector format.
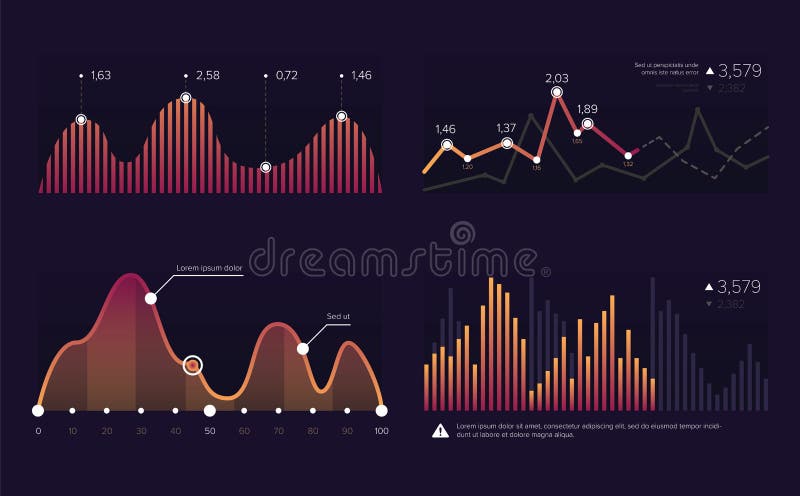
Free with trial Vector image charts and diagrams for presentation or financial report. Infographics concept. Increase and decrease of indicators in graphic diagram. Colorful vector illustration. Decrease indicators vectors Vector image charts and diagrams for presentation or financial report. Infographics concept.Increase and decrease of
Free with trial Interest rates fluctuation symbols. Vector finance arrows. Economic indicators concept. EPS 10. Decrease indicators vectors Interest rates fluctuation symbols. Vector finance arrows. Economic indicators concept.
Free with trial Isometric vector illustration of gold and silver bars, coins on white background. Gold and silver rate indicators with up and down arrows. Decrease indicators vectors Isometric Gold and Silver Bars. Isometric vector illustration of gold and silver bars, coins on white background. Gold and silver rate indicators with up and down arrows
Free with trial A 3d illustration showing arrows indicating the increasing or decreasing value of a Euro, isolated on a white background. Decrease indicators vectors Euro Value Indicators. A 3d illustration showing arrows indicating the increasing or decreasing value of a Euro, isolated on a white background.
Free with trial A 3D illustration depicting a businessman sitting on a crumbling rock, alongside a sharply falling red arrow, symbolizing market downturn and financial distress. The scene evokes feelings of anxiety and uncertainty related to economic instability and investment loss. Decrease indicators illustrations Market Crash Anxiety. A 3D illustration depicting a businessman sitting on a crumbling rock, alongside a sharply falling red arrow, symbolizing market downturn and financial distress. The scene evokes feelings of anxiety and uncertainty related to economic instability and investment loss.
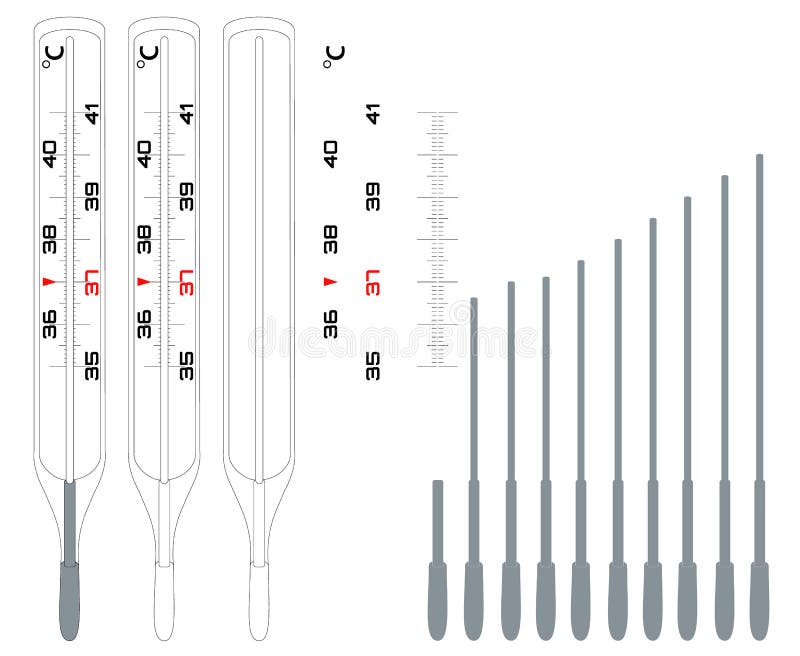
Free with trial A versatile vector line art set of medical mercury-in-glass thermometers. Includes detailed outlines of the thermometer body, a clear Celsius scale with a red 37-degree marker, and a collection of mercury columns at various heights. Perfect for creating custom temperature readings in medical manuals, educational infographics, and minimalist healthcare branding. Decrease indicators vectors Medical Mercury Thermometer Line Art and Construction Set. A versatile vector line art set of medical mercury-in-glass thermometers. Includes detailed outlines of the thermometer body, a clear Celsius scale with a red 37-degree marker, and a collection of mercury columns at various heights. Perfect for creating custom temperature readings in medical manuals, educational infographics, and minimalist healthcare branding.
Free with trial Economics recession, crashed stock market and trading loss vector graphs with indicators turned down, decline charts, red arrows. Blurred trading screen for finance crisis and business bankruptcy. Decrease indicators vectors Economics recession, crashed stock market graph. Economics recession, crashed stock market and trading loss vector graphs with indicators turned down, decline charts, red arrows. Blurred trading screen for finance crisis and business bankruptcy
Free with trial Holographic globe with neon green and blue charts on dark blue and plaid backgrounds. Chaotic data in numbers. Indicators of growth and falls. 3d rendering. Decrease indicators illustrations Neon green, blue chart waves with the holographic globe. Holographic globe with neon green and blue charts on dark blue and plaid backgrounds. Chaotic data in numbers. Indicators of growth and falls. 3d rendering
Free with trial Concept Stock Market, Investment Strategy, Market Trends, Financial News, Economic Indicators Downtrend Alert Market Plunge Indicated by Red Arrow. Decrease indicators illustrations Downtrend Alert: Market Plunge Indicated by Red Arrow. Concept Stock Market, Investment Strategy. Concept Stock Market, Investment Strategy, Market Trends, Financial News, Economic Indicators Downtrend Alert Market Plunge Indicated by Red Arrow
Free with trial Cryptocurrency and coronavirus, pandemic impact on the cryptocurrency market. 3D virus bacterium with graphs and charts and indicators of the fall in the value of Bitcoin and other cryptocurrencies. Decrease indicators vectors Cryptocurrency and coronavirus
Free with trial An isometric vector icon of a T-shaped down arrow, symbolizing download, decrease, or bottom. This clear design is perfect for software interfaces, data indicators, or hierarchical structures. Its distinct shape conveys direction and action, making it suitable for functional digital and print applications, vector design Generative AI. Decrease indicators vectors Down Arrow Isometric Icon, Download or Decrease Symbol, vector design Generative AI. An isometric vector icon of a T-shaped down arrow, symbolizing download, decrease, or bottom. This clear design is perfect for software interfaces, data indicators, or hierarchical structures. Its distinct shape conveys direction and action, making it suitable for functional digital and print applications, vector design Generative AI
Free with trial The image shows two arrows, one red with a downward direction and a percentage symbol indicating a decrease, and another green with an upward direction and a percentage symbol indicating an increase. These visuals are commonly used to represent opposing trends, such as declines and rises in data like stock prices, economic indicators, or performance metrics. Decrease indicators illustrations Opposing trends represented by percentage change indicators with upward and downward arrows. The image shows two arrows, one red with a downward direction and a percentage symbol indicating a decrease, and another green with an upward direction and a percentage symbol indicating an increase. These visuals are commonly used to represent opposing trends, such as declines and rises in data like stock prices, economic indicators, or performance metrics
Free with trial A simple icon of a downward arrow line, symbolizing decline, decrease, negative trends, and falling metrics. Ideal for business, finance, performance analytics, or warning indicators. This clear vector illustration is perfect for websites, apps, and presentations, conveying negative progress or caution, vector design Generative AI. Decrease indicators vectors Downward Trend Arrow Icon: Decline, Decrease Negative Trend, vector design Generative AI. A simple icon of a downward arrow line, symbolizing decline, decrease, negative trends, and falling metrics. Ideal for business, finance, performance analytics, or warning indicators. This clear vector illustration is perfect for websites, apps, and presentations, conveying negative progress or caution, vector design Generative AI
Free with trial A downward-pointing arrow icon, typically symbolizing download, move down, or decrease. Essential for download buttons and scroll-down indicators. This is a scalable EPS vector file. Decrease indicators vectors Down arrow icon, download and decrease symbol for user interface UI UX design, vector EPS silhouette. A downward-pointing arrow icon, typically symbolizing download, move down, or decrease. Essential for download buttons and scroll-down indicators. This is a scalable EPS vector file.
Free with trial A simple yet impactful vector icon of a downward-pointing arrow, symbolizing a negative trend, decline, or decrease. This design is ideal for financial reports, economic indicators, market analysis, or any data visualization requiring a clear representation of reduction or downturns, vector design Generative AI. Decrease indicators vectors Downward Trend Arrow, Market Decline, vector design Generative AI. A simple yet impactful vector icon of a downward-pointing arrow, symbolizing a negative trend, decline, or decrease. This design is ideal for financial reports, economic indicators, market analysis, or any data visualization requiring a clear representation of reduction or downturns, vector design Generative AI
Free with trial Sophisticated financial dollar. Professional growth indicators. Economic statistics Vector. Professional currency exchanges. EPS 10. Decrease indicators vectors Sophisticated financial dollar. Professional growth indicators. Economic statistics Vector. Professional currency exchanges
Free with trial A clear vector illustration of a line graph showing a downward trend. Represents financial decline, negative performance, market downturns, or decreasing metrics. Ideal for business reports, financial analysis, economic indicators, or risk assessment. It visually communicates a decrease or a challenging period, vector design Generative AI. Decrease indicators vectors Downtrend Line Graph Financial Market Decline, vector design Generative AI. A clear vector illustration of a line graph showing a downward trend. Represents financial decline, negative performance, market downturns, or decreasing metrics. Ideal for business reports, financial analysis, economic indicators, or risk assessment. It visually communicates a decrease or a challenging period, vector design Generative AI
Free with trial A downward pointing V shape arrow icon, perfect for indicating decline, decrease, or a bottoming out. This scalable vector graphic is ideal for financial charts, trend analysis, or negative indicators. Its simple design ensures clarity, making it effective for conveying downward movement or completion, vector design Generative AI. Decrease indicators vectors Downward Pointing V Shape Arrow Icon, vector design Generative AI. A downward pointing V shape arrow icon, perfect for indicating decline, decrease, or a bottoming out. This scalable vector graphic is ideal for financial charts, trend analysis, or negative indicators. Its simple design ensures clarity, making it effective for conveying downward movement or completion, vector design Generative AI
Free with trial The image displays a financial stock market chart with various colored candlesticks and multiple technical indicators overlaid on a grid background. Decrease indicators illustrations Detailed financial stock market chart with technical indicators and price movements. The image displays a financial stock market chart with various colored candlesticks and multiple technical indicators overlaid on a grid background
Free with trial People are stressed by a financial chart with falling indicators, showing a loss of money and investments due to a market downturn. Decrease indicators vectors People stressed by a financial chart with falling indicators. people are stressed by a financial chart with falling indicators, showing a loss of money and investments due to a market downturn.
Free with trial Increase and decrease arrows on black background. Decrease indicators illustrations Increase and decrease arrows on black
Free with trial Red 3D downward-pointing arrow with a percentage symbol (%) in white at the center. The design emphasizes the concept of a decrease or reduction, commonly used in contexts like sales, discounts, or economic indicators. The background is plain white, highlighting the arrow's bold color and shape. Decrease indicators illustrations Red 3D downward-pointing arrow with a percentage symbol (%) in white at the ce
Free with trial This image features four distinct icons representing financial performance indicators. The top left icon shows a green percentage symbol with an upward arrow, indicating growth or increase. The top right icon displays a red percentage symbol with a downward arrow, symbolizing decline or decrease. The bottom left icon illustrates a series of green bar graphs, indicating positive trends or growth. Decrease indicators illustrations Financial performance indicators
Free with trial The image depicts a dollar sign in the center with a red downward arrow on the left and a green upward arrow on the right. This visual metaphor represents financial trends, specifically a decrease and an increase in monetary value or economic indicators. Decrease indicators illustrations Financial trend illustration showing increase and decrease with dollar sign. The image depicts a dollar sign in the center with a red downward arrow on the left and a green upward arrow on the right. This visual metaphor represents financial trends, specifically a decrease and an increase in monetary value or economic indicators
Free with trial A line art illustration isolated on white background displays business performance indicators: a speedometer, arrows, a bar graph, and a line graph, all in a minimalist style. Decrease indicators vectors Vector art of line art illustration of business performance indicators featuring a speedometer, arrows, bar graph, and line graph. A line art illustration isolated on white background displays business performance indicators: a speedometer, arrows, a bar graph, and a line graph, all in a minimalist style
Free with trial A prominent red banner featuring a clear downward-pointing arrow. This design effectively symbolizes a decrease, decline, or negative trend, making it suitable for charts, warning indicators, or data visualization in reports and presentations. Bold and direct communication, vector design Generative AI. Decrease indicators vectors Red Banner with Downward Trend Arrow, vector design Generative AI. A prominent red banner featuring a clear downward-pointing arrow. This design effectively symbolizes a decrease, decline, or negative trend, making it suitable for charts, warning indicators, or data visualization in reports and presentations. Bold and direct communication, vector design Generative AI
Free with trial A conceptual black and white line graph depicting economic recession trends is presented on a piece of torn and crumpled paper with a worn, aged texture, featuring a hand-drawn sketch-like style with three distinct lines representing different time periods where the first line shows a sharp downward trend, the second line indicates an upward trend suggesting economic decrease, and the third line. Decrease indicators illustrations A black and white line graph on torn crumpled paper illustrating economic recession trends with downward and upward indicators. A conceptual black and white line graph depicting economic recession trends is presented on a piece of torn and crumpled paper with a worn, aged texture, featuring a hand-drawn sketch-like style with three distinct lines representing different time periods where the first line shows a sharp downward trend, the second line indicates an upward trend suggesting economic decrease, and the third line
Free with trial The image shows two arrows, one green pointing upward labeled increase and another red pointing downward labeled decrease, commonly used to indicate trends or changes in data. Decrease indicators illustrations Visual representation of increase and decrease indicators using arrows. The image shows two arrows, one green pointing upward labeled increase and another red pointing downward labeled decrease, commonly used to indicate trends or changes in data
Free with trial A detailed close-up shows a sheet of white paper with a handwritten mathematical equation in black ink divided into two columns labeled 8. 258 and 5. 528 while the equation itself displays a value of 8. 258 written as 2. 028 accompanied by multiple green arrows pointing both upwards and downwards to indicate progression and decrease in the calculation process with additional arrows positioned on the. Decrease indicators illustrations Close-up of a handwritten mathematical equation on paper with green arrows showing upward and downward progress indicators for. A detailed close-up shows a sheet of white paper with a handwritten mathematical equation in black ink divided into two columns labeled 8.258 and 5.528 while the equation itself displays a value of 8.258 written as 2.028 accompanied by multiple green arrows pointing both upwards and downwards to indicate progression and decrease in the calculation process with additional arrows positioned on the
Free with trial A detailed illustration of a business growth chart with multiple lines, representing profit, trend, and loss, along with various financial indicators and icons. Decrease indicators vectors Business growth chart with multiple lines and various financial indicators. A detailed illustration of a business growth chart with multiple lines, representing profit, trend, and loss, along with various financial indicators and icons
Free with trial Aircraft Navigation and Financial Data Analysis Concept with Business Indicators. Decrease indicators vectors Aircraft Navigation and Financial Data Analysis Concept with Business Indicators
Free with trial The image shows a striking red zigzag arrow pointing downward, symbolizing a sharp decline or downward trend. The arrow is bold and visually emphasizes the concept of a decrease, often used in financial, economic, or performance contexts to represent falling values, losses, or negative growth. Decrease indicators illustrations A bold downward zigzag arrow indicating a significant decline or decrease trend. The image shows a striking red zigzag arrow pointing downward, symbolizing a sharp decline or downward trend. The arrow is bold and visually emphasizes the concept of a decrease, often used in financial, economic, or performance contexts to represent falling values, losses, or negative growth
Free with trial The image displays performance indicators, including improvement, decline, speed, and time. It represents metrics for tracking progress and efficiency in various processes. Decrease indicators vectors Vector art of performance indicators showing improvement, decline, speed, and time. The image displays performance indicators, including improvement, decline, speed, and time. It represents metrics for tracking progress and efficiency in various processes
Free with trial The image showcases a collection of visual representations of various business performance metrics, such as growth percentages, market shares, and financial gains. Each cube features different types of charts and graphs, including bar graphs, line graphs, pie charts, and target indicators, illustrating growth rates like 5%, 8%, 15%, and market share percentages. The visuals emphasize positive and. Decrease indicators illustrations Diverse business performance metrics and growth indicators isolated on white background. The image showcases a collection of visual representations of various. The image showcases a collection of visual representations of various business performance metrics, such as growth percentages, market shares, and financial gains. Each cube features different types of charts and graphs, including bar graphs, line graphs, pie charts, and target indicators, illustrating growth rates like 5%, 8%, 15%, and market share percentages. The visuals emphasize positive and
Free with trial The image shows a 3D bar graph with blue bars of varying heights. Two large red arrows cross over the graph: one pointing upward to the right, symbolizing growth or increase, and the other pointing downward to the right, symbolizing decline or decrease. This visual metaphor emphasizes conflicting trends or mixed signals in data. Decrease indicators illustrations Contradictory growth and decline indicators represented by a bar graph with crossed arrows. The image shows a 3D bar graph with blue bars of varying heights. Two large red arrows cross over the graph: one pointing upward to the right, symbolizing growth or increase, and the other pointing downward to the right, symbolizing decline or decrease. This visual metaphor emphasizes conflicting trends or mixed signals in data
Free with trial The image showcases a collection of 3D graphical elements representing different business and market performance metrics. It includes growth percentages, market share gains, pie charts, bar graphs, and target indicators. Each element highlights positive and negative trends, market shares, and growth rates, useful for illustrating financial reports, business presentations, or performance analyses. Decrease indicators illustrations Visual representation of various business performance metrics and market growth indicators isolated on white background. The image showcases a collection of 3D graphical elements representing different business and market performance metrics. It includes growth percentages, market share gains, pie charts, bar graphs, and target indicators. Each element highlights positive and negative trends, market shares, and growth rates, useful for illustrating financial reports, business presentations, or performance analyses.
Free with trial The image showcases a collection of 3D graphical elements representing different business and market performance metrics. It includes growth percentages, market share gains, pie charts, bar graphs, and target indicators. Each element highlights positive and negative trends, market shares, and growth rates, useful for illustrating financial reports, business presentations, or performance analyses. Decrease indicators illustrations Visual representation of various business performance metrics and market growth indicators isolated on white background. The image showcases a collection of 3D graphical elements representing different business and market performance metrics. It includes growth percentages, market share gains, pie charts, bar graphs, and target indicators. Each element highlights positive and negative trends, market shares, and growth rates, useful for illustrating financial reports, business presentations, or performance analyses.
Free with trial This image displays financial performance indicators, highlighting data trends and market volatility. It represents economic analysis and strategic decision-making processes. Decrease indicators vectors Vector art of financial performance indicators, showcasing data trends, market volatility, and economic analysis for strategic. This image displays financial performance indicators, highlighting data trends and market volatility. It represents economic analysis and strategic decision-making processes
Free with trial Isolated red and green arrows for infographics representing economic trends and indicators. Decrease indicators illustrations Isolated red and green arrows for infographics representing economic trends and indicators
Free with trial Red down arrow, green up arrow. Directional indicators. Vector illustration. EPS 10. Decrease indicators vectors Red down arrow, green up arrow. Directional indicators. Vector illustration.
Free with trial Financial data shows downward trend. Spreadsheet exhibits economic decline. Magnifying glass focuses on, negative indicators. Business recession impacting market. Stock loss visible. Decrease indicators illustrations Financial data shows downward trend. Spreadsheet exhibits economic decline. Magnifying glass focuses on negative indicators. Financial data shows downward trend. Spreadsheet exhibits economic decline. Magnifying glass focuses on, negative indicators. Business recession impacting market. Stock loss visible.
Free with trial A simple vector outline illustration of a down-pointing arrow. This icon symbolizes down, descend, decrease, or download. Ideal for user interfaces, data indicators, directional signs, or instructional graphics. Its clear directional message is suitable for various digital and print applications, vector design Generative AI. Decrease indicators vectors Down Arrow Descend Fall Direction Vector, vector design Generative AI. A simple vector outline illustration of a down-pointing arrow. This icon symbolizes down, descend, decrease, or download. Ideal for user interfaces, data indicators, directional signs, or instructional graphics. Its clear directional message is suitable for various digital and print applications, vector design Generative AI
Free with trial A clean outline vector icon of a bold down arrow, universally signifying download, direction, or decrease. Perfect for user interfaces, data transfer indicators, navigation, or statistical graphics. Its simple and unambiguous design ensures clear communication in digital and print media, vector design Generative AI. Decrease indicators vectors Down Arrow Download Indicator User Interface Icon, vector design Generative AI. A clean outline vector icon of a bold down arrow, universally signifying download, direction, or decrease. Perfect for user interfaces, data transfer indicators, navigation, or statistical graphics. Its simple and unambiguous design ensures clear communication in digital and print media, vector design Generative AI
Free with trial Blue arrows pointing up and down, direction indicators. Glossy finish. Isolated. Symbolizes growth, decline, choice, and navigation. Useful for web design. 161. Decrease indicators vectors Blue arrows pointing up and down, direction indicators, glossy finish, isolated. Blue arrows pointing up and down, direction indicators. Glossy finish. Isolated. Symbolizes growth, decline, choice, and navigation. Useful for web design. 161
Free with trial A vector icon illustrating a downward trending line graph, symbolizing a decline, decrease, or negative performance. Ideal for financial reports, data analysis dashboards, or warning indicators. This clear and concise graphic is scalable, perfect for conveying trend information in various digital interfaces, vector design Generative AI. Decrease indicators vectors Declining Trend Graph Icon - Downturn Analysis Symbol, vector design Generative AI. A vector icon illustrating a downward trending line graph, symbolizing a decline, decrease, or negative performance. Ideal for financial reports, data analysis dashboards, or warning indicators. This clear and concise graphic is scalable, perfect for conveying trend information in various digital interfaces, vector design Generative AI
Free with trial Five oil barrels of varying sizes are arranged in a declining order. A bold orange arrow points downward, symbolizing a decrease in oil prices, illustrating market dynamics. Decrease indicators illustrations Art collage, Oil barrel sizes decrease, reflecting energy market trends and price fluctuations. Five oil barrels of varying sizes are arranged in a declining order. A bold orange arrow points downward, symbolizing a decrease in oil prices, illustrating market dynamics
Free with trial PMI Purchasing Managers' Index - economic indicators derived from monthly surveys of private sector companies, acronym text concept stamp. Decrease indicators illustrations PMI Purchasing Managers\' Index - economic indicators derived from monthly surveys of private sector companies, acronym text
Free with trial A clean and modern vector illustration featuring two prominent white arrows, one pointing upwards and the other downwards, enclosed within a blue square with rounded corners. The arrows have a distinct black outline, creating a clear and versatile icon. This graphic effectively represents concepts such as upload and download, increase and decrease, directional movement, data transfer, or sorting. Ideal for web design, mobile applications, user interfaces, infographics, and any project requiring clear transactional or navigational indicators with a flat design aesthetic. Decrease indicators vectors Up and Down Arrows Icon for Upload Download Direction. A clean and modern vector illustration featuring two prominent white arrows, one pointing upwards and the other downwards, enclosed within a blue square with rounded corners. The arrows have a distinct black outline, creating a clear and versatile icon. This graphic effectively represents concepts such as upload and download, increase and decrease, directional movement, data transfer, or sorting. Ideal for web design, mobile applications, user interfaces, infographics, and any project requiring clear transactional or navigational indicators with a flat design aesthetic.
Free with trial A hand points to the price cubes, with up and down arrows indicating change in value. Decrease indicators illustrations Price increase or decrease concept with wooden blocks and arrows. A hand points to the price cubes, with up and down arrows indicating change in value
Free with trial Neon up and down arrows made of glowing particles, blue growth and pink decline indicators, abstract financial direction symbols for trading dashboards, stock market analytics and business infographics. Decrease indicators vectors Neon up and down arrows made of glowing particles, blue growth and pink decline indicators, abstract financial direction symbols
Free with trial Carbon neutrality, ecological savings, climate change, environmental impact, eco-efficiency, economics. Pound symbol, CO2 footprint decreasing thermometer and books. Carbon neutrality and savings. Decrease indicators vectors Carbon Footprint Reduction with Financial Impacts and Sustainability Indicators. Carbon neutrality, ecological savings, climate change, environmental impact, eco-efficiency, economics. Pound symbol, CO2 footprint decreasing thermometer and books. Carbon neutrality and savings
Free with trial Stylized graphic depicts a deceased emoticon with downward-pointing indicators. Flat design against a black background suggesting financial downturn or failure. Decrease indicators vectors Deceased Emoticon with Downward Indicators on a Black Background. Stylized graphic depicts a deceased emoticon with downward-pointing indicators. Flat design against a black background suggesting financial downturn or failure.
Free with trial The image features two arrows, one pointing upwards and the other pointing downwards. The upward-pointing arrow has a euro symbol (€) on it, indicating an increase or appreciation in the value of the euro. The downward-pointing arrow has a dollar symbol ($) on it, indicating a decrease or depreciation in the value of the dollar. Decrease indicators illustrations Currency exchange indicators. The image features two arrows, one pointing upwards and the other pointing downwards. The upward-pointing arrow has a euro symbol (€) on it, indicating an increase or appreciation in the value of the euro. The downward-pointing arrow has a dollar symbol ($) on it, indicating a decrease or depreciation in the value of the dollar
Free with trial This image represents financial concepts such as market trends, interest rates, and economic indicators. Decrease indicators illustrations Financial concept with percentage symbol, up and down arrows on wooden blocks. This image represents financial concepts such as market trends, interest rates, and economic indicators
Free with trial A versatile collection of colorful down arrow icons, presented in a modern flat design style. This set features a variety of arrow shapes and styles in vibrant shades of blue, green, yellow, and red, all pointing downwards on a light background. These clean, vector graphic elements are perfect for user interface (UI) design, web buttons, download symbols, infographics showing a decrease or negative trend, and navigation indicators in apps or presentations. An essential toolkit for any graphic designer's collection. Decrease indicators vectors Colorful Flat Design Down Arrow Icon Set. A versatile collection of colorful down arrow icons, presented in a modern flat design style. This set features a variety of arrow shapes and styles in vibrant shades of blue, green, yellow, and red, all pointing downwards on a light background. These clean, vector graphic elements are perfect for user interface (UI) design, web buttons, download symbols, infographics showing a decrease or negative trend, and navigation indicators in apps or presentations. An essential toolkit for any graphic designer's collection.
Free with trial Diagonal down left arrow symbol set in outline and solid styles suitable for navigation controls, trend decrease indicators, return actions, directional guidance, and interface elements. Decrease indicators vectors Arrow Diagonal Down Left Icon Collection in Line and Solid Style for Direction. Diagonal down left arrow symbol set in outline and solid styles suitable for navigation controls, trend decrease indicators, return actions, directional guidance, and interface elements
Free with trial Stock market chart displaying data and financial analysis. Green and red candles show trading on background. Investment indicators and performance trends. Decrease indicators illustrations Stock market chart data and financial analysis. Stock market chart displaying data and financial analysis. Green and red candles show trading on background. Investment indicators and performance trends
Free with trial This comprehensive vector illustration features a set of 18 flat icons depicting various financial trends, market indicators, and warning signals. The collection includes rising and falling line graphs, bar charts, currency symbols (dollar and euro) indicating fluctuations, and alert symbols like sirens and exclamation marks. Ideal for illustrating concepts of economic growth, decline, market volatility, financial crisis, investment risks, and business performance. Perfect for presentations, reports, websites, and applications related to finance, economics, and stock markets. Decrease indicators vectors Financial Trends, Market Indicators and Crisis Alert Icons Set. This comprehensive vector illustration features a set of 18 flat icons depicting various financial trends, market indicators, and warning signals. The collection includes rising and falling line graphs, bar charts, currency symbols (dollar and euro) indicating fluctuations, and alert symbols like sirens and exclamation marks. Ideal for illustrating concepts of economic growth, decline, market volatility, financial crisis, investment risks, and business performance. Perfect for presentations, reports, websites, and applications related to finance, economics, and stock markets.
Free with trial A flat design vector illustration depicting a financial market data board or stock ticker. The black-bordered display features various stock symbols, numerical values like '$ ,80K', '$ ,22,50', and indicators of market performance. Prominently highlighted in red is the word 'LOSING', accompanied by a red downward arrow signifying a price drop, and a red downward triangle. Conversely, a green upward arrow indicates a price increase. This icon effectively visualizes concepts of financial loss, gain, market volatility, and investment trends, suitable for business, finance, and economic content. Decrease indicators illustrations Financial Market Data Board Icon with Loss and Gain Indicators. A flat design vector illustration depicting a financial market data board or stock ticker. The black-bordered display features various stock symbols, numerical values like '$ ,80K', '$ ,22,50', and indicators of market performance. Prominently highlighted in red is the word 'LOSING', accompanied by a red downward arrow signifying a price drop, and a red downward triangle. Conversely, a green upward arrow indicates a price increase. This icon effectively visualizes concepts of financial loss, gain, market volatility, and investment trends, suitable for business, finance, and economic content.
Free with trial A collage of nine distinct charts and graphs, primarily displaying financial data, growth trends, and economic indicators. The visuals feature line graphs, area charts, and bar charts with various colored lines and shaded areas representing different metrics over time. Accompanying text and labels suggest analysis of business performance, economic growth, and financial markets. This collection is ideal for presentations, reports, and articles related to finance, economics, and business analytics. Decrease indicators illustrations Collection of Financial and Business Growth Charts. A collage of nine distinct charts and graphs, primarily displaying financial data, growth trends, and economic indicators. The visuals feature line graphs, area charts, and bar charts with various colored lines and shaded areas representing different metrics over time. Accompanying text and labels suggest analysis of business performance, economic growth, and financial markets. This collection is ideal for presentations, reports, and articles related to finance, economics, and business analytics.
Free with trial A bustling market scene with stalls displaying upward and downward financial trends represented by glowing green and red arrows, symbolizing economic activity. Decrease indicators illustrations Market stalls with financial growth and decline indicators. A bustling market scene with stalls displaying upward and downward financial trends represented by glowing green and red arrows, symbolizing economic activity
Free with trial Featuring "LOW PRICE" text on a lightbox overlaid with downward candlestick charts and percentage performance data. Decrease indicators illustrations Low price trends and market entry opportunities reflected through real-time financial metrics and volatile trading indicators. Featuring "LOW PRICE" text on a lightbox overlaid with downward candlestick charts and percentage performance data.
Free with trial Three identical red arrows, each featuring a white percentage symbol (%) prominently displayed, are shown pointing downwards against a black background. The arrows have a slightly rounded, three-dimensional appearance, suggesting a concept of decrease or reduction. This visual could represent sales, discounts, or declining economic indicators. Decrease indicators illustrations Three red arrows pointing down with percentage signs. Three identical red arrows, each featuring a white percentage symbol (%) prominently displayed, are shown pointing downwards against a black background. The arrows have a slightly rounded, three-dimensional appearance, suggesting a concept of decrease or reduction. This visual could represent sales, discounts, or declining economic indicators
Free with trial A line graph illustrates a steady decline in values, featuring a blue line dropping toward a bright red arrow indicating a significant downward trend over time. Decrease indicators illustrations Declining trend in data representation shows significant decrease over time. A line graph illustrates a steady decline in values, featuring a blue line dropping toward a bright red arrow indicating a significant downward trend over time.
Free with trial This image showcases vibrant 3D bar and line charts, generated by AI, offering a dynamic visual representation of business data. The colorful design effectively communicates trends and comparisons across multiple data sets, providing a clear and engaging overview of key performance indicators. Decrease indicators illustrations AI-Generated 3D Business Charts. This image showcases vibrant 3D bar and line charts, generated by AI, offering a dynamic visual representation of business data. The colorful design effectively communicates trends and comparisons across multiple data sets, providing a clear and engaging overview of key performance indicators.
Free with trial A clean, minimalist icon depicting upward and downward arrows. Perfect for representing upload download, increase decrease, or input output in digital interfaces. Decrease indicators vectors Double Sided Up and Down Direction Icon. A clean, minimalist icon depicting upward and downward arrows. Perfect for representing upload download, increase decrease, or input output in digital interfaces
Free with trial A red line graph shows a steady decline in values over a period. The downward trajectory reflects a significant decrease, with data points plotted against a grid background. Decrease indicators illustrations Declining trend line illustrates significant downward movement in data over time. A red line graph shows a steady decline in values over a period. The downward trajectory reflects a significant decrease, with data points plotted against a grid background.
Free with trial This image showcases a person using a tablet to interact with business analytics data, generated by AI. The visualization includes graphs and charts, providing real-time insights into key performance indicators. This technology streamlines business decision-making. Decrease indicators illustrations AI-Powered Business Analytics. This image showcases a person using a tablet to interact with business analytics data, generated by AI. The visualization includes graphs and charts, providing real-time insights into key performance indicators. This technology streamlines business decision-making.
Free with trial The image displays a candlestick chart representing stock market price movements over a period. The chart includes green and red bars indicating price increases and decreases, respectively, with visible volatility and trading patterns. There are also technical indicators like moving averages and a trendline to help analyze market direction and potential support or resistance levels. The right side. Decrease indicators illustrations Stock market price chart showing recent trading trends and volatility. The image displays a candlestick chart representing stock market price movements over a period. The chart includes green and red bars indicating price increases and decreases, respectively, with visible volatility and trading patterns. There are also technical indicators like moving averages and a trendline to help analyze market direction and potential support or resistance levels. The right side
Free with trial A clear and versatile graphic featuring two dark grey arrows, one pointing upwards and the other downwards, centrally aligned on a transparent checkerboard background. This simple yet powerful icon visually represents concepts such as direction, movement, upload download, sorting, expansion collapse, or increase decrease. Ideal for user interface design, web and mobile applications, presentations, infographics, and any project requiring intuitive directional indicators or data flow representation. Its minimalist design ensures adaptability across various digital and print media. Decrease indicators illustrations Up and Down Arrows Icon on Transparent Background. A clear and versatile graphic featuring two dark grey arrows, one pointing upwards and the other downwards, centrally aligned on a transparent checkerboard background. This simple yet powerful icon visually represents concepts such as direction, movement, upload download, sorting, expansion collapse, or increase decrease. Ideal for user interface design, web and mobile applications, presentations, infographics, and any project requiring intuitive directional indicators or data flow representation. Its minimalist design ensures adaptability across various digital and print media.
Free with trial Visual representation of a hand reaching out over a laptop displaying quality and cost indicators, symbolizing business analysis and performance metrics in a modern setting. Qubit. Decrease indicators illustrations Hand Reaching Out Over Laptop Displaying Quality and Cost Percentage Indicators in a Dark Background for Business. Visual representation of a hand reaching out over a laptop displaying quality and cost indicators, symbolizing business analysis and performance metrics in a modern setting. Qubit
Free with trial Financial chart arrows. Colored trend lines. Market direction indicators. Vector graph elements. EPS 10. Decrease indicators vectors Financial chart arrows. Colored trend lines. Market direction indicators. Vector graph elements
Free with trial A clear, minimalist vector illustration featuring two distinct directional icons against a clean white background. On the left, a green downward-pointing triangle is paired with four green horizontal rounded bars, symbolizing download, collapse, or a decrease. On the right, a red upward-pointing triangle is combined with four red horizontal rounded bars, representing upload, expand, or an increase. These graphic elements are ideal for user interface design, web applications, mobile apps, presentations, or any project requiring clear visual indicators for data transfer, status, or directional actions. Decrease indicators vectors Download and Upload Icons: Green Down, Red Up Arrows with Bars. A clear, minimalist vector illustration featuring two distinct directional icons against a clean white background. On the left, a green downward-pointing triangle is paired with four green horizontal rounded bars, symbolizing download, collapse, or a decrease. On the right, a red upward-pointing triangle is combined with four red horizontal rounded bars, representing upload, expand, or an increase. These graphic elements are ideal for user interface design, web applications, mobile apps, presentations, or any project requiring clear visual indicators for data transfer, status, or directional actions.
Free with trial Growth and Decline Icons: Up Down Arrow Graphics: Explore a set of icons illustrating growth (up arrow) and decline (down arrow) with a dynamic, zigzag line within rounded and sharp squares. Ideal for representing trends and changes. Decrease indicators illustrations Growth and Decline Icons: Up Down Arrow Graphics, Positive Negative Trend Symbols: Stock Market Indicators. Growth and Decline Icons: Up Down Arrow Graphics: Explore a set of icons illustrating growth (up arrow) and decline (down arrow) with a dynamic, zigzag line within rounded and sharp squares. Ideal for representing trends and changes.
Free with trial Downward trend graph with arrow indicators on a white background. Decrease indicators vectors Downward trend graph with arrow indicators on a white background