Free with trial Flag with a declining bar chart and down arrows, symbolizing decline in data, performance, or various national indicators in the. Decrease indicators illustrations Flag with a declining bar chart and down arrows, symbolizing decline in data, performance, or various national indicators in the
Free with trial A modern business analytics dashboard showcasing key performance indicators (KPIs) with engaging charts and graphs for data visualization Ideal for presentations and reports. Generative AI. Decrease indicators illustrations Business Analytics Dashboard Graphs Charts Data Performance Growth Metrics KPI. A modern business analytics dashboard showcasing key performance indicators (KPIs) with engaging charts and graphs for data visualization Ideal for presentations and reports. Generative AI
Free with trial This image features a clear financial chart on a plain white background, illustrating a significant downward trend. A bold red line with an arrow points sharply downwards, symbolizing decline, loss, or a crisis. A grey line, possibly representing historical data or another metric, also shows a general downward movement. This visual effectively conveys concepts of economic recession, market crash, poor business performance, or financial distress. It's ideal for presentations, reports, news articles, or any content discussing negative economic indicators, investment risks, or strategic challenges. Decrease indicators vectors Financial Chart Illustrating Economic Decline and Market Downturn. This image features a clear financial chart on a plain white background, illustrating a significant downward trend. A bold red line with an arrow points sharply downwards, symbolizing decline, loss, or a crisis. A grey line, possibly representing historical data or another metric, also shows a general downward movement. This visual effectively conveys concepts of economic recession, market crash, poor business performance, or financial distress. It's ideal for presentations, reports, news articles, or any content discussing negative economic indicators, investment risks, or strategic challenges.
Free with trial Albania flag with a declining bar chart and down arrows, symbolizing decline in data, performance, or various national indicators. Decrease indicators illustrations Flag with a declining bar chart and down arrows, symbolizing decline in data, performance, or various national indicators in the
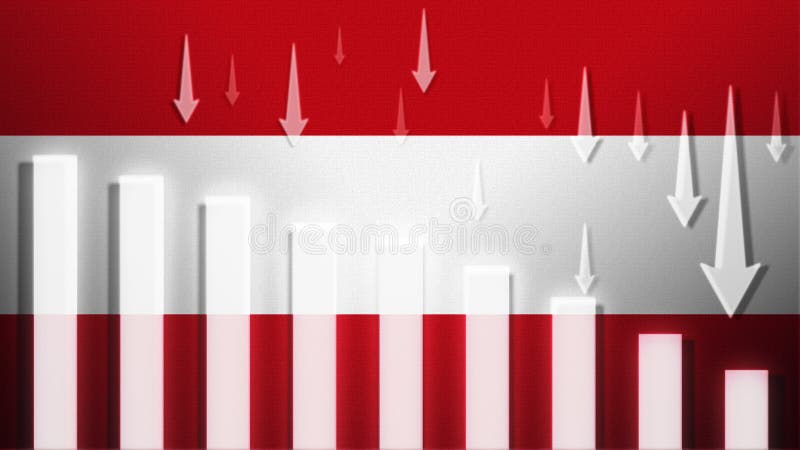
Free with trial Austria flag with a declining bar chart and down arrows, symbolizing decline in data, performance, or various national indicators. Decrease indicators illustrations Flag with a declining bar chart and down arrows, symbolizing decline in data, performance, or various national indicators in the
Free with trial Argentina flag with a declining bar chart and down arrows, symbolizing decline in data, performance, or various national indicators. Decrease indicators illustrations Flag with a declining bar chart and down arrows, symbolizing decline in data, performance, or various national indicators in the
Free with trial Woman entrepreneur is experiencing problems in business, standing near falling chart and holding thermometer in mouth. Businesslady learned about company stagnation and decline in business indicators. Decrease indicators vectors Woman entrepreneur is experiencing problems in business, standing near falling chart
Free with trial Inflation post it on blue background. Decrease indicators illustrations Inflation post it on blue
Free with trial Analytics, rising and falling trend. Deposits and loans. Economy and business. Income and Loss. Stock exchange trading. Decrease indicators illustrations Analytics, rising and falling trend. Deposits and loans.
Free with trial A minimalist, black and white vector illustration depicting a financial graph with a clear downward trend. The graph features a jagged line representing fluctuating data, leading into a bold, thick arrow pointing downwards and to the right. This icon symbolizes decline, loss, recession, or negative performance in various contexts, such as business, economics, or stock markets. Its clean design makes it versatile for presentations, websites, and infographics. Decrease indicators vectors Downward Trend Graph with Arrow Icon. A minimalist, black and white vector illustration depicting a financial graph with a clear downward trend. The graph features a jagged line representing fluctuating data, leading into a bold, thick arrow pointing downwards and to the right. This icon symbolizes decline, loss, recession, or negative performance in various contexts, such as business, economics, or stock markets. Its clean design makes it versatile for presentations, websites, and infographics.
Free with trial Trend Down : Trend down indicates a decrease in financial performance, market value, or economic indicators over time. Decrease indicators vectors Trend Down
Free with trial Professional golden user icon with downward graph symbol for loss or risk analytics, glossy finish suitable for financial reports, deficit tracking, and negative trend indicators. Decrease indicators illustrations Professional golden user icon with downward graph symbol for loss or risk analytics, glossy finish suitable for financial reports
Free with trial Sales performance, data analysis, business strategy, financial downturn, decision making, marketing insights. Arrow pointing down with sale text, charts check mark. Sales performance and data. Decrease indicators vectors Sales Analytics and Performance Metrics with Downward Trends and Checkmark. Sales performance, data analysis, business strategy, financial downturn, decision making, marketing insights. Arrow pointing down with sale text, charts check mark. Sales performance and data
Free with trial Abstract bull and bear market graph. Decrease indicators illustrations Bull and Bear Neon Silhouettes on Stock Market Data Chart Background. Abstract bull and bear market graph
Free with trial A clean black and white set of nine vector icons showing growth, decline, stability, and financial trends for business presentations and reports. Decrease indicators vectors Economic trend icons set flat design vector illustration. A clean black and white set of nine vector icons showing growth, decline, stability, and financial trends for business presentations and reports.
Free with trial Data displays price changes for various stocks. Decrease indicators illustrations Market trends show price movements for stocks and investments over time. Data displays price changes for various stocks
Free with trial A row of wooden blocks with different emotions, presenting sticky note word text phrase "CREDIT SCORE" level of bad fair, good and excellent. Decrease indicators illustrations Wooden blocks with sticky note word text phrase \'CREDIT SCORE\'. A row of wooden blocks with different emotions, presenting sticky note word text phrase "CREDIT SCORE" level of bad fair, good and excellent
Free with trial Minimalist 3D set of green upward and red downward arrows, isolated on a white background. Realistic glossy render for financial market analysis, stock trading indicators, profit and loss comparison. Decrease indicators vectors Minimalist 3D set of green upward and red downward arrows, isolated on a white background
Free with trial Financial market chart with burning sun. Decrease indicators illustrations Global stock market trading chart with financial data and candles, dark theme, red orange. Financial market chart with burning sun
Free with trial A versatile collection of eight distinct black arrows, each featuring a unique stylized and abstract design. These dynamic arrows uniformly point downwards, conveying concepts of direction, movement, download, or decline. Rendered in a bold black on a clean white background, this set is ideal for modern graphic design projects, web interfaces, app icons, infographics, logos, or any application requiring clear and impactful directional indicators. Decrease indicators vectors Dynamic Black Downward Arrows Collection. A versatile collection of eight distinct black arrows, each featuring a unique stylized and abstract design. These dynamic arrows uniformly point downwards, conveying concepts of direction, movement, download, or decline. Rendered in a bold black on a clean white background, this set is ideal for modern graphic design projects, web interfaces, app icons, infographics, logos, or any application requiring clear and impactful directional indicators.
Free with trial A chart displays financial data with yellow bars. Decrease indicators illustrations Chart displays financial data trends with yellow bars and purple waves in a grid layout. A chart displays financial data with yellow bars
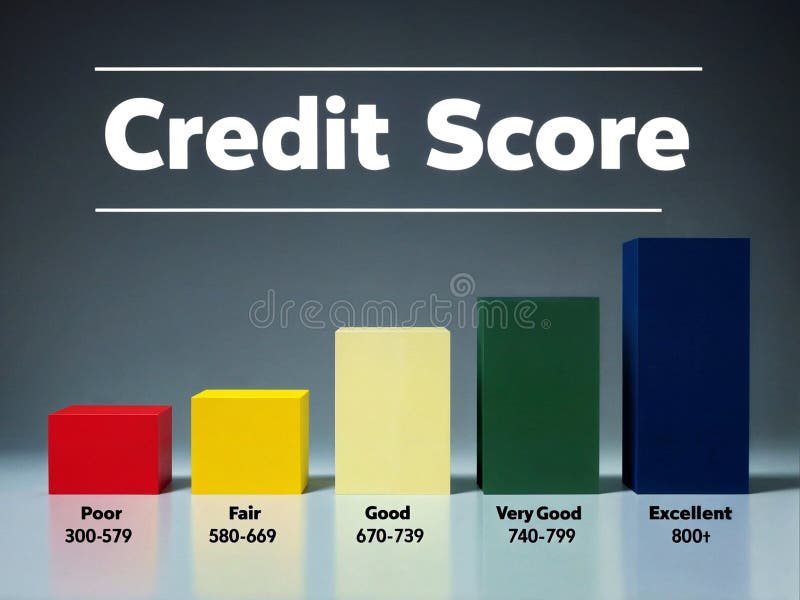
Free with trial 3d render illustration of increasing progress bar of indicating poor, fair, good, very good and excellent level of creditworthiness. Decrease indicators illustrations 3d illustration render progress bars indicating credit score level. 3d render illustration of increasing progress bar of indicating poor, fair, good, very good and excellent level of creditworthiness
Free with trial This abstract illustration depicts the dynamic nature of financial markets, showcasing both significant volatility and an overall upward growth trend. A prominent red line graph indicates positive development, while underlying grey jagged lines and vertical bars represent frequent fluctuations and market uncertainty. To the right, orange up and down arrows symbolize the opposing forces and constant changes within the market. This visual is ideal for conveying concepts related to stock market performance, economic indicators, investment risks, and business analysis. Decrease indicators vectors Financial Market Volatility and Growth Trend. This abstract illustration depicts the dynamic nature of financial markets, showcasing both significant volatility and an overall upward growth trend. A prominent red line graph indicates positive development, while underlying grey jagged lines and vertical bars represent frequent fluctuations and market uncertainty. To the right, orange up and down arrows symbolize the opposing forces and constant changes within the market. This visual is ideal for conveying concepts related to stock market performance, economic indicators, investment risks, and business analysis.
Free with trial A comprehensive collection of 12 modern, abstract vector icons designed for business, finance, and data analytics themes. This vibrant set features geometric shapes, upward-trending bar charts, risk indicators, decision-making prompts like "YES" and "NO," and numerical data representations. Perfect for enhancing presentations, reports, websites, mobile applications, and infographics, these versatile symbols convey concepts of growth, strategy, risk management, market analysis, and progress with a clean, contemporary aesthetic. Decrease indicators vectors Business and Data Analytics Abstract Icon Set. A comprehensive collection of 12 modern, abstract vector icons designed for business, finance, and data analytics themes. This vibrant set features geometric shapes, upward-trending bar charts, risk indicators, decision-making prompts like "YES" and "NO," and numerical data representations. Perfect for enhancing presentations, reports, websites, mobile applications, and infographics, these versatile symbols convey concepts of growth, strategy, risk management, market analysis, and progress with a clean, contemporary aesthetic.
Free with trial A display of financial data with charts, graphs, and statistics showing market trends and analysis details. Decrease indicators illustrations Financial data charts showcasing stock market trends. A display of financial data with charts, graphs, and statistics showing market trends and analysis details
Free with trial A minimalist vector icon illustrating market volatility and financial trends. The graphic features two distinct line graphs on a coordinate system: a jagged, highly fluctuating upper line representing high volatility, and a smoother lower line with marked points indicating a general trend. Up-down arrows and separate up down indicators further emphasize market movement and unpredictable changes. Ideal for financial reports, business presentations, data visualization, and economic analysis. Decrease indicators vectors Market Volatility and Financial Trend Graph Icon. A minimalist vector icon illustrating market volatility and financial trends. The graphic features two distinct line graphs on a coordinate system: a jagged, highly fluctuating upper line representing high volatility, and a smoother lower line with marked points indicating a general trend. Up-down arrows and separate up down indicators further emphasize market movement and unpredictable changes. Ideal for financial reports, business presentations, data visualization, and economic analysis.
Free with trial A comprehensive vector icon set depicting various aspects of online video content creation and social media analytics. This collection includes symbols for growth charts, play buttons, speech bubbles representing comments or chat, subscriber counts, watch time indicators, and percentage-based progress arrows. Ideal for illustrating concepts related to video platforms, digital marketing, content creator dashboards, performance reports, and online engagement strategies. The modern flat design makes it suitable for websites, mobile applications, and presentations. Decrease indicators vectors Video Content and Social Media Analytics Icon Set. A comprehensive vector icon set depicting various aspects of online video content creation and social media analytics. This collection includes symbols for growth charts, play buttons, speech bubbles representing comments or chat, subscriber counts, watch time indicators, and percentage-based progress arrows. Ideal for illustrating concepts related to video platforms, digital marketing, content creator dashboards, performance reports, and online engagement strategies. The modern flat design makes it suitable for websites, mobile applications, and presentations.
Free with trial A 3D-rendered image depicts a red arrow pointing downwards, symbolizing a market decline or economic downturn. The arrow rests on a dark, textured surface, enhancing the visual representation of hardship. This image, generated by AI, is ideal for illustrating articles or presentations concerning fin. Decrease indicators illustrations Downward Trend. A 3D-rendered image depicts a red arrow pointing downwards, symbolizing a market decline or economic downturn. The arrow rests on a dark, textured surface, enhancing the visual representation of hardship. This image, generated by AI, is ideal for illustrating articles or presentations concerning fin
Free with trial This comprehensive vector icon set illustrates various financial market trends, economic indicators, and potential crises. Featuring line graphs, bar charts, pie charts, dollar signs, piggy banks, and warning sirens, the collection uses a striking red and black color palette to depict both growth and decline. Concepts like stock market volatility, investment risks, economic downturns, and business analytics are visually represented. Ideal for financial reports, business presentations, economic news, investment platforms, and educational materials requiring clear and impactful visual communication of market dynamics. Decrease indicators vectors Financial Market Trends and Crisis Vector Icons Set. This comprehensive vector icon set illustrates various financial market trends, economic indicators, and potential crises. Featuring line graphs, bar charts, pie charts, dollar signs, piggy banks, and warning sirens, the collection uses a striking red and black color palette to depict both growth and decline. Concepts like stock market volatility, investment risks, economic downturns, and business analytics are visually represented. Ideal for financial reports, business presentations, economic news, investment platforms, and educational materials requiring clear and impactful visual communication of market dynamics.
Free with trial A comprehensive vector icon set featuring essential symbols for business, finance, and data analysis. This collection includes various arrows for indicating growth and decline, wavy lines representing market trends, checkmarks for success or approval, X marks for errors or rejection, stopwatches for time management and efficiency, and stacks of coins with dollar signs for financial concepts. Ideal for presentations, infographics, web design, and reports to visually communicate progress, status, and economic indicators. Decrease indicators vectors Business, Finance, and Data Analytics Vector Icon Set. A comprehensive vector icon set featuring essential symbols for business, finance, and data analysis. This collection includes various arrows for indicating growth and decline, wavy lines representing market trends, checkmarks for success or approval, X marks for errors or rejection, stopwatches for time management and efficiency, and stacks of coins with dollar signs for financial concepts. Ideal for presentations, infographics, web design, and reports to visually communicate progress, status, and economic indicators.
Free with trial A vibrant digital explosion of glowing stock market data, featuring percentage gains and losses, trading volumes, and financial charts on a dark background. Decrease indicators illustrations Digital Stock Market Data Explosion with Glowing Graphs Percentages and Financial Numbers. A vibrant digital explosion of glowing stock market data, featuring. A vibrant digital explosion of glowing stock market data, featuring percentage gains and losses, trading volumes, and financial charts on a dark background
Free with trial A glowing red 3D coin with a downward arrow symbol, floating against a digital background featuring declining bar charts and bearish market indicators. The neon red lighting emphasizes loss, downturn, risk, volatility, and negative financial trends. Ideal for illustrating stock market crashes, crypto decline, recession concepts, falling prices, and economic downturn visuals. This image is Generated with the help of AI. Decrease indicators illustrations Bearish red 3D coin with down arrow and falling market chart. A glowing red 3D coin with a downward arrow symbol, floating against a digital background featuring declining bar charts and bearish market indicators. The neon red lighting emphasizes loss, downturn, risk, volatility, and negative financial trends. Ideal for illustrating stock market crashes, crypto decline, recession concepts, falling prices, and economic downturn visuals. This image is Generated with the help of AI.
Free with trial A row of wooden blocks with different emotions, presenting sticky note word text phrase "CREDIT SCORE" level of bad fair, good and excellent. Decrease indicators illustrations Wooden blocks with different emotions, presenting sticky note word text phrase \'CREDIT SCORE\'. A row of wooden blocks with different emotions, presenting sticky note word text phrase "CREDIT SCORE" level of bad fair, good and excellent
Free with trial Economic growth and decline. Profit and loss. Trading on stock exchanges and markets. Bring your business into profit. Decrease indicators illustrations Economic growth and decline. Profit and loss.
Free with trial This visually striking image depicts a futuristic financial concept. Scattered coins on a dark surface are illuminated by glowing neon percentages (1%, 10%, 20%, 30%, 50%, 100%). A subtle network of lines and lights in the background suggests a digital or abstract representation of data and growth. The composition evokes themes of investment, progress, and financial targets, suitable for business, finance, and technology-related content. Decrease indicators illustrations Digital Growth and Financial Percentages. This visually striking image depicts a futuristic financial concept. Scattered coins on a dark surface are illuminated by glowing neon percentages (1%, 10%, 20%, 30%, 50%, 100%). A subtle network of lines and lights in the background suggests a digital or abstract representation of data and growth. The composition evokes themes of investment, progress, and financial targets, suitable for business, finance, and technology-related content.
Free with trial This image presents a detailed analysis of business performance metrics, including market share, quarterly sales, and key performance indicators (KPIs. Decrease indicators illustrations Comprehensive business performance metrics and growth analysis. This image presents a detailed analysis of business performance metrics, including market share, quarterly sales, and key performance indicators (KPIs
Free with trial A comprehensive vector icon collection illustrating various aspects of financial crises, market downturns, and economic challenges. This set includes symbols like bull and bear market dynamics, broken shields representing risk and vulnerability, declining bar charts, candlestick patterns, and emergency indicators. Concepts such as bankruptcy, recession, financial loss, and market volatility are visually conveyed. Ideal for financial news, economic reports, business presentations, educational materials, and articles discussing market risks or economic forecasts. Decrease indicators vectors Financial Crisis, Market Downturn, and Bankruptcy Vector Icons Set. A comprehensive vector icon collection illustrating various aspects of financial crises, market downturns, and economic challenges. This set includes symbols like bull and bear market dynamics, broken shields representing risk and vulnerability, declining bar charts, candlestick patterns, and emergency indicators. Concepts such as bankruptcy, recession, financial loss, and market volatility are visually conveyed. Ideal for financial news, economic reports, business presentations, educational materials, and articles discussing market risks or economic forecasts.
Free with trial Blue heart with heartbeat line, upward and downward arrows suggesting change. Ideal for health tracking, fitness, wellness, analytics, growth, decline, and simple landing page. Decrease indicators vectors Heartbeat and Arrows Indicating Increase and Decrease in Health and Wellness Indicators. Blue heart with heartbeat line, upward and downward arrows suggesting change. Ideal for health tracking, fitness, wellness, analytics, growth, decline, and simple landing page
Free with trial A row of wooden blocks with different emotions, presenting sticky note word text phrase "CREDIT SCORE" level of bad fair, good and excellent. Decrease indicators illustrations A row of wooden blocks with different emotions, presenting sticky note word text phrase \'CREDIT SCORE\'. A row of wooden blocks with different emotions, presenting sticky note word text phrase "CREDIT SCORE" level of bad fair, good and excellent
Free with trial Gold badge with minus symbol representing reduction, limitation, and control adjustment. Suitable for system settings, restriction indicators, and management tools across various platforms. Decrease indicators vectors Gold award badge with minus symbol representing restriction reduction limitation and control adjustment. Gold badge with minus symbol representing reduction, limitation, and control adjustment. Suitable for system settings, restriction indicators, and management tools across various platforms
Free with trial Futuristic Collaboration Between Human and Robot in Real Estate Market with House Icon and Declining Graph Indicators Sigmoid. Decrease indicators illustrations A unique representation of human and robotic interaction in the real estate sector, showcasing a house icon with. Futuristic Collaboration Between Human and Robot in Real Estate Market with House Icon and Declining Graph Indicators Sigmoid
Free with trial A close-up shot of a smartphone displaying a stock market chart, showing fluctuating prices. The dark theme enhances the visual impact of the pink graph line, generated by AI for a modern and sleek aesthetic. This image is perfect for illustrating financial technology, mobile trading, and investmen. Decrease indicators illustrations Mobile Stock Market Chart. A close-up shot of a smartphone displaying a stock market chart, showing fluctuating prices. The dark theme enhances the visual impact of the pink graph line, generated by AI for a modern and sleek aesthetic. This image is perfect for illustrating financial technology, mobile trading, and investmen
Free with trial Doodle drawing of a yellow indian rupee symbol with blue falling coins and descending arrows showing monetary loss and economic downturn alpha transparent. Keywords. Decrease indicators vectors Decreasing indian currency value with falling coins and downward indicators comic doodle alpha transparent. doodle drawing of a yellow indian rupee symbol with blue falling coins and descending arrows showing monetary loss and economic downturn alpha transparent.Keywords
Free with trial This vector illustration set features six distinct icons representing key financial and economic concepts. It includes bar charts depicting growth with a green arrow and decline with a red arrow, alongside currency exchange rate indicators for USD, INR, and EUR. Two donut charts visualize data distribution, while a world map colored green and red signifies global market trends or segmentation. Ideal for business presentations, financial reports, economic analysis, and investment-related content, these versatile graphics convey complex data clearly and concisely. Decrease indicators vectors Financial Growth, Decline, and Global Market Data Visualization Icons Set. This vector illustration set features six distinct icons representing key financial and economic concepts. It includes bar charts depicting growth with a green arrow and decline with a red arrow, alongside currency exchange rate indicators for USD, INR, and EUR. Two donut charts visualize data distribution, while a world map colored green and red signifies global market trends or segmentation. Ideal for business presentations, financial reports, economic analysis, and investment-related content, these versatile graphics convey complex data clearly and concisely.
Free with trial A magnifying glass rests on gold coins atop a financial chart, generated by AI. This image symbolizes the detailed examination and analysis needed for successful investment strategies in the volatile world of finance. The visual representation highlights the intricate process of studying market tre. Decrease indicators illustrations Financial Market Analysis. A magnifying glass rests on gold coins atop a financial chart, generated by AI. This image symbolizes the detailed examination and analysis needed for successful investment strategies in the volatile world of finance. The visual representation highlights the intricate process of studying market tre
Free with trial This image presents a compelling visual representation of a global economic downturn. A prominent, three-dimensional white arrow dramatically plunges downward, superimposed on a world map rendered in dark, somber tones. The map serves as a backdrop to several red bar graphs, illustrating a decline in various economic indicators across different regions of the globe. The overall color scheme reinforces a sense of crisis and uncertainty. The arrow's sharp descent visually emphasizes the severity of the economic drop. Numerical data and graphical representations are included, further supporting the downward economic trend. Decrease indicators illustrations Global Economic Downturn Visualized with 3D Arrow and Charts. This image presents a compelling visual representation of a global economic downturn. A prominent, three-dimensional white arrow dramatically plunges downward, superimposed on a world map rendered in dark, somber tones. The map serves as a backdrop to several red bar graphs, illustrating a decline in various economic indicators across different regions of the globe. The overall color scheme reinforces a sense of crisis and uncertainty. The arrow's sharp descent visually emphasizes the severity of the economic drop. Numerical data and graphical representations are included, further supporting the downward economic trend.
Free with trial Deflation Modern Outline Style Icon Design. Decrease indicators vectors Deflation Outline Vector Icon. Deflation Modern Outline Style Icon Design
Free with trial Two cardboard houses, one larger than the other, depict percentage increases in house prices, generated by AI. This visualization effectively communicates the impact of fluctuating real estate market values. Decrease indicators illustrations House Price Percentage Increase. Two cardboard houses, one larger than the other, depict percentage increases in house prices, generated by AI. This visualization effectively communicates the impact of fluctuating real estate market values.
Free with trial This illustration shows a downward trend for the US dollar and an upward trend for the Japanese Yen, generated by AI. The graphic uses stylized gold coins with currency symbols and directional arrows to clearly visualize the contrasting market movements. Decrease indicators illustrations USD vs. Yen: Currency Fluctuation. This illustration shows a downward trend for the US dollar and an upward trend for the Japanese Yen, generated by AI. The graphic uses stylized gold coins with currency symbols and directional arrows to clearly visualize the contrasting market movements.
Free with trial Stack of gold coins are arranged against a backdrop of a red descending graph line, signifying financial loss, economic downturn, and market challenges. Image is generated using AI. Decrease indicators illustrations Stack Of Coins With Falling Graph. Stack of gold coins are arranged against a backdrop of a red descending graph line, signifying financial loss, economic downturn, and market challenges. Image is generated using AI
Free with trial A graph displays trading data with green and red bars showing price changes during a stock trading session. Investors analyze the fluctuations and trends. Decrease indicators vectors A graph displays trading data with green and red bars showing price changes during a stock trading session. Investors analyze the
Free with trial The chart displays a candlestick pattern where the prices fluctuate over time. Different colors represent price movements and trading activity during sessions. Decrease indicators vectors The chart displays a candlestick pattern where the prices fluctuate over time. Different colors represent price movements and
Free with trial A set of twelve black icons representing business and data analysis concepts, presented on a white background. The icons include various types of charts and graphs such as bar charts, a pie chart, and line graphs showing trends and fluctuations. There are also icons for data visualization, progress indicators, and reports. The collection is organized in a 3x4 grid. Decrease indicators vectors Business and data analytics icons bar chart pie chart AI-Generated. A set of twelve black icons representing business and data analysis concepts, presented on a white background. The icons include various types of charts and graphs such as bar charts, a pie chart, and line graphs showing trends and fluctuations. There are also icons for data visualization, progress indicators, and reports. The collection is organized in a 3x4 grid
Free with trial Abstract close-up view of a digital display showing a fluctuating financial chart. The orange graph line is highlighted against a dark blue background with a complex grid pattern, suggesting data streaming and analysis. The image evokes a sense of technology, market trends, and financial information. Suitable for use in articles, presentations, or websites related to finance, technology, data analysis, and business. Decrease indicators illustrations Dynamic Financial Data Visualization. Abstract close-up view of a digital display showing a fluctuating financial chart. The orange graph line is highlighted against a dark blue background with a complex grid pattern, suggesting data streaming and analysis. The image evokes a sense of technology, market trends, and financial information. Suitable for use in articles, presentations, or websites related to finance, technology, data analysis, and business.
Free with trial A downward arrow made of smoke indicates economic loss in a dark setting, symbolizing market decline. Decrease indicators illustrations Smoke arrow pointing down showing economic loss in a dark background Generative AI. A downward arrow made of smoke indicates economic loss in a dark setting, symbolizing market decline
Free with trial Economics, healthcare, pharmaceutical industry, quality certification, cost analysis, success indicators. Blue arrow pointing down, reward ribbon and vials. Economic trends and healthcare industry. Decrease indicators vectors Graph Downward Arrow, Reward Ribbon, and Medical Vials Concept for Decreasing Medical Costs and Quality Assurance. Economics, healthcare, pharmaceutical industry, quality certification, cost analysis, success indicators. Blue arrow pointing down, reward ribbon and vials. Economic trends and healthcare industry
Free with trial Computer screen displaying a webinar with a presenter explaining graphs and charts, recording indicators, audio, and HD video tags. Ideal for e-learning, remote work, business, analytics. Decrease indicators vectors Online Webinar on Business Metrics with Recording and Data Analytics Representation. Computer screen displaying a webinar with a presenter explaining graphs and charts, recording indicators, audio, and HD video tags. Ideal for e-learning, remote work, business, analytics
Free with trial The Price-to-Earnings (P E) ratio, and how is it used in stock valuation. Decrease indicators illustrations Financial Market Data Display: Red Stock Market Trend. the Price-to-Earnings (P E) ratio, and how is it used in stock valuation
Free with trial A futuristic digital infographic showcasing business strategy and growth. The scene features glowing charts, bar graphs, circular progress indicators with percentages, and stacks of gold coins, symbolizing financial success. A prominent neon arrow curves upwards, indicating a positive trend and progress. The dark, high-tech background enhances the visual impact, making it ideal for presentations on finance, business, technology, and data analysis. Decrease indicators illustrations Digital Growth Infographic with Financial Data and Upward Trend Arrow. A futuristic digital infographic showcasing business strategy and growth. The scene features glowing charts, bar graphs, circular progress indicators with percentages, and stacks of gold coins, symbolizing financial success. A prominent neon arrow curves upwards, indicating a positive trend and progress. The dark, high-tech background enhances the visual impact, making it ideal for presentations on finance, business, technology, and data analysis.
Free with trial This graphic depicts a bar chart with a downward trending line, observed closely with a magnifying glass, symbolizing scrutiny, analysis, and potential performance decline or investigation of data. Decrease indicators vectors Declining Chart with Magnifying Glass: Analysis and Performance Review. This graphic depicts a bar chart with a downward trending line, observed closely with a magnifying glass, symbolizing scrutiny, analysis, and potential performance decline or investigation of data.
Free with trial Up and Down Arrows Inside Target Graphic Illustration Representing Directional Motion and Strategy. Decrease indicators vectors Up and Down Arrows Inside Target Graphic Illustration Representing Directional Motion and Strategy
Free with trial Deflation on white paper background. Decrease indicators illustrations Deflation on white paper
Free with trial This infographic-style image visually represents business growth and financial performance through various charts and graphs. A line graph illustrates revenue trends with percentage markers, a donut chart displays market share distribution, and a bar chart shows quarterly profit figures. Icons representing data, growth, and reports are subtly integrated into the background, creating a professional and informative visual for business and finance-related content. Decrease indicators illustrations Business Growth and Financial Performance Analytics. This infographic-style image visually represents business growth and financial performance through various charts and graphs. A line graph illustrates revenue trends with percentage markers, a donut chart displays market share distribution, and a bar chart shows quarterly profit figures. Icons representing data, growth, and reports are subtly integrated into the background, creating a professional and informative visual for business and finance-related content.
Free with trial This whiteboard displays hand-drawn charts illustrating a sharp market decline. The red lines, representing a dramatic downturn, are prominently featured, alongside other less defined financial graphs. This image was generated by AI for illustrative purposes. Decrease indicators illustrations Red Ink Market Crash Whiteboard. This whiteboard displays hand-drawn charts illustrating a sharp market decline. The red lines, representing a dramatic downturn, are prominently featured, alongside other less defined financial graphs. This image was generated by AI for illustrative purposes.
Free with trial Graphic element displays contrasting financial indicators featuring a jagged green arrow pointing up signifying growth alongside a similar red arrow pointing sharply down representing decline or market correction. Decrease indicators vectors Graphic representation contrasting upward trending market growth with sharp downward trending financial decline. Graphic element displays contrasting financial indicators featuring a jagged green arrow pointing up signifying growth alongside a similar red arrow pointing sharply down representing decline or market correction
Free with trial Revenue turnover word block on white background. Decrease indicators illustrations Revenue turnover word block on white
Free with trial This futuristic visualization, generated by AI, depicts a global Bitcoin network, highlighting its worldwide reach and digital infrastructure. Data streams and interactive elements showcase the complex interplay of transactions and information flow within the cryptocurrency ecosystem. Decrease indicators illustrations Global Bitcoin Network