Free with trial This image features a striking red zigzag arrow pointing downward, symbolizing a decrease, decline, or downward trend. The sharp angles and bold color make it visually impactful, often used in contexts like financial reports, data presentations, or general indicators of reduction. Decrease indicators illustrations A bold downward zigzag arrow indicating a decline or reduction trend. This image features a striking red zigzag arrow pointing downward, symbolizing a decrease, decline, or downward trend. The sharp angles and bold color make it visually impactful, often used in contexts like financial reports, data presentations, or general indicators of reduction
Free with trial Digital tablet displaying real-time gold price chart with line graphs, market indicators. Investment analysis, financial market data, trading concept. Tablet is on gold bars financial. Decrease indicators illustrations Digital tablet displaying real-time gold price chart with line graphs, market indicators. Investment analysis, financial market
Free with trial Estonia flag with a declining bar chart and down arrows, symbolizing decline in data, performance, or various national indicators. Decrease indicators illustrations Flag with a declining bar chart and down arrows, symbolizing decline in data, performance, or various national indicators in the
Free with trial Large three dimensional green arrow facing downwards, symbol for decrease decline lower prices or falling trends in economy and business sectors. Decrease indicators illustrations Green arrow pointing down isolated on white for negative indicators. Large three dimensional green arrow facing downwards, symbol for decrease decline lower prices or falling trends in economy and business sectors
Free with trial Solid red arrow symbol oriented downwards on white surface. Simple graphic design element for navigation instructions and digital interface indicators. Decrease indicators illustrations Red arrow pointing down direction icon isolated on white background. Solid red arrow symbol oriented downwards on white surface. Simple graphic design element for navigation instructions and digital interface indicators
Free with trial A detailed map of Arizona in dark blue with white state outlines features six vertical bars highlighting federal budget cuts in red across different sectors including education with the highest reduction infrastructure with the lowest healthcare labeled as Medicare and additional color-coded bars showing variations in budget reductions through gray orange yellow and green indicators that visualize. Decrease indicators illustrations Arizona state map with federal budget cuts highlighted in red showing impact on education infrastructure healthcare and other. A detailed map of Arizona in dark blue with white state outlines features six vertical bars highlighting federal budget cuts in red across different sectors including education with the highest reduction infrastructure with the lowest healthcare labeled as Medicare and additional color-coded bars showing variations in budget reductions through gray orange yellow and green indicators that visualize
Free with trial Red down arrow and green up arrow with percentage signs represent financial rate changes market fluctuations price adjustments and economic trends. Decrease indicators vectors Percentage up and down arrows indicating financial rate increase and decrease. Red down arrow and green up arrow with percentage signs represent financial rate changes market fluctuations price adjustments and economic trends
Free with trial A blue umbrella shelters from a stormy sky, numerous downward-pointing red arrows hang beneath it, symbolizing protection against falling negative indicators. Decrease indicators illustrations Blue Umbrella Shielding from Red Downward Arrows under Stormy Sky. A blue umbrella shelters from a stormy sky, numerous downward-pointing red arrows hang beneath it, symbolizing protection against falling negative indicators
Free with trial Conceptual infographic showing diesel fuel storage tanks and a distribution pathway with price indicators and labels. Decrease indicators illustrations Diesel price spike illustrated with harbor fuel storage and distribution network. Conceptual infographic showing diesel fuel storage tanks and a distribution pathway with price indicators and labels
Free with trial The image displays a simple bar chart composed of five red bars of varying heights. Each bar has arrows pointing upward or downward, indicating an increase or decrease in values. The chart visually represents fluctuations in data, with the tallest bar in the center and the shortest bars on the far left and right. Decrease indicators illustrations Red bar chart with upward and downward directional arrows indicating trends. The image displays a simple bar chart composed of five red bars of varying heights. Each bar has arrows pointing upward or downward, indicating an increase or decrease in values. The chart visually represents fluctuations in data, with the tallest bar in the center and the shortest bars on the far left and right
Free with trial The image features three identical red arrows pointing downward, each displaying a percentage symbol. This visual metaphor commonly represents a decline or reduction in percentages, often used in contexts like financial decreases, discount promotions, or rate reductions. Decrease indicators illustrations Three red downward arrows symbolizing a decrease in percentage rates or discounts. The image features three identical red arrows pointing downward, each displaying a percentage symbol. This visual metaphor commonly represents a decline or reduction in percentages, often used in contexts like financial decreases, discount promotions, or rate reductions
Free with trial A stark visual representation of fluctuating interest rates and housing market dynamics. A red arrow points downward, symbolizing a decrease, while a green house features a percentage symbol suggesting a change. Decrease indicators illustrations Red down arrow and green house with percentage symbols indicating financial trends. A stark visual representation of fluctuating interest rates and housing market dynamics. A red arrow points downward, symbolizing a decrease, while a green house features a percentage symbol suggesting a change
Free with trial The image displays a business analytics dashboard on a laptop screen. It includes key performance indicators such as total revenue of $70,888, with a monthly revenue of $22,869. The dashboard also shows new customers, with a total of 34,999 and a recent month's new customers at 12,089. A pie chart represents sales performance across four categories, with percentages of 35%, 30%, 25%, and 10%. Decrease indicators illustrations Business dashboard showing total revenue, sales performance, and new customer trends. The image displays a business analytics dashboard on a laptop screen. It includes key performance indicators such as total revenue of $70,888, with a monthly revenue of $22,869. The dashboard also shows new customers, with a total of 34,999 and a recent month's new customers at 12,089. A pie chart represents sales performance across four categories, with percentages of 35%, 30%, 25%, and 10%.
Free with trial 3D bar and line chart showing stock market performance with percentage gains and candlestick patterns. Decrease indicators vectors Financial stock market growth chart with percentage gains and candlestick indicators. 3D bar and line chart showing stock market performance with percentage. 3D bar and line chart showing stock market performance with percentage gains and candlestick patterns
Free with trial The image displays three bold red arrows pointing downward, each containing a percentage symbol. This visual metaphor typically represents a decline, reduction, or drop in percentage-based metrics, often used in financial contexts to indicate decreases in stocks, interest rates, or other economic indicators. Decrease indicators illustrations Three downward arrows symbolizing a decrease in percentage values or financial decline. The image displays three bold red arrows pointing downward, each containing a percentage symbol. This visual metaphor typically represents a decline, reduction, or drop in percentage-based metrics, often used in financial contexts to indicate decreases in stocks, interest rates, or other economic indicators
Free with trial This compelling financial chart vividly illustrates a concerning downward trend in the stock market. The blue grid provides a backdrop for the crucial data visualization, highlighting the negative movement indicated by a prominent red downward arrow. This visual representation underscores the potential for a market crash, prompting investors to carefully analyze market indicators and adjust. Decrease indicators illustrations Analyzing a Declining Stock Market Trend Blue Grid Financial Chart Signals a Potential Market Crash. This compelling financial chart vividly illustrates a concerning downward trend in the stock market. The blue grid provides a backdrop for the crucial data visualization, highlighting the negative movement indicated by a prominent red downward arrow. This visual representation underscores the potential for a market crash, prompting investors to carefully analyze market indicators and adjust
Free with trial This image symbolizes deflation, which is a decrease in the general price level of goods and services in an economy. The deflating balloon represents the shrinking purchasing power and overall , refined elegance. Decrease indicators illustrations Economic Downturn. Deflation concept. This image symbolizes deflation, which is a decrease in the general price level of goods and services in an economy. The deflating balloon represents the shrinking purchasing power and overall , refined elegance
Free with trial A visual representation of deflation, showing a decrease in the general pricing and economic activity , high resolution. Decrease indicators illustrations Economic Downturn. Deflation concept. A visual representation of deflation, showing a decrease in the general pricing and economic activity , high resolution
Free with trial Illustration economic crisis concept. Red digital indicators overlay a destroyed city. Financial markets collapse, economy crashes. Represents financial loss, bankruptcy global economic. Decrease indicators illustrations Illustration economic crisis concept. Red digital indicators overlay a destroyed city. Financial markets collapse, economy
Free with trial This infographic showcases a variety of graphs and charts, including bar graphs, line graphs, and pie charts, in a range of colors such as blue, green, and red. The image represents business data analysis, with arrows indicating growth, increase, and decrease trends. The infographic is a visual representation of market research, economy indicators, and metrics, making it a useful tool for business strategy and planning. Decrease indicators vectors A colorful infographic featuring various graphs and charts to represent business data analysis. This infographic showcases a variety of graphs and charts, including bar graphs, line graphs, and pie charts, in a range of colors such as blue, green, and red. The image represents business data analysis, with arrows indicating growth, increase, and decrease trends. The infographic is a visual representation of market research, economy indicators, and metrics, making it a useful tool for business strategy and planning.
Free with trial A striking red downward arrow is prominently placed on a chart highlighting a notable decrease in financial metrics over time suggesting a troubling trend in market analysis. Decrease indicators illustrations A striking red downward arrow is prominently placed on a chart highlighting a notable decrease in financial metrics over time
Free with trial Oil industry performance represented with weather icons above graph and barrels below, in a simple, clean and modern graphic style. Decrease indicators vectors Infographic Showing Oil Industry Performance with Weather Elements and Economic Indicators. Oil industry performance represented with weather icons above graph and barrels below, in a simple, clean and modern graphic style.
Free with trial This is an detailed set of line icons showing asset management techniques, cryptocurrency market trends, and professional trading chart indicators. Decrease indicators vectors Asset management and cryptocurrency trading icons featuring candlestick charts and trend indicators. This is an detailed set of line icons showing asset management techniques, cryptocurrency market trends, and professional trading chart indicators
Free with trial The image showcases a dynamic circular arrangement of percentage symbols in varying sizes and colors. Each symbol includes a positive or negative indicator, emphasizing the duality of increases and decreases. The design is visually striking, with black and red colors dominating the composition, and it appears to be used for illustrating financial metrics, statistical data, or performance. Decrease indicators illustrations Creative illustration of percentage signs in a circular arrangement with positive and negative indicators. The image showcases a dynamic circular arrangement of percentage symbols in varying sizes and colors. Each symbol includes a positive or negative indicator, emphasizing the duality of increases and decreases. The design is visually striking, with black and red colors dominating the composition, and it appears to be used for illustrating financial metrics, statistical data, or performance
Free with trial Three blue arrows pointing down, one blue plus sign, abstract elements, directional indicators, digital symbols, plus minus, concept. Decrease indicators vectors Three blue arrows pointing down and one blue plus sign, directional indicators, abstract elements, digital symbols, plus and minus. Three blue arrows pointing down, one blue plus sign, abstract elements, directional indicators, digital symbols, plus minus, concept
Free with trial The image portrays a downward graph representing deflation, symbolizing a period of economic decline and reduced consumer spending , timeless background beauty. Decrease indicators illustrations Economic Downturn. Deflation is a decrease in the general price level in an economy. The image portrays a downward graph representing deflation, symbolizing a period of economic decline and reduced consumer spending , timeless background beauty
Free with trial The image illustrates the concept of deflation, showing a downward trend in the overall price level of goods and services in the economy , vintage charm. Decrease indicators illustrations Economic downturn. Deflation is a decrease in the general price level in an economy. The image illustrates the concept of deflation, showing a downward trend in the overall price level of goods and services in the economy , vintage charm
Free with trial Minus 5 percent decrease red arrow. Plus 10 percent increase green arrow. Economic indicators. Financial statistics. Business performance. Market fluctuations shown. Decrease indicators illustrations Red down arrow with minus 5 percent and green up arrow with plus 10 percent on white background. Minus 5 percent decrease red arrow. Plus 10 percent increase green arrow. Economic indicators. Financial statistics. Business performance. Market fluctuations shown
Free with trial Red stock market chart crashing with downward arrow indicators on digital background, financial loss and economic recession concept. Generative AI. Decrease indicators illustrations Red stock market chart crashing with downward arrow indicators on digital background financial loss and economic recession. Red stock market chart crashing with downward arrow indicators on digital background, financial loss and economic recession concept. Generative AI
Free with trial Visualizing the current economic downturn through a stark, red background flat lay, this image showcases a downward trend represented by wooden blocks. The falling blocks symbolize the decline in key market indicators and highlight the instability and uncertainty impacting global economies. This analytical approach provides insights into the factors driving market crashes and recessions, offering. Decrease indicators illustrations Analyzing Economic Downturn Impacts Market Crash Predictions Investment Strategies Revealed Through Declining Wooden. Visualizing the current economic downturn through a stark, red background flat lay, this image showcases a downward trend represented by wooden blocks. The falling blocks symbolize the decline in key market indicators and highlight the instability and uncertainty impacting global economies. This analytical approach provides insights into the factors driving market crashes and recessions, offering
Free with trial A vibrant line graph visually representing fluctuating data trends over time, highlighting growth with colorful markers in green, yellow, and orange for better insights. Decrease indicators illustrations Colorful Line Graph Showing Data Trends with Green, Yellow, and Orange Indicators Representing Growth and Fluctuations Across. A vibrant line graph visually representing fluctuating data trends over time, highlighting growth with colorful markers in green, yellow, and orange for better insights
Free with trial Curved red down arrow and green up arrow icons for visualizing growth, decline, trends, performance metrics, charts, and financial data. Decrease indicators vectors Curved red down and green up arrows for growth and decline indicators. Curved red down arrow and green up arrow icons for visualizing growth, decline, trends, performance metrics, charts, and financial data
Free with trial This graphic illustrates stable bank withdrawals alongside a rising financial trend with coins and bars, Bank withdrawals are currently stable and not showing any significant increase or decrease. Decrease indicators vectors This graphic illustrates stable bank withdrawals alongside a rising financial trend with coins and bars, Bank withdrawals are
Free with trial This image depicts a downward trending arrow formed by a series of red dots against a bright blue sky with fluffy white clouds. The trajectory is clearly negative, visually representing a decline or decrease. This graphic was generated by AI, offering a simple yet effective visual representation of. Decrease indicators illustrations AI Generated Downward Trend. This image depicts a downward trending arrow formed by a series of red dots against a bright blue sky with fluffy white clouds. The trajectory is clearly negative, visually representing a decline or decrease. This graphic was generated by AI, offering a simple yet effective visual representation of
Free with trial A single image file depicting two side-by-side illustrations showing a person reviewing tax information on a laptop. The left illustration visualizes a negative tax analysis scenario with a downward trending graph and red indicators. The right illustration contrasts this with a positive tax analysis scenario, showing an upward trending graph, dollar sign, coins and green indicators, illustrating both potential tax decreases and benefits. Decrease indicators vectors Contrasting Tax Analysis Scenarios on Laptop. A single image file depicting two side-by-side illustrations showing a person reviewing tax information on a laptop. The left illustration visualizes a negative tax analysis scenario with a downward trending graph and red indicators. The right illustration contrasts this with a positive tax analysis scenario, showing an upward trending graph, dollar sign, coins and green indicators, illustrating both potential tax decreases and benefits
Free with trial This image portrays the concept of analyzing stock market trends through the use of candlestick charts. The red candlestick represents a bearish trend, indicating a decrease in stock prices. The various lines and shapes on the chart represent patterns and indicators used by traders to predict future market movements. This image conveys the importance of careful analysis and strategic decision-making in the stock market. The flickering flame of the candlestick adds a sense of urgency and volatility to the overall message. Overall, this image is perfect for presentations or articles related to finance, trading, and investment. Decrease indicators illustrations Red Candlestick Analysis: Stock Market Trading Charts. This image portrays the concept of analyzing stock market trends through the use of candlestick charts. The red candlestick represents a bearish trend, indicating a decrease in stock prices. The various lines and shapes on the chart represent patterns and indicators used by traders to predict future market movements. This image conveys the importance of careful analysis and strategic decision-making in the stock market. The flickering flame of the candlestick adds a sense of urgency and volatility to the overall message. Overall, this image is perfect for presentations or articles related to finance, trading, and investment.
Free with trial A businessman in a suit uses a laptop and a stylus to interact with a futuristic holographic display showing business analytics icons. The display includes a graph, handshake, target, gears, and indicators for quality and cost with upward and downward arrows. Charts and graphs are visible on the desk. Decrease indicators illustrations Business analytics with quality and cost indicators. A businessman in a suit uses a laptop and a stylus to interact with a futuristic holographic display showing business analytics icons. The display includes a graph, handshake, target, gears, and indicators for quality and cost with upward and downward arrows. Charts and graphs are visible on the desk
Free with trial Stock market graph displaying downward trend with red indicators. Generative AI. Decrease indicators illustrations Stock market graph displaying downward trend with red indicators
Free with trial A close-up shot of a laptop screen displaying a business analytics dashboard. The screen showcases various charts and graphs, including bar graphs, line graphs, and pie charts, illustrating data related to revenue, sales performance, customer growth, and market share. The data visualizations are presented in a clean, modern design with a dark background, highlighting the key performance indicators (KPIs) and trends. This image is suitable for illustrating concepts of data analysis, business intelligence, financial reporting, and technology. Decrease indicators illustrations Business Analytics Dashboard on Laptop Screen. A close-up shot of a laptop screen displaying a business analytics dashboard. The screen showcases various charts and graphs, including bar graphs, line graphs, and pie charts, illustrating data related to revenue, sales performance, customer growth, and market share. The data visualizations are presented in a clean, modern design with a dark background, highlighting the key performance indicators (KPIs) and trends. This image is suitable for illustrating concepts of data analysis, business intelligence, financial reporting, and technology.
Free with trial A visual representation of data showing a decline over a period. The blue bars are arranged in descending order of height, each marked with numerical indicators, suggesting a decrease in value or quantity. Decrease indicators illustrations Blue bar chart showing decreasing trend over time with numerical labels. A visual representation of data showing a decline over a period. The blue bars are arranged in descending order of height, each marked with numerical indicators, suggesting a decrease in value or quantity
Free with trial View falling Trends in Market And Economic Downturn, Chart Analysis, Indicators , layered depth. Decrease indicators illustrations View falling Trends in Market And Economic Downturn, Chart Analysis, Indicators
Free with trial A neon pink stock market chart with a downward trend and candlestick indicators against a dark blue background, symbolizing financial loss and economic downturn. Decrease indicators illustrations Neon Pink Stock Market Crash Chart with Candlesticks on Dark Blue Background. A neon pink stock market chart with a downward trend and candlestick indicators against a dark blue background, symbolizing financial loss and economic downturn
Free with trial PMI Purchasing Managers' Index - economic indicators derived from monthly surveys of private sector companies, acronym text concept background. Decrease indicators illustrations PMI Purchasing Managers\' Index - economic indicators derived from monthly surveys of private sector companies, acronym text
Free with trial Three stacks of gold coins decrease in height from left to right, with a red arrow pointing downwards across them. Isolated on a transparent background. Decrease indicators vectors Stacks of gold coins with red downward trend arrow isolated on a transparent background money. Three stacks of gold coins decrease in height from left to right, with a red arrow pointing downwards across them. Isolated on a transparent background
Free with trial A close-up, angled view of a digital stock market ticker board. The screen displays rows of numbers in vibrant red and green LED lights against a dark background. Red numbers typically indicate a price decrease or negative performance, while green signifies an increase or positive performance. The display shows various financial data, including stock prices, trading volumes, and potentially chart lines, creating a dynamic and abstract representation of financial markets and trading. Decrease indicators illustrations Stock Market Ticker Display with Red and Green Numbers. A close-up, angled view of a digital stock market ticker board. The screen displays rows of numbers in vibrant red and green LED lights against a dark background. Red numbers typically indicate a price decrease or negative performance, while green signifies an increase or positive performance. The display shows various financial data, including stock prices, trading volumes, and potentially chart lines, creating a dynamic and abstract representation of financial markets and trading.
Free with trial Dramatic Financial Illustration Showcasing Stock Market Fluctuations and Crisis Indicators on Screen, Generated by AI. Decrease indicators illustrations Dramatic Financial Illustration Showcasing Stock Market Fluctuations and Crisis Indicators on Screen
Free with trial This dynamic 3D visualization showcases a dramatic downward trend, depicted by numerous red arrows pointing downwards. The graphic effectively illustrates a decline in various economic indicators, such as stock market performance, negative growth, and business loss. The intense red color strongly emphasizes the negative impact, suggesting a potential stock market crash, a significant economic. Decrease indicators illustrations 3D Rendered Red Arrow Graph Visualizing a Downward Trend in Financial Markets and Business Performance. This dynamic 3D visualization showcases a dramatic downward trend, depicted by numerous red arrows pointing downwards. The graphic effectively illustrates a decline in various economic indicators, such as stock market performance, negative growth, and business loss. The intense red color strongly emphasizes the negative impact, suggesting a potential stock market crash, a significant economic
Free with trial This comprehensive analysis explores the current downturn in the housing market, examining the factors driving falling house prices. We delve into the interconnectedness of real estate trends with broader economic indicators, including interest rates, inflation, and potential recessionary periods. The report visually depicts the negative trajectory of property values, highlighting the. Decrease indicators illustrations Falling House Prices Analyzing Market Trends Impacts and Economic Forecasts for the Real Estate Sector. This comprehensive analysis explores the current downturn in the housing market, examining the factors driving falling house prices. We delve into the interconnectedness of real estate trends with broader economic indicators, including interest rates, inflation, and potential recessionary periods. The report visually depicts the negative trajectory of property values, highlighting the
Free with trial Pixel Art Arrow Icon Set. Directional Navigation And Trend Indicators In Pixelated Style. Upward, Downward, And Curved Arrows For Movement And Progress Representation. Isolated Vector Illustration. Decrease indicators vectors Pixel Art Arrow Icon Set. Directional Navigation And Trend Indicators In Pixelated Style. Upward, Downward, And Curved
Free with trial The graphic illustrates stable bank withdrawals alongside a growing financial trend with upward movement, Bank withdrawals are currently stable and not showing any significant increase or decrease. Decrease indicators vectors The graphic illustrates stable bank withdrawals alongside a growing financial trend with upward movement, Bank withdrawals are
Free with trial Witness the dynamic energy of the modern financial world in this captivating image. A digital display showcases a thriving stock market, complete with upward trends in financial charts and a stack of coins symbolizing wealth accumulation. The computer screen, the central focus, displays a complex array of financial graphs, highlighting market fluctuations and growth indicators. This visual. Decrease indicators illustrations Stock Market Growth A Thriving Investment Landscape Visualized on a Computer Screen with Stacked Coins Charts and. Witness the dynamic energy of the modern financial world in this captivating image. A digital display showcases a thriving stock market, complete with upward trends in financial charts and a stack of coins symbolizing wealth accumulation. The computer screen, the central focus, displays a complex array of financial graphs, highlighting market fluctuations and growth indicators. This visual
Free with trial This vibrant bar chart infographic is a powerful tool for communicating complex data in a clear and engaging way. Ideal for business presentations, reports, and marketing materials, this visually appealing design highlights key performance indicators and trends. The clean, modern aesthetic ensures your message stands out, while the colorful bars and clear labels make understanding the statistics. Decrease indicators illustrations Colorful Bar Chart Infographic Diagram A Modern Effective Data Visualization Template for Business Presentations. This vibrant bar chart infographic is a powerful tool for communicating complex data in a clear and engaging way. Ideal for business presentations, reports, and marketing materials, this visually appealing design highlights key performance indicators and trends. The clean, modern aesthetic ensures your message stands out, while the colorful bars and clear labels make understanding the statistics
Free with trial This breathtaking panoramic image showcases a dynamic financial graph rendered in a striking shade of blue. The prominent percentage sign overlaid on the visual data adds a powerful emphasis on key market indicators. The horizontal panoramic format allows for a comprehensive overview of the data, revealing significant trends and patterns within the investment landscape. From potential stock. Decrease indicators illustrations Panoramic Blue Financial Graph with Percentage Symbol A Visual Representation of Market Trends and Investment Data. This breathtaking panoramic image showcases a dynamic financial graph rendered in a striking shade of blue. The prominent percentage sign overlaid on the visual data adds a powerful emphasis on key market indicators. The horizontal panoramic format allows for a comprehensive overview of the data, revealing significant trends and patterns within the investment landscape. From potential stock
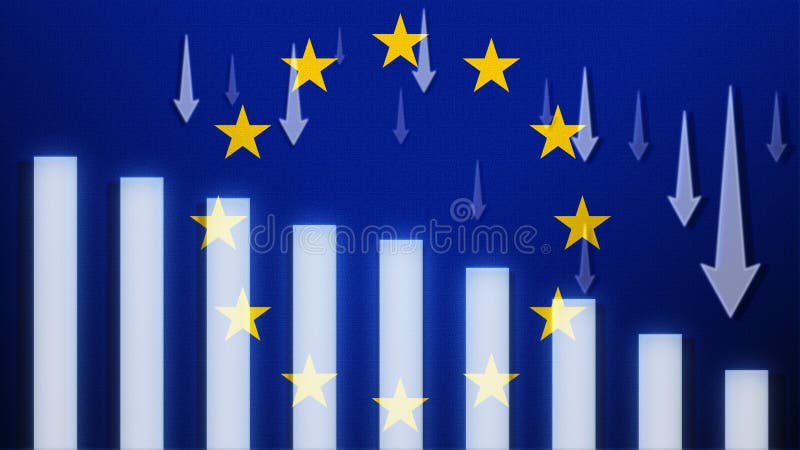
Free with trial EU flag with a declining bar chart and down arrows, symbolizing decline in data, performance, or various indicators. Decrease indicators illustrations Flag with a declining bar chart and down arrows, symbolizing decline in data, performance, or various indicators in the country. EU flag with a declining bar chart and down arrows, symbolizing decline in data, performance, or various indicators
Free with trial Generative AI : Economic crisis concept shown by declining graphs and digital indicators overlap modernistic city background. Double exposure. business concept. Decrease indicators illustrations Generative AI Economic crisis concept shown by declining graphs and digital indicators overlap modernistic city ba. Generative AI : Economic crisis concept shown by declining graphs and digital indicators overlap modernistic city background. Double exposure. business concept.
Free with trial Generative AI : Economic crisis concept shown by declining graphs and digital indicators overlap modernistic city background. Double exposure. business concept. Decrease indicators illustrations Generative AI Economic crisis concept shown by declining graphs and digital indicators overlap modernistic city ba. Generative AI : Economic crisis concept shown by declining graphs and digital indicators overlap modernistic city background. Double exposure. business concept.
Free with trial Flag with a declining bar chart and down arrows, symbolizing decline in data, performance, or various national indicators in the. Decrease indicators illustrations Flag with a declining bar chart and down arrows, symbolizing decline in data, performance, or various national indicators in the
Free with trial Gambia flag with a declining bar chart and down arrows, symbolizing decline in data, performance, or various national indicators. Decrease indicators illustrations Flag with a declining bar chart and down arrows, symbolizing decline in data, performance, or various national indicators in the
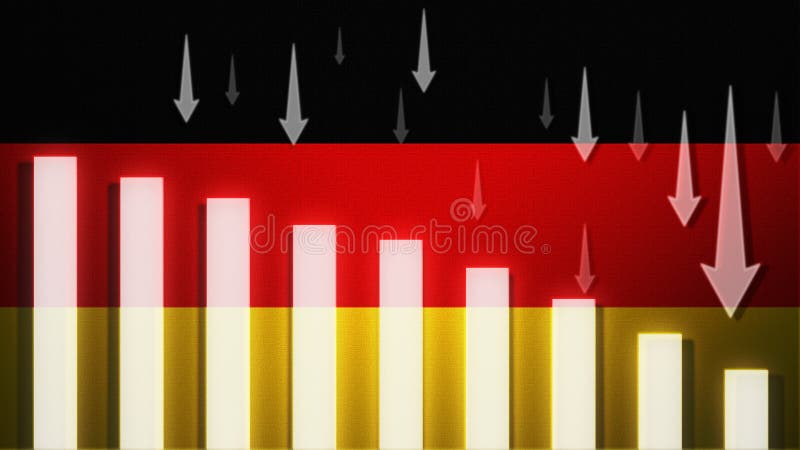
Free with trial Germany flag with a declining bar chart and down arrows, symbolizing decline in data, performance, or various national indicators. Decrease indicators illustrations Flag with a declining bar chart and down arrows, symbolizing decline in data, performance, or various national indicators in the
Free with trial Azerbaijan flag with a declining bar chart and down arrows, symbolizing decline in data, performance, or various national indicators. Decrease indicators illustrations Flag with a declining bar chart and down arrows, symbolizing decline in data, performance, or various national indicators in the
Free with trial Burkina Faso flag with a declining bar chart and down arrows, symbolizing decline in data, performance, or various national indicators. Decrease indicators illustrations Flag with a declining bar chart and down arrows, symbolizing decline in data, performance, or various national indicators in the
Free with trial Bangladesh flag with a declining bar chart and down arrows, symbolizing decline in data, performance, or various national indicators. Decrease indicators illustrations Flag with a declining bar chart and down arrows, symbolizing decline in data, performance, or various national indicators in the
Free with trial Cameroon flag with a declining bar chart and down arrows, symbolizing decline in data, performance, or various national indicators. Decrease indicators illustrations Flag with a declining bar chart and down arrows, symbolizing decline in data, performance, or various national indicators in the
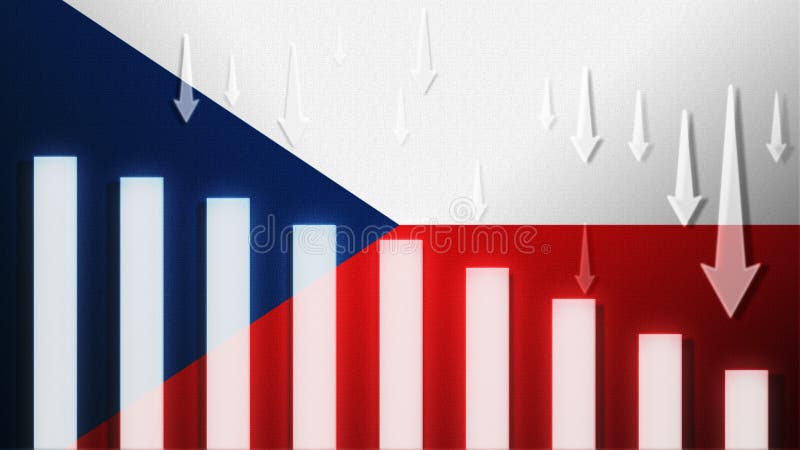
Free with trial Czech Republic flag with a declining bar chart and down arrows, symbolizing decline in data, performance, or various national indicators. Decrease indicators illustrations Flag with a declining bar chart and down arrows, symbolizing decline in data, performance, or various national indicators in the. Czech Republic flag with a declining bar chart and down arrows, symbolizing decline in data, performance, or various national indicators
Free with trial Botswana flag with a declining bar chart and down arrows, symbolizing decline in data, performance, or various national indicators. Decrease indicators illustrations Flag with a declining bar chart and down arrows, symbolizing decline in data, performance, or various national indicators in the
Free with trial Finland flag with a declining bar chart and down arrows, symbolizing decline in data, performance, or various national indicators. Decrease indicators illustrations Flag with a declining bar chart and down arrows, symbolizing decline in data, performance, or various national indicators in the
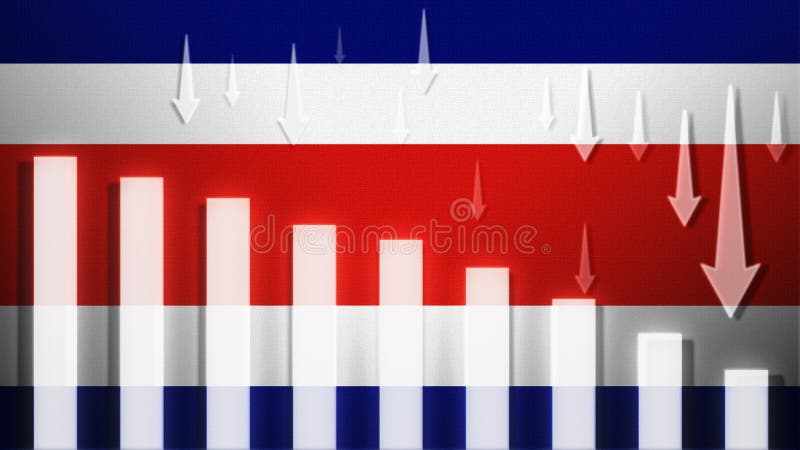
Free with trial Costa Rica flag with a declining bar chart and down arrows, symbolizing decline in data, performance, or various national indicators. Decrease indicators illustrations Flag with a declining bar chart and down arrows, symbolizing decline in data, performance, or various national indicators in the
Free with trial Cyprus flag with a declining bar chart and down arrows, symbolizing decline in data, performance, or various national indicators. Decrease indicators illustrations Flag with a declining bar chart and down arrows, symbolizing decline in data, performance, or various national indicators in the
Free with trial Flag with a declining bar chart and down arrows, symbolizing decline in data, performance, or various national indicators in the. Decrease indicators illustrations Flag with a declining bar chart and down arrows, symbolizing decline in data, performance, or various national indicators in the
Free with trial Flag with a declining bar chart and down arrows, symbolizing decline in data, performance, or various national indicators in the. Decrease indicators illustrations Flag with a declining bar chart and down arrows, symbolizing decline in data, performance, or various national indicators in the
Free with trial Bahamas flag with a declining bar chart and down arrows, symbolizing decline in data, performance, or various national indicators. Decrease indicators illustrations Flag with a declining bar chart and down arrows, symbolizing decline in data, performance, or various national indicators in the
Free with trial Belgium flag with a declining bar chart and down arrows, symbolizing decline in data, performance, or various national indicators. Decrease indicators illustrations Flag with a declining bar chart and down arrows, symbolizing decline in data, performance, or various national indicators in the
Free with trial Denmark flag with a declining bar chart and down arrows, symbolizing decline in data, performance, or various national indicators. Decrease indicators illustrations Flag with a declining bar chart and down arrows, symbolizing decline in data, performance, or various national indicators in the
Free with trial Bulgaria flag with a declining bar chart and down arrows, symbolizing decline in data, performance, or various national indicators. Decrease indicators illustrations Flag with a declining bar chart and down arrows, symbolizing decline in data, performance, or various national indicators in the
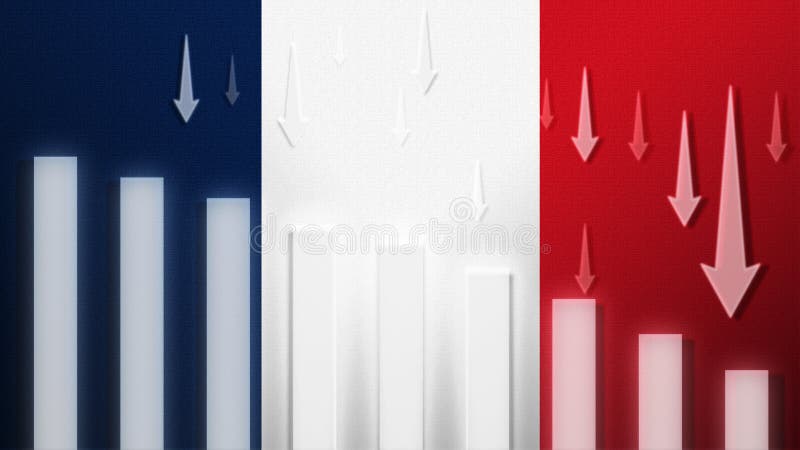
Free with trial France flag with a declining bar chart and down arrows, symbolizing decline in data, performance, or various national indicators. Decrease indicators illustrations Flag with a declining bar chart and down arrows, symbolizing decline in data, performance, or various national indicators in the
Free with trial Canada flag with a declining bar chart and down arrows, symbolizing decline in data, performance, or various national indicators. Decrease indicators illustrations Flag with a declining bar chart and down arrows, symbolizing decline in data, performance, or various national indicators in the
Free with trial Colombia flag with a declining bar chart and down arrows, symbolizing decline in data, performance, or various national indicators. Decrease indicators illustrations Flag with a declining bar chart and down arrows, symbolizing decline in data, performance, or various national indicators in the
Free with trial Algeria flag with a declining bar chart and down arrows, symbolizing decline in data, performance, or various national indicators. Decrease indicators illustrations Flag with a declining bar chart and down arrows, symbolizing decline in data, performance, or various national indicators in the
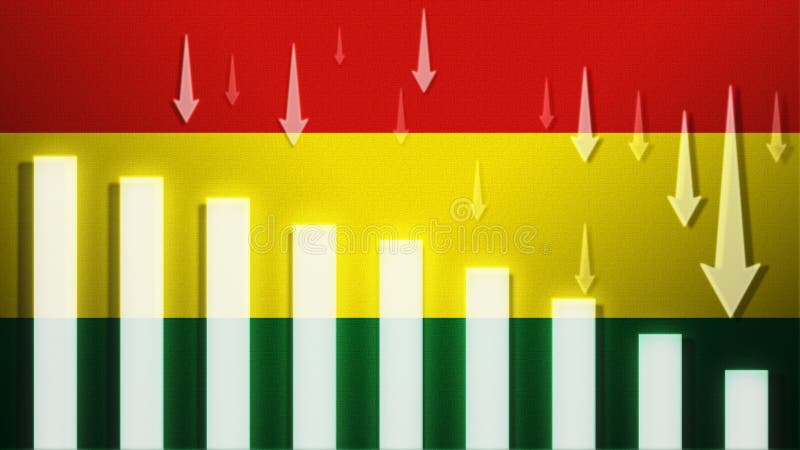
Free with trial Bolivia flag with a declining bar chart and down arrows, symbolizing decline in data, performance, or various national indicators. Decrease indicators illustrations Flag with a declining bar chart and down arrows, symbolizing decline in data, performance, or various national indicators in the
Free with trial Bahrain flag with a declining bar chart and down arrows, symbolizing decline in data, performance, or various national indicators. Decrease indicators illustrations Flag with a declining bar chart and down arrows, symbolizing decline in data, performance, or various national indicators in the