Free with trial Graph line icon. Continuous line with share plane. Column chart sign. Growth diagram symbol. 3d heart in speech bubble. Graph chart single line ribbon. Loop curve pattern. Vector. Decrease line graph illustrations Graph line icon. Column chart sign. Continuous line with plane. Vector. Graph line icon. Continuous line with share plane. Column chart sign. Growth diagram symbol. 3d heart in speech bubble. Graph chart single line ribbon. Loop curve pattern. Vector
Free with trial Set line Casino chip with dollar, Financial growth decrease, increase and Lottery ticket. Glowing neon icon. Vector. Decrease line graph vectors Set line Casino chip with dollar, Financial growth decrease, increase and Lottery ticket. Glowing neon icon. Vector
Free with trial Set line Project team base, Financial growth decrease, Pyramid chart infographics and Delivery tracking icon. Vector. Decrease line graph illustrations Set line Project team base, Financial growth decrease, Pyramid chart infographics and Delivery tracking icon. Vector
Free with trial A collection of icons Decrease, Intersection graph, decrease, Intersect graph, Connection network, Hierarchy structure, icon. Decrease line graph vectors Decrease, Intersection graph, decrease, Intersect graph, Connection network, Hierarchy structure, icon
Free with trial Graph line icon. Halftone dotted pattern. Gradient icon with grain shadow. Column chart sign. Growth diagram symbol. Line graph chart icon. Various designs. Vector. Decrease line graph vectors Graph line icon. Column chart sign. Halftone dotted pattern. Vector. Graph line icon. Halftone dotted pattern. Gradient icon with grain shadow. Column chart sign. Growth diagram symbol. Line graph chart icon. Various designs. Vector
Free with trial Financial Capability Month Financial chart with 3d bar graph and line plot illustrating market trends. Decrease line graph illustrations Financial Capability Month Financial chart with 3d bar graph and line plot illustrating market trends
Free with trial Set line Global economic crisis, Dollar rate decrease, Safe and Broken piggy bank icon. Vector. Decrease line graph illustrations Set line Global economic crisis, Dollar rate decrease, Safe and Broken piggy bank icon. Vector
Free with trial Orange Pencil on Paper with Fluctuating Line Graph Representing Business Trends and Analysis, Generated by AI. Decrease line graph illustrations Orange Pencil on Paper with Fluctuating Line Graph Representing Business Trends and Analysis
Free with trial Business chart icon set with graph, statistic, line and bar diagram for finance or analysis. Pie graphics with horizontal and donut layout for data growth. Vector report for trend or economy by pictogram scheme. Decrease line graph vectors Business chart icon set with graph, statistic, line and bar diagram for finance or analysis. Pie graphics with
Free with trial Web report line icon. Continuous one line with curl. Column graph sign. Growth diagram symbol. Web report single outline ribbon. Loop curve pattern. Vector. Decrease line graph vectors Web report line icon. Column graph sign. Continuous line with curl. Vector. Web report line icon. Continuous one line with curl. Column graph sign. Growth diagram symbol. Web report single outline ribbon. Loop curve pattern. Vector
Free with trial Web report line icon. Continuous one line with curl. Column graph sign. Growth diagram symbol. Web report single outline ribbon. Loop curve pattern. Vector. Decrease line graph illustrations Web report line icon. Column graph sign. Continuous line with curl. Vector. Web report line icon. Continuous one line with curl. Column graph sign. Growth diagram symbol. Web report single outline ribbon. Loop curve pattern. Vector
Free with trial Set line Contract money and pen, Global economic crisis news, and Dollar rate decrease icon. Vector. Decrease line graph vectors Set line Contract money and pen, Global economic crisis news, and Dollar rate decrease icon. Vector
Free with trial Set line Contract money and pen, Dollar rate decrease, Global economic crisis and Money bomb dollar icon. Vector. Decrease line graph vectors Set line Contract money and pen, Dollar rate decrease, Global economic crisis and Money bomb dollar icon. Vector
Free with trial Set Isometric line Financial growth decrease, Coal mine trolley, and Data analysis icon. Vector. Decrease line graph vectors Set Isometric line Financial growth decrease, Coal mine trolley, and Data analysis icon. Vector
Free with trial Graph and diagram from boats with decrease. Finance and business concepts. 3D Illustration isolated. 3D rendering on blue background. Decrease line graph illustrations Graph and diagram from boats with decrease. Finance and business concepts. 3D Illustration isolated.
Free with trial A green line graph displays fluctuating data points across five days, presented isolated on a clean white background. Decrease line graph illustrations Green line graph showing fluctuating data trends over five days isolated on white background. A green line graph displays fluctuating data points across five days, presented isolated on a clean white background
Free with trial This compelling red zigzag line graph vividly illustrates a downward market trend, offering a concise yet insightful representation of declining stock prices. The dynamic zigzag pattern clearly highlights fluctuations and sharp drops in the data, making it an ideal tool for visualizing market analysis and economic indicators. The falling red line graph effectively communicates the negative. Decrease line graph illustrations Analyzing a Declining Market Trend Visualizing Falling Stock Prices with a Red Zigzag Line Graph. This compelling red zigzag line graph vividly illustrates a downward market trend, offering a concise yet insightful representation of declining stock prices. The dynamic zigzag pattern clearly highlights fluctuations and sharp drops in the data, making it an ideal tool for visualizing market analysis and economic indicators. The falling red line graph effectively communicates the negative
Free with trial Set line Data analysis Folder and lock Financial growth decrease and Pie chart infographic. Business infographic template. Vector. Decrease line graph vectors Set line Data analysis, Folder and lock, Financial growth decrease and Pie chart infographic. Business infographic. Set line Data analysis Folder and lock Financial growth decrease and Pie chart infographic. Business infographic template. Vector.
Free with trial This image shows a falling graph behind a diamond, representing the decrease in the value of precious stones. It's suitable for illustrating financial losses. Decrease line graph vectors Illustration of a falling graph behind a diamond, symbolizing a decrease in the value of precious stones. This image shows a falling graph behind a diamond, representing the decrease in the value of precious stones. It's suitable for illustrating financial losses
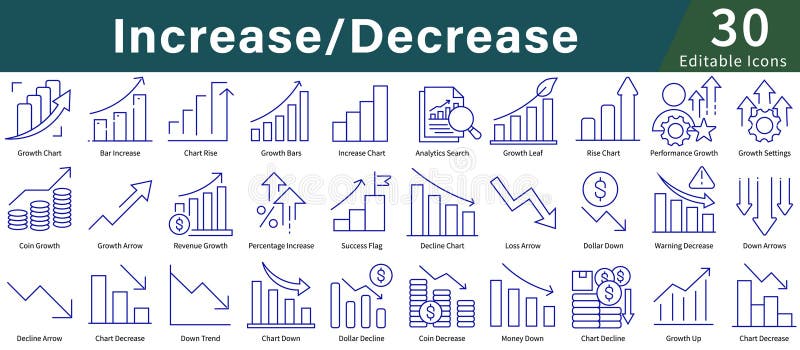
Free with trial Icons illustrating concepts of "Increase Decrease," using simple blue line art. Features include graphs and charts with upward and downward arrows, coins, dollar symbols, and percentage signs. Icons depict growth, decline, analytics, and performance tracking. Suitable for business, finance, or data analysis themes, these icons provide a visual representation of financial trends and statistics, making abstract concepts clear and easily understandable. The design is minimalistic and user-friendly, aimed at enhancing clarity in presentations and reports. Decrease line graph vectors Increase Decrease Icon Set in Line Style with Editable Vector for Growth, Analytics, Charts, and Data Visualization. Icons illustrating concepts of "Increase Decrease," using simple blue line art. Features include graphs and charts with upward and downward arrows, coins, dollar symbols, and percentage signs. Icons depict growth, decline, analytics, and performance tracking. Suitable for business, finance, or data analysis themes, these icons provide a visual representation of financial trends and statistics, making abstract concepts clear and easily understandable. The design is minimalistic and user-friendly, aimed at enhancing clarity in presentations and reports.
Free with trial Growth chart line icon. Halftone dotted pattern. Gradient icon with grain shadow. Column graph sign. Market analytics symbol. Line growth chart icon. Various designs. Vector. Decrease line graph vectors Growth chart line icon. Column graph sign. Halftone dotted pattern. Vector. Growth chart line icon. Halftone dotted pattern. Gradient icon with grain shadow. Column graph sign. Market analytics symbol. Line growth chart icon. Various designs. Vector
Free with trial The image is a digital illustration of a stock market chart. The chart is blue in color and has a line graph in the center. The line graph shows a downward trend, indicating a decrease in the stock market. On the top left corner of the chart, there is a white text that reads "10. 03570". The background of the image is made up of small white dots, which are scattered across the chart. Decrease line graph illustrations The image is a digital illustration of a stock market chart. The chart is blue in color and has a line graph in the center.
Free with trial Set line Search engine, SEO optimization, Financial growth decrease and Browser setting icon. Vector. Decrease line graph vectors Set line Search engine, SEO optimization, Financial growth decrease and Browser setting icon. Vector
Free with trial Diagram graph line icon. Halftone dotted pattern. Gradient icon with grain shadow. Column chart sign. Market analytics symbol. Line diagram graph icon. Various designs. Vector. Decrease line graph illustrations Diagram graph line icon. Column chart sign. Halftone dotted pattern. Vector. Diagram graph line icon. Halftone dotted pattern. Gradient icon with grain shadow. Column chart sign. Market analytics symbol. Line diagram graph icon. Various designs. Vector
Free with trial Diagram graph line icon. Halftone dotted pattern. Gradient icon with grain shadow. Column chart sign. Market analytics symbol. Line diagram graph icon. Various designs. Vector. Decrease line graph illustrations Diagram graph line icon. Column chart sign. Halftone dotted pattern. Vector. Diagram graph line icon. Halftone dotted pattern. Gradient icon with grain shadow. Column chart sign. Market analytics symbol. Line diagram graph icon. Various designs. Vector
Free with trial Diagram chart line icon. Halftone dotted pattern. Gradient icon with grain shadow. Column graph sign. Market analytics symbol. Line diagram chart icon. Various designs. Vector. Decrease line graph vectors Diagram chart line icon. Column graph sign. Halftone dotted pattern. Vector. Diagram chart line icon. Halftone dotted pattern. Gradient icon with grain shadow. Column graph sign. Market analytics symbol. Line diagram chart icon. Various designs. Vector
Free with trial Set line Tearing money banknote Dollar rate decrease Calculation of expenses Shutdown factory Money bomb dollar crisis Pie chart infographic Mobile stock trading and Global economic icon. Vector. Decrease line graph illustrations Set line Tearing money banknote, Dollar rate decrease, Calculation of expenses, Shutdown factory, Money bomb dollar. Set line Tearing money banknote Dollar rate decrease Calculation of expenses Shutdown factory Money bomb dollar crisis Pie chart infographic Mobile stock trading and Global economic icon. Vector.
Free with trial Set line Worker, Dollar rate decrease, Global economic crisis news and Shutdown of factory icon. Vector. Decrease line graph vectors Set line Worker, Dollar rate decrease, Global economic crisis news and Shutdown of factory icon. Vector
Free with trial Up and down dollar arrow outline icon on circle line. Increase and decrease USD sign symbol vector. Decrease line graph vectors Up and down dollar arrow outline icon on circle line. Increase and decrease USD sign symbol
Free with trial Declining bar graph illustrating business recession trend or financial downturn with line chart overlay. Decrease line graph vectors Declining bar graph illustrating business recession trend or financial downturn with line chart overlay
Free with trial Set line Financial growth decrease, Binary code and icon. Vector. Decrease line graph illustrations Set line Financial growth decrease, Binary code and icon. Vector
Free with trial Set line Laptop with browser window Browser Cloud technology data transfer Financial growth increase decrease Magnifying glass and delete Online shopping on screen and Server icon. Vector. Decrease line graph vectors Set line Laptop with browser window, Browser, Cloud technology data transfer, Financial growth increase, decrease. Set line Laptop with browser window Browser Cloud technology data transfer Financial growth increase decrease Magnifying glass and delete Online shopping on screen and Server icon. Vector.
Free with trial Charts and graphs, Presentation and Report. Graph line icons. Analytics linear icon set. Line icons set. Vector. Decrease line graph illustrations Graph line icons. Charts and graphs, Presentation and Report. Linear icon set. Line icons. Vector. Charts and graphs, Presentation and Report. Graph line icons. Analytics linear icon set. Line icons set. Vector
Free with trial Charts and graphs, Presentation and Report. Graph line icons. Analytics linear icon set. Line icons set. Vector. Decrease line graph illustrations Graph line icons. Charts and graphs, Presentation and Report. Linear icon set. Line icons. Vector. Charts and graphs, Presentation and Report. Graph line icons. Analytics linear icon set. Line icons set. Vector
Free with trial Bar Chart Decline Line And Solid Icon Set. Financial Loss, Economic Downturn, And Business Performance Decrease Symbol Collection. Data Analysis And Market Trends. Isolated Vector Illustration. Decrease line graph vectors Bar Chart Decline Line And Solid Icon Set. Financial Loss, Economic Downturn, And Business Performance Decrease Symbol
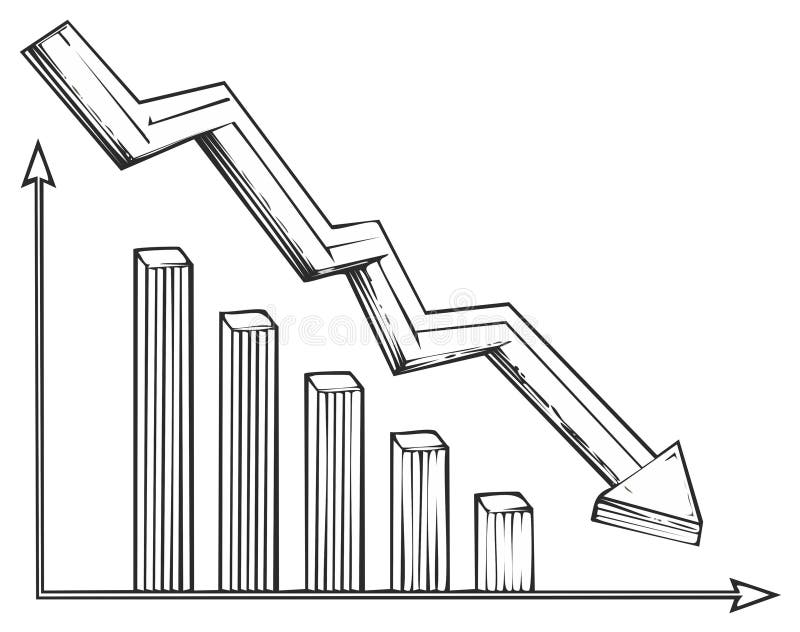
Free with trial Hand drawn falling graph line over declining bar chart representing economic recession and business loss. Decrease line graph vectors Hand drawn falling graph line over declining bar chart representing economic recession and business loss
Free with trial Set line Global economic crisis, Dollar rate decrease and Money bomb dollar. Business infographic template. Vector. Decrease line graph illustrations Set line Global economic crisis, Dollar rate decrease and Money bomb dollar. Business infographic template. Vector
Free with trial Set line Money bag, Dollar rate decrease and Drop in crude oil price. Business infographic template. Vector. Decrease line graph vectors Set line Money bag, Dollar rate decrease and Drop in crude oil price. Business infographic template. Vector
Free with trial Line Graph Chart Solid Icon. Data Analysis, Trend Visualization, And Statistical Representation Silhouette Symbol. Business And Financial Insights. Isolated Vector Illustration. Decrease line graph vectors Line Graph Chart Solid Icon. Data Analysis, Trend Visualization, And Statistical Representation Silhouette Symbol
Free with trial Column chart sign. Salaryman, gender equality and alert bell outline icons. Decreasing graph line icon. Crisis diagram symbol. Spy or profile placeholder icon. Vector. Decrease line graph vectors Decreasing graph line icon. Crisis chart sign. Salaryman, gender equality and alert bell. Vector. Column chart sign. Salaryman, gender equality and alert bell outline icons. Decreasing graph line icon. Crisis diagram symbol. Decreasing graph line sign. Spy or profile placeholder icon. Vector
Free with trial Column chart sign. Salaryman, gender equality and alert bell outline icons. Decreasing graph line icon. Crisis diagram symbol. Spy or profile placeholder icon. Vector. Decrease line graph illustrations Decreasing graph line icon. Crisis chart sign. Salaryman, gender equality and alert bell. Vector. Column chart sign. Salaryman, gender equality and alert bell outline icons. Decreasing graph line icon. Crisis diagram symbol. Decreasing graph line sign. Spy or profile placeholder icon. Vector
Free with trial Set line Target, Wrench and gear, Financial growth decrease and Pie chart infographic. Blue square button. Vector. Decrease line graph illustrations Set line Target, Wrench and gear, Financial growth decrease and Pie chart infographic. Blue square button. Vector
Free with trial Set line Financial growth, Pie chart infographic, decrease, Server, Data analysis, and icon. Vector. Decrease line graph vectors Set line Financial growth, Pie chart infographic, decrease, Server, Data analysis, and icon. Vector
Free with trial Set line Browser window Server Data Cloud upload Search engine Graph chart infographic and Financial growth decrease icon. Vector. Decrease line graph vectors Set line Browser window, Server, Data, Cloud upload, Search engine, Graph chart infographic and Financial growth. Set line Browser window Server Data Cloud upload Search engine Graph chart infographic and Financial growth decrease icon. Vector.
Free with trial Set line Laptop with browser window Browser Financial growth decrease and Website stocks market. Business infographic template. Vector. Decrease line graph illustrations Set line Laptop with browser window, Browser, Financial growth decrease and Website stocks market. Business infographic
Free with trial Set line Global economic crisis Drop in crude oil price Dollar rate decrease Money bag Burning dollar bill and Safe icon. Vector. Decrease line graph vectors Set line Global economic crisis, Drop in crude oil price, Dollar rate decrease, Money bag, Burning dollar bill and Safe
Free with trial White line Financial growth decrease icon isolated on white background. Increasing revenue. Red circle button. Vector. Decrease line graph vectors White line Financial growth decrease icon isolated on white background. Increasing revenue. Red circle button. Vector
Free with trial Set line Financial growth decrease, Stacks paper money cash, Pie chart infographic and Pos terminal icon. Vector. Decrease line graph illustrations Set line Financial growth decrease, Stacks paper money cash, Pie chart infographic and Pos terminal icon. Vector
Free with trial Set line Casino signboard Financial growth decrease and chip with dollar. Business infographic template. Vector. Decrease line graph vectors Set line Casino signboard, Financial growth decrease and chip with dollar. Business infographic template. Vector
Free with trial Trend to go down chart line and solid icon, world sanction concept. Vector graphics. Dollar currency graph, market pressure sign on white background, outline style icon for mobile or web design. Decrease line graph vectors Trend to go down chart line and solid icon, world sanction concept. Vector graphics. Dollar currency graph, market
Free with trial Set line Falling property prices Dollar rate decrease Tearing money banknote Storm Drop crude oil Mobile stock trading Briefcase and icon. Vector. Decrease line graph illustrations Set line Falling property prices, Dollar rate decrease, Tearing money banknote, Storm, Drop crude oil, Mobile stock. Set line Falling property prices Dollar rate decrease Tearing money banknote Storm Drop crude oil Mobile stock trading Briefcase and icon. Vector.
Free with trial Set line Dollar rate decrease Drop in crude oil price Mobile stock trading Briefcase Global economic crisis and Bank building icon. Vector. Decrease line graph vectors Set line Dollar rate decrease, Drop in crude oil price, Mobile stock trading, Briefcase, Global economic crisis, and. Set line Dollar rate decrease Drop in crude oil price Mobile stock trading Briefcase Global economic crisis and Bank building icon. Vector.
Free with trial Black line Financial growth decrease icon isolated on white background. Increasing revenue. Random dynamic shapes. Vector. Decrease line graph illustrations Black line Financial growth decrease icon isolated on white background. Increasing revenue. Random dynamic shapes
Free with trial White line Financial growth decrease icon isolated seamless pattern on red background. Increasing revenue. Vector. Decrease line graph vectors White line Financial growth decrease icon isolated seamless pattern on red background. Increasing revenue. Vector
Free with trial Set line Pie chart infographic Pyramid infographics Light bulb Financial growth decrease Unknown search Arrow and Target icon. Vector. Decrease line graph vectors Set line Pie chart infographic, Pyramid infographics, Light bulb, Financial growth decrease, Unknown search, Arrow, and. Set line Pie chart infographic Pyramid infographics Light bulb Financial growth decrease Unknown search Arrow and Target icon. Vector.
Free with trial Set line Employee dismissal Global economic crisis Pie chart infographic Dollar rate decrease Safe Briefcase and Drop crude oil price icon. Vector. Decrease line graph vectors Set line Employee dismissal, Global economic crisis, Pie chart infographic, Dollar rate decrease, Safe, Briefcase and. Set line Employee dismissal Global economic crisis Pie chart infographic Dollar rate decrease Safe Briefcase and Drop crude oil price icon. Vector.
Free with trial Set line Search data analysis Server Cloud download and upload Binary code Financial growth decrease Browser with exclamation mark Data and icon. Vector. Decrease line graph vectors Set line Search data analysis, Server, Cloud download and upload, Binary code, Financial growth decrease, Browser with. Set line Search data analysis Server Cloud download and upload Binary code Financial growth decrease Browser with exclamation mark Data and icon. Vector.
Free with trial Set line Data analysis Financial growth decrease Cloud and shield and Browser with stocks market. Business infographic template. Vector. Decrease line graph illustrations Set line Data analysis, Financial growth decrease, Cloud and shield and Browser with stocks market. Business infographic
Free with trial Black line Financial growth decrease icon isolated seamless pattern on green background. Increasing revenue. Vector. Decrease line graph illustrations Black line Financial growth decrease icon isolated seamless pattern on green background. Increasing revenue. Vector
Free with trial Glowing neon line Financial growth decrease icon isolated on black background. Increasing revenue. Colorful outline concept. Vector. Decrease line graph vectors Glowing neon line Financial growth decrease icon isolated on black background. Increasing revenue. Colorful outline
Free with trial Isometric line Financial growth decrease icon isolated on yellow background. Increasing revenue. Black circle button. Vector. Decrease line graph vectors Isometric line Financial growth decrease icon isolated on yellow background. Increasing revenue. Black circle button
Free with trial Set line Shutdown of factory Dollar rate decrease Debt ball chained coin Calculation expenses Mobile stock trading Worker and Global economic crisis news icon. Vector. Decrease line graph illustrations Set line Shutdown of factory, Dollar rate decrease, Debt ball chained coin, Calculation expenses, Mobile stock trading. Set line Shutdown of factory Dollar rate decrease Debt ball chained coin Calculation expenses Mobile stock trading Worker and Global economic crisis news icon. Vector.
Free with trial Set line Drop in crude oil price Global economic crisis Prison cell door Dollar rate decrease Mobile stock trading and icon. Vector. Decrease line graph illustrations Set line Drop in crude oil price, Global economic crisis, Prison cell door, Dollar rate decrease, Mobile stock trading. Set line Drop in crude oil price Global economic crisis Prison cell door Dollar rate decrease Mobile stock trading and icon. Vector.
Free with trial Set Isometric line Dollar rate decrease, Global economic crisis, Pie chart infographic and Drop crude oil price icon. Vector. Decrease line graph illustrations Set Isometric line Dollar rate decrease, Global economic crisis, Pie chart infographic and Drop crude oil price icon
Free with trial Economic critical crisis concept. The lower line graph and bar chart on red background. Recession financial, cryptocurrency, gold, and the stock market. Losing money and cash. Bearish. Decrease line graph vectors Economic critical crisis concept. The lower line graph and bar chart on red background. Recession financial, cryptocurrency, gold
Free with trial Column chart sign. Salaryman, gender equality and alert bell outline icons. Diagram graph line icon. Market analytics symbol. Spy or profile placeholder icon. Vector. Decrease line graph vectors Diagram graph line icon. Column chart sign. Salaryman, gender equality and alert bell. Vector. Column chart sign. Salaryman, gender equality and alert bell outline icons. Diagram graph line icon. Market analytics symbol. Diagram graph line sign. Spy or profile placeholder icon. Vector
Free with trial Set line Safe Drop in crude oil price Dollar rate decrease Money bag Mobile stock trading Pie chart infographic and icon. Vector. Decrease line graph vectors Set line Safe, Drop in crude oil price, Dollar rate decrease, Money bag, Mobile stock trading, Pie chart infographic and
Free with trial Set line Treasure chest Gold bars Chalkboard with diagram Stacks paper money cash ATM and Financial growth decrease and Price tag dollar icon. Vector. Decrease line graph vectors Set line Treasure chest, Gold bars, Chalkboard with diagram, Stacks paper money cash, ATM and, Financial growth decrease. Set line Treasure chest Gold bars Chalkboard with diagram Stacks paper money cash ATM and Financial growth decrease and Price tag dollar icon. Vector.
Free with trial Set line Financial growth decrease Data analysis Browser with stocks market Pie chart infographic Coal mine trolley and Cloud computing lock icon. Vector. Decrease line graph vectors Set line Financial growth decrease, Data analysis, Browser with stocks market, Pie chart infographic, Coal mine trolley. Set line Financial growth decrease Data analysis Browser with stocks market Pie chart infographic Coal mine trolley and Cloud computing lock icon. Vector.
Free with trial A financial report with bar graph and line chart is a visual tool for business data analysis, offering insights for presentation, review, and strategic decision-making. Decrease line graph vectors Vector art of financial report with bar graph and line chart, showing business data and analysis for presentation and review. A financial report with bar graph and line chart is a visual tool for business data analysis, offering insights for presentation, review, and strategic decision-making
Free with trial Glowing neon line Financial growth decrease icon isolated on blue background. Increasing revenue. Vector. Decrease line graph illustrations Glowing neon line Financial growth decrease icon isolated on blue background. Increasing revenue. Vector
Free with trial A close-up image of an american flag with a red line graph trending downward superimposed over it. the graph has a jagged line that starts from the top left and ends at the bottom right with an arrow pointing downwards. the flag is out of focus. Decrease line graph illustrations A red line graph trending downward on a usa flag background. A close-up image of an american flag with a red line graph trending downward superimposed over it. a close-up image of an american flag with a red line graph trending downward superimposed over it. the graph has a jagged line that starts from the top left and ends at the bottom right with an arrow pointing downwards. the flag is out of focus
Free with trial Set Isometric line Falling property prices, Dollar rate decrease, Global economic crisis and Debt ball chained to coin icon. Vector. Decrease line graph illustrations Set Isometric line Falling property prices, Dollar rate decrease, Global economic crisis and Debt ball chained to coin
Free with trial Set line Website with stocks market Financial growth decrease Browser window and Cloud technology data transfer icon. Vector. Decrease line graph illustrations Set line Website with stocks market, Financial growth decrease, Browser window and Cloud technology data transfer icon
Free with trial Set line Financial growth decrease Cloud computing lock and Pie chart infographic with long shadow. Red square button. Vector. Decrease line graph vectors Set line Financial growth, decrease, Cloud computing lock and Pie chart infographic with long shadow. Red square button
Free with trial Line Graph Chart Icon. Data Analysis, Business Growth, And Statistical Trends Outline Symbol. Financial Performance Tracking. Editable Stroke. Isolated Vector Illustration. Decrease line graph vectors Line Graph Chart Icon. Data Analysis, Business Growth, And Statistical Trends Outline Symbol. Financial Performance
Free with trial A striking depiction of a downward trend represented by a red graph line on a textured background, symbolizing market decline ,Generative AI. Decrease line graph illustrations A striking depiction of a downward trend represented by a red graph line on a textured background, symbolizing market decline
Free with trial Isometric line Financial growth decrease icon isolated on pink and green background. Increasing revenue. Silver square button. Vector. Decrease line graph vectors Isometric line Financial growth decrease icon isolated on pink and green background. Increasing revenue. Silver square
Free with trial White line Financial growth decrease icon isolated with long shadow background. Increasing revenue. Blue square button. Vector. Decrease line graph vectors White line Financial growth decrease icon isolated with long shadow background. Increasing revenue. Blue square button
Free with trial Set line Pie chart infographic, Graph, chart, diagram, Location, Hierarchy organogram, Arrow and icon. Vector. Decrease line graph vectors Set line Pie chart infographic, Graph, chart, diagram, Location, Hierarchy organogram, Arrow and icon. Vector