Free with trial Presentation board line icon. Neumorphic, Purple gradient, 3d pin buttons. Column graph sign. Growth diagram symbol. Line icons. Neumorphic buttons with outline signs. Vector. Decrease line graph illustrations Presentation board line icon. Column graph sign. Line icons. Vector. Presentation board line icon. Neumorphic, Purple gradient, 3d pin buttons. Column graph sign. Growth diagram symbol. Line icons. Neumorphic buttons with outline signs. Vector
Free with trial A stylized line graph icon with a purple gradient is displayed against a solid black background. The graph features four circular data points connected by angled lines, forming an upward trend. Decrease line graph illustrations Stylized line graph icon with purple gradient on black background chart data. A stylized line graph icon with a purple gradient is displayed against a solid black background. The graph features four circular data points connected by angled lines, forming an upward trend
Free with trial A vector icon illustrating a downward trending line graph, symbolizing a decline, decrease, or negative performance. Ideal for financial reports, data analysis dashboards, or warning indicators. This clear and concise graphic is scalable, perfect for conveying trend information in various digital interfaces, vector design Generative AI. Decrease line graph vectors Declining Trend Graph Icon - Downturn Analysis Symbol, vector design Generative AI. A vector icon illustrating a downward trending line graph, symbolizing a decline, decrease, or negative performance. Ideal for financial reports, data analysis dashboards, or warning indicators. This clear and concise graphic is scalable, perfect for conveying trend information in various digital interfaces, vector design Generative AI
Free with trial Presentation board line icon. Neumorphic, Purple gradient, 3d pin buttons. Column graph sign. Growth diagram symbol. Line icons. Neumorphic buttons with outline signs. Vector. Decrease line graph illustrations Presentation board line icon. Column graph sign. Line icons. Vector. Presentation board line icon. Neumorphic, Purple gradient, 3d pin buttons. Column graph sign. Growth diagram symbol. Line icons. Neumorphic buttons with outline signs. Vector
Free with trial Diagram chart line icon. Neumorphic, Orange gradient, 3d pin buttons. Presentation graph sign. Market analytics symbol. Line icons. Neumorphic buttons with outline signs. Vector. Decrease line graph vectors Diagram chart line icon. Presentation graph sign. Line icons. Vector. Diagram chart line icon. Neumorphic, Orange gradient, 3d pin buttons. Presentation graph sign. Market analytics symbol. Line icons. Neumorphic buttons with outline signs. Vector
Free with trial Diagram chart line icon. Neumorphic, Orange gradient, 3d pin buttons. Presentation graph sign. Market analytics symbol. Line icons. Neumorphic buttons with outline signs. Vector. Decrease line graph illustrations Diagram chart line icon. Presentation graph sign. Line icons. Vector. Diagram chart line icon. Neumorphic, Orange gradient, 3d pin buttons. Presentation graph sign. Market analytics symbol. Line icons. Neumorphic buttons with outline signs. Vector
Free with trial Bar graph with weather icons and rising line chart on grid backdrop. Ideal for analytics, statistics, weather data, trend analysis, business forecasting, seasonal planning. A simple flat metaphor. Decrease line graph illustrations Seasonal Data Trends Displayed on Bar Graph with Line Chart and Weather Icons. Bar graph with weather icons and rising line chart on grid backdrop. Ideal for analytics, statistics, weather data, trend analysis, business forecasting, seasonal planning. A simple flat metaphor
Free with trial Down Downward Trend Chart Drop Line Bar Trending Data Statistic Graph Market Share Stock Line Outline Black White Vector Icon Sign Symbol Graphic Artwork. Decrease line graph vectors Down Downward Trend Chart Drop Line Bar Trending Data Statistic Graph Market Share Stock Line Outline Black White Vector Icon
Free with trial Analytics graph line icon. Halftone dotted pattern. Gradient icon with grain shadow. Column chart sign. Growth diagram symbol. Line analytics graph icon. Various designs. Vector. Decrease line graph vectors Analytics graph line icon. Column chart sign. Halftone dotted pattern. Vector. Analytics graph line icon. Halftone dotted pattern. Gradient icon with grain shadow. Column chart sign. Growth diagram symbol. Line analytics graph icon. Various designs. Vector
Free with trial Dot plot graph line icon. Neumorphic, Blue gradient, 3d pin buttons. Presentation chart sign. Market analytics symbol. Line icons. Neumorphic buttons with outline signs. Vector. Decrease line graph vectors Dot plot graph line icon. Presentation chart sign. Line icons. Vector. Dot plot graph line icon. Neumorphic, Blue gradient, 3d pin buttons. Presentation chart sign. Market analytics symbol. Line icons. Neumorphic buttons with outline signs. Vector
Free with trial Dot plot graph line icon. Neumorphic, Flat shadow, 3d buttons. Presentation chart sign. Market analytics symbol. Line dot plot icon. Social media icons. Vector. Decrease line graph illustrations Dot plot graph line icon. Presentation chart sign. Neumorphic buttons. Vector. Dot plot graph line icon. Neumorphic, Flat shadow, 3d buttons. Presentation chart sign. Market analytics symbol. Line dot plot icon. Social media icons. Vector
Free with trial A 3D bar graph with a red line graph indicating a significant decrease, isolated on a clean white background. Decrease line graph illustrations Bar graph showing downward trend isolated on white background. A 3D bar graph with a red line graph indicating a significant decrease, isolated on a clean white background
Free with trial Diagram chart line icon. Halftone dotted pattern. Gradient icon with grain shadow. Analytics graph sign. Market analytics symbol. Line analytics chart icon. Various designs. Vector. Decrease line graph vectors Diagram chart line icon. Analytics graph sign. Halftone dotted pattern. Vector. Diagram chart line icon. Halftone dotted pattern. Gradient icon with grain shadow. Analytics graph sign. Market analytics symbol. Line analytics chart icon. Various designs. Vector
Free with trial Pyramid chart line icon. Continuous line with 3d star. Analytics graph sign. Market analytics symbol. 3d star in speech bubble. Pyramid chart single line ribbon. Loop curve pattern. Vector. Decrease line graph vectors Pyramid chart line icon. Analytics graph sign. Continuous line with 3d star. Vector. Pyramid chart line icon. Continuous line with 3d star. Analytics graph sign. Market analytics symbol. 3d star in speech bubble. Pyramid chart single line ribbon. Loop curve pattern. Vector
Free with trial Presentation board line icon. Continuous line with share plane. Column graph sign. Growth diagram symbol. 3d star in speech bubble. Presentation board single line ribbon. Loop curve pattern. Vector. Decrease line graph vectors Presentation board line icon. Column graph sign. Continuous line with plane. Vector. Presentation board line icon. Continuous line with share plane. Column graph sign. Growth diagram symbol. 3d star in speech bubble. Presentation board single line ribbon. Loop curve pattern. Vector
Free with trial A graph with a line that is slanted and has a lot of peaks and valleys. The graph is on a white background. Decrease line graph illustrations A graph with a line that is slanted and has a lot of peaks and valleys
Free with trial Red Line Graph Showing Growth and Fluctuation on White Grid Paper, generative Ai. Decrease line graph illustrations Red Line Graph Showing Growth and Fluctuation on White Grid Paper
Free with trial Report statistics line icon. Halftone dotted pattern. Gradient icon with grain shadow. Column graph sign. Growth diagram symbol. Line report statistics icon. Various designs. Vector. Decrease line graph vectors Report statistics line icon. Column graph sign. Halftone dotted pattern. Vector. Report statistics line icon. Halftone dotted pattern. Gradient icon with grain shadow. Column graph sign. Growth diagram symbol. Line report statistics icon. Various designs. Vector
Free with trial Line graph icons set simple clean and smooth line and fill vector icons in black on a white background. Decrease line graph vectors Line graph icons set simple clean and smooth line and fill vector icons in black
Free with trial Candlestick chart line icon. Continuous line with share plane. Analytics graph sign. Market analytics symbol. 3d heart in speech bubble. Candlestick chart single line ribbon. Vector. Decrease line graph vectors Candlestick chart line icon. Analytics graph sign. Continuous line with plane. Vector. Candlestick chart line icon. Continuous line with share plane. Analytics graph sign. Market analytics symbol. 3d heart in speech bubble. Candlestick chart single line ribbon. Vector
Free with trial Business chart is displaying market data analytics with a candlestick chart, pie chart and line graph. Decrease line graph vectors Business chart displaying market data analytics with candlestick chart, pie chart and line graph
Free with trial Up and down graph icon in line style. Outline bar chart with uptrend and downtrend arrow symbol vector. Decrease line graph vectors Up and down graph icon in line style. Outline bar chart with uptrend and downtrend arrow symbol
Free with trial Diagram chart line icon. Halftone dotted pattern. Gradient icon with grain shadow. Presentation graph sign. Market analytics symbol. Line diagram chart icon. Various designs. Vector. Decrease line graph vectors Diagram chart line icon. Presentation graph sign. Halftone dotted pattern. Vector. Diagram chart line icon. Halftone dotted pattern. Gradient icon with grain shadow. Presentation graph sign. Market analytics symbol. Line diagram chart icon. Various designs. Vector
Free with trial A red line graph against a stormy sky, representing financial crisis. Created with the help of Generative AI tools. Decrease line graph illustrations A red line graph against a stormy sky, representing financial crisis.
Free with trial Candlestick chart line icon. Halftone dotted pattern. Gradient icon with grain shadow. Analytics graph sign. Market analytics symbol. Line candlestick chart icon. Various designs. Vector. Decrease line graph vectors Candlestick chart line icon. Analytics graph sign. Halftone dotted pattern. Vector. Candlestick chart line icon. Halftone dotted pattern. Gradient icon with grain shadow. Analytics graph sign. Market analytics symbol. Line candlestick chart icon. Various designs. Vector
Free with trial Dot plot graph line icon. Halftone dotted pattern. Gradient icon with grain shadow. Presentation chart sign. Market analytics symbol. Line dot plot icon. Various designs. Vector. Decrease line graph vectors Dot plot graph line icon. Presentation chart sign. Halftone dotted pattern. Vector. Dot plot graph line icon. Halftone dotted pattern. Gradient icon with grain shadow. Presentation chart sign. Market analytics symbol. Line dot plot icon. Various designs. Vector
Free with trial A digital screen displays a stark red line graph showing a significant downward trend. The graph is set against a grid background, emphasizing the sharp decline. The image conveys a sense of financial loss, economic downturn, or negative performance. Generated by AI. Decrease line graph illustrations Digital screen displaying a sharp downward trending red line graph. A digital screen displays a stark red line graph showing a significant downward trend. The graph is set against a grid background, emphasizing the sharp decline. The image conveys a sense of financial loss, economic downturn, or negative performance. Generated by AI.
Free with trial Up and down graph icon vector in circular line. Outline bar chart with uptrend and downtrend arrow symbol. Decrease line graph vectors Up and down graph icon in circular line. Outline bar chart with uptrend and downtrend arrow symbol
Free with trial Graph up and down icon vector in circular line. Outline bar chart with arrow symbol. Analytics concept. Decrease line graph vectors Graph up and down icon in circular line. Outline bar chart with arrow symbol. Analytics concept
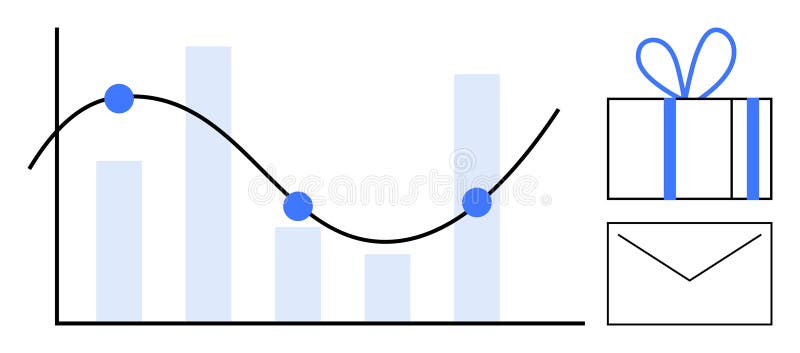
Free with trial Graph with decreasing bar chart and line graph noting key points beside a gift box and envelope. Ideal for business analysis, performance tracking, rewards programs, marketing, sales targets, client. Decrease line graph vectors Bar Graph with Line Chart, Gift Box, and Envelope Representing Business Metrics and Rewards. Graph with decreasing bar chart and line graph noting key points beside a gift box and envelope. Ideal for business analysis, performance tracking, rewards programs, marketing, sales targets, client
Free with trial Pie chart line icon. Neumorphic, Red gradient, 3d pin buttons. Presentation graph sign. Market analytics symbol. Line icons. Neumorphic buttons with outline signs. Vector. Decrease line graph vectors Pie chart line icon. Presentation graph sign. Line icons. Vector. Pie chart line icon. Neumorphic, Red gradient, 3d pin buttons. Presentation graph sign. Market analytics symbol. Line icons. Neumorphic buttons with outline signs. Vector
Free with trial Report document line icon. Neumorphic, Purple gradient, 3d pin buttons. Column graph sign. Growth diagram, pie chart symbol. Line icons. Neumorphic buttons with outline signs. Vector. Decrease line graph vectors Report document line icon. Column graph sign. Line icons. Vector. Report document line icon. Neumorphic, Purple gradient, 3d pin buttons. Column graph sign. Growth diagram, pie chart symbol. Line icons. Neumorphic buttons with outline signs. Vector
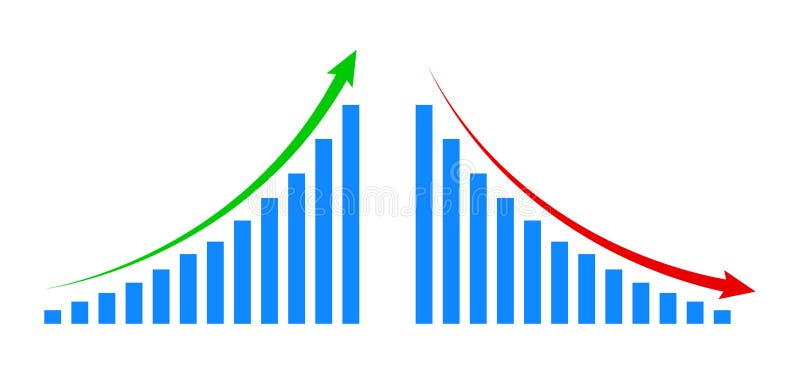
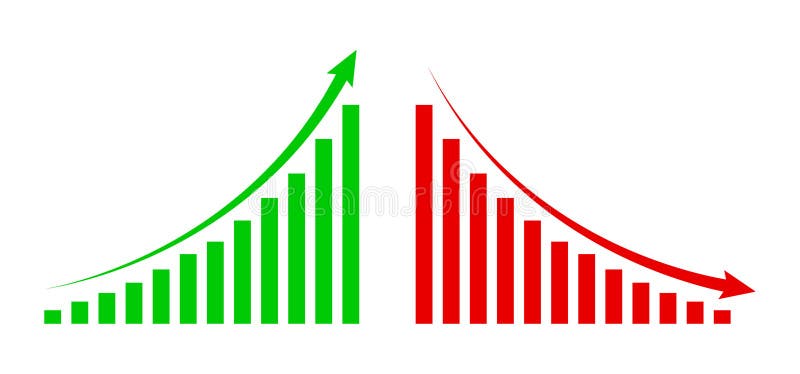
Free with trial Graph going Up and Down sign with green and red arrows. graph increase, decrease sign design. Decrease line graph vectors Graph going Up and Down sign with green and red arrows. graph increase, decrease sign
Free with trial Financial arrow up and down icon on circle line. Growth and decline graph sign symbol illustration. Decrease line graph vectors Financial arrow up and down icon on circle line. Growth and decline graph sign symbol
Free with trial Report statistics line icon. Neumorphic, Flat shadow, 3d buttons. Column graph sign. Growth diagram symbol. Line report statistics icon. Social media icons. Vector. Decrease line graph illustrations Report statistics line icon. Column graph sign. Neumorphic buttons. Vector. Report statistics line icon. Neumorphic, Flat shadow, 3d buttons. Column graph sign. Growth diagram symbol. Line report statistics icon. Social media icons. Vector
Free with trial Report statistics line icon. Neumorphic, Flat shadow, 3d buttons. Column graph sign. Growth diagram symbol. Line report statistics icon. Social media icons. Vector. Decrease line graph illustrations Report statistics line icon. Column graph sign. Neumorphic buttons. Vector. Report statistics line icon. Neumorphic, Flat shadow, 3d buttons. Column graph sign. Growth diagram symbol. Line report statistics icon. Social media icons. Vector
Free with trial Increase decrease editable stroke line icons isolated on white background. Decrease line graph vectors Increase decrease editable stroke line icons isolated on white background
Free with trial Graph laptop line icon. Halftone dotted pattern. Gradient icon with grain shadow. Column chart sign. Growth diagram symbol. Line graph laptop icon. Various designs. Vector. Decrease line graph illustrations Graph laptop line icon. Column chart sign. Halftone dotted pattern. Vector. Graph laptop line icon. Halftone dotted pattern. Gradient icon with grain shadow. Column chart sign. Growth diagram symbol. Line graph laptop icon. Various designs. Vector
Free with trial Graph line icon. Neumorphic, Orange gradient, 3d pin buttons. Column chart sign. Ab test diagram symbol. Line icons. Neumorphic buttons with outline signs. Vector. Decrease line graph vectors Graph line icon. Column chart sign. Line icons. Vector. Graph line icon. Neumorphic, Orange gradient, 3d pin buttons. Column chart sign. Ab test diagram symbol. Line icons. Neumorphic buttons with outline signs. Vector
Free with trial Graph line icon. Neumorphic, Blue gradient, 3d pin buttons. Column chart sign. Growth diagram symbol. Line icons. Neumorphic buttons with outline signs. Vector. Decrease line graph vectors Graph line icon. Column chart sign. Line icons. Vector. Graph line icon. Neumorphic, Blue gradient, 3d pin buttons. Column chart sign. Growth diagram symbol. Line icons. Neumorphic buttons with outline signs. Vector
Free with trial Line graph up and down icon in black circle. Outline bar chart with arrow symbol vector. Analytics concept. Decrease line graph vectors Line graph up and down icon in black circle. Outline bar chart with arrow symbol. Analytics concept
Free with trial A 3D render displays a white rectangular surface with a grid pattern, representing a chart. A wavy blue line traverses the grid, with two red circular markers indicating specific points on the line. The graph is presented against a soft purple background. Decrease line graph illustrations 3D Render of a Line Graph with Red Markers on a Grid Background chart data. A 3D render displays a white rectangular surface with a grid pattern, representing a chart. A wavy blue line traverses the grid, with two red circular markers indicating specific points on the line. The graph is presented against a soft purple background
Free with trial Report line icon. Continuous line with share plane. Column graph, pie chart sign. Market analytics symbol. 3d heart in speech bubble. Report single line ribbon. Loop curve pattern. Vector. Decrease line graph vectors Report line icon. Column graph, pie chart sign. Continuous line with plane. Vector. Report line icon. Continuous line with share plane. Column graph, pie chart sign. Market analytics symbol. 3d heart in speech bubble. Report single line ribbon. Loop curve pattern. Vector
Free with trial Statistics line icon. Continuous line with share plane. Column chart sign. Growth graph diagram symbol. 3d star in speech bubble. Graph chart single line ribbon. Loop curve pattern. Vector. Decrease line graph illustrations Statistics line icon. Column graph chart sign. Continuous line with plane. Vector. Statistics line icon. Continuous line with share plane. Column chart sign. Growth graph diagram symbol. 3d star in speech bubble. Graph chart single line ribbon. Loop curve pattern. Vector
Free with trial Statistics line icon. Continuous line with share plane. Column chart sign. Growth graph diagram symbol. 3d star in speech bubble. Graph chart single line ribbon. Loop curve pattern. Vector. Decrease line graph illustrations Statistics line icon. Column graph chart sign. Continuous line with plane. Vector. Statistics line icon. Continuous line with share plane. Column chart sign. Growth graph diagram symbol. 3d star in speech bubble. Graph chart single line ribbon. Loop curve pattern. Vector
Free with trial Woman dressed in gray and red points at a downward red line graph symbolizing loss or decline, conveying concern and analysis mood. Generative AI. Decrease line graph vectors Woman pointing at declining red line graph showing financial loss vector illustration. Woman dressed in gray and red points at a downward red line graph symbolizing loss or decline, conveying concern and analysis mood. Generative AI
Free with trial Up and down graph chart icon. Growth increase and decrease sign. Graph or diagram with arrow going up and down. Vector. Illustration. Decrease line graph vectors Up and down graph chart icon. Growth increase and decrease sign. Graph or diagram with arrow going up and down. Vector. Illustration
Free with trial Modern rendered line graph with yellow marker points rising and falling vertically, forming a white trend line that fluctuates across the screen. The graph represents business data such as growth, decrease, profit, and market performance. Set against a blurred office background, the image has a clean, digital aesthetic ideal for financial presentations, company reports, startup pitches, and data analysis. This visual is suitable for showcasing trading performance, corporate strategy, and economic trends. Decrease line graph illustrations Business Trend Line Graph Showing Growth and Market Fluctuations. Modern rendered line graph with yellow marker points rising and falling vertically, forming a white trend line that fluctuates across the screen. The graph represents business data such as growth, decrease, profit, and market performance. Set against a blurred office background, the image has a clean, digital aesthetic ideal for financial presentations, company reports, startup pitches, and data analysis. This visual is suitable for showcasing trading performance, corporate strategy, and economic trends.
Free with trial Report document line icon. Halftone dotted pattern. Gradient icon with grain shadow. Column graph sign. Growth diagram, pie chart symbol. Line report document icon. Various designs. Vector. Decrease line graph vectors Report document line icon. Column graph sign. Halftone dotted pattern. Vector. Report document line icon. Halftone dotted pattern. Gradient icon with grain shadow. Column graph sign. Growth diagram, pie chart symbol. Line report document icon. Various designs. Vector
Free with trial Report document line icon. Halftone dotted pattern. Gradient icon with grain shadow. Column graph sign. Growth diagram, pie chart symbol. Line report document icon. Various designs. Vector. Decrease line graph vectors Report document line icon. Column graph sign. Halftone dotted pattern. Vector. Report document line icon. Halftone dotted pattern. Gradient icon with grain shadow. Column graph sign. Growth diagram, pie chart symbol. Line report document icon. Various designs. Vector
Free with trial Close-up of gold nuggets with a line graph indicating stock market fluctuations. Generative AI. Decrease line graph illustrations Close up of gold nuggets with a line graph indicating stock market fluctuations. Close-up of gold nuggets with a line graph indicating stock market fluctuations. Generative AI
Free with trial Dollar up and down icon on circle line. USD currency arrow increase and decrease sign symbol vector. Decrease line graph vectors Dollar up and down icon on circle line. USD currency arrow increase and decrease sign symbol
Free with trial Growth and loss arrow icon on circle line. Increase and decrease sign symbol illustration. Decrease line graph vectors Growth and loss arrow icon on circle line. Increase and decrease sign symbol
Free with trial Falling bar chart with a downward trending line and arrow indicating decrease. Decrease line graph vectors Falling bar chart with a downward trending line and arrow indicating decrease
Free with trial Decline bar chart with downward trend arrow icon vector. Decrease, loss, and financial drop symbol on circle line. Decrease line graph vectors Decline bar chart with downward trend arrow icon. Decrease, loss, and financial drop symbol on circle line
Free with trial A collection of icons Upward graph, Downward graph, Growth chart, Decrease chart, Sales Analysis, Progress graph, icon. Decrease line graph vectors Upward graph, Downward graph, Growth chart, Decrease chart, Sales Analysis, Progress graph, icon
Free with trial Column 3d graph sign. Salaryman, gender equality and alert bell outline icons. Diagram chart line icon. Market analytics symbol. 3d chart line sign. Spy or profile placeholder icon. Vector. Decrease line graph vectors Diagram chart line icon. Column 3d graph sign. Salaryman, gender equality and alert bell. Vector. Column 3d graph sign. Salaryman, gender equality and alert bell outline icons. Diagram chart line icon. Market analytics symbol. 3d chart line sign. Spy or profile placeholder icon. Vector
Free with trial Graph going up and down sign financial arrows. chart increase, decrease sign with green and red arrows. vector graph with green and red arrows. Decrease line graph vectors Graph going up and down sign financial arrows. chart increase, decrease sign with green and red arrows. vector graph
Free with trial Declining bar chart with downward trend line, showing decrease and financial loss. Decrease line graph vectors Declining bar chart with downward trend line, showing decrease and financial loss
Free with trial Diagram graph line icon. Neumorphic, Flat shadow, 3d buttons. Column chart sign. Market analytics symbol. Line diagram graph icon. Social media icons. Vector. Decrease line graph vectors Diagram graph line icon. Column chart sign. Neumorphic buttons. Vector. Diagram graph line icon. Neumorphic, Flat shadow, 3d buttons. Column chart sign. Market analytics symbol. Line diagram graph icon. Social media icons. Vector
Free with trial Diagram graph line icon. Neumorphic, Red gradient, 3d pin buttons. Column chart sign. Market analytics symbol. Line icons. Neumorphic buttons with outline signs. Vector. Decrease line graph vectors Diagram graph line icon. Column chart sign. Line icons. Vector. Diagram graph line icon. Neumorphic, Red gradient, 3d pin buttons. Column chart sign. Market analytics symbol. Line icons. Neumorphic buttons with outline signs. Vector
Free with trial Decreasing graph icon vector illustration on circle line. Company bankruptcy report vector. Market crash concept. Decrease line graph vectors Decreasing graph icon vector on circle line. Company bankruptcy report vector. Market crash concept
Free with trial Line graph up and down icon vector. Outline bar chart with arrow symbol. Analytics concept. Decrease line graph vectors Line graph up and down icon. Outline bar chart with arrow symbol. Analytics concept
Free with trial Steep downward trending red line graph with an arrow on a whiteboard mounted on an easel. Decrease line graph illustrations Whiteboard showing a steep downward trending red line graph on an easel chart data. Steep downward trending red line graph with an arrow on a whiteboard mounted on an easel
Free with trial High-detail image showing a dynamic orange graph line representing financial data trends and market fluctuations. Ideal for finance and business themes. Decrease line graph illustrations Dynamic Orange Graph Line Representing Financial Data Trends and Market Fluctuations
Free with trial Analytics graph line icon. Continuous one line with curl. Column chart sign. Growth diagram symbol. Analytics graph single outline ribbon. Loop curve pattern. Vector. Decrease line graph illustrations Analytics graph line icon. Column chart sign. Continuous line with curl. Vector. Analytics graph line icon. Continuous one line with curl. Column chart sign. Growth diagram symbol. Analytics graph single outline ribbon. Loop curve pattern. Vector
Free with trial Displaying 3D bar columns on analytics dashboard, with overlaid line graph and numeric labels. Data, visualization, dashboard, analytics, infographic, 3d, abstract. Decrease line graph illustrations Displaying 3D bar columns on analytics dashboard, with overlaid line graph and numeric labels
Free with trial Graph line icon. Neumorphic, Flat shadow, 3d buttons. Column chart sign. Growth diagram symbol. Line graph chart icon. Social media icons. Vector. Decrease line graph vectors Graph line icon. Column chart sign. Neumorphic buttons. Vector. Graph line icon. Neumorphic, Flat shadow, 3d buttons. Column chart sign. Growth diagram symbol. Line graph chart icon. Social media icons. Vector
Free with trial Graph line icon. Neumorphic, Flat shadow, 3d buttons. Column chart sign. Ab test diagram symbol. Line graph chart icon. Social media icons. Vector. Decrease line graph vectors Graph line icon. Column chart sign. Neumorphic buttons. Vector. Graph line icon. Neumorphic, Flat shadow, 3d buttons. Column chart sign. Ab test diagram symbol. Line graph chart icon. Social media icons. Vector
Free with trial Report, 3D Chart, Block diagram and Dot Plot graph linear icons. Design shape elements. Charts and Diagrams line icons. Trend, Pyramid and Pie chart report symbols. Vector. Decrease line graph vectors Charts and Diagrams line icons. Set of 3D Chart, Block diagram and Dot Plot graph icons. Design elements. Vector. Report, 3D Chart, Block diagram and Dot Plot graph linear icons. Design shape elements. Charts and Diagrams line icons. Trend, Pyramid and Pie chart report symbols. Vector
Free with trial Set line Financial growth decrease, increase, Diamond and Wallet with money icon. Vector. Decrease line graph illustrations Set line Financial growth decrease, increase, Diamond and Wallet with money icon. Vector
Free with trial Diagram chart line icon. Neumorphic, Flat shadow, 3d buttons. Presentation graph sign. Market analytics symbol. Line diagram chart icon. Social media icons. Vector. Decrease line graph vectors Diagram chart line icon. Presentation graph sign. Neumorphic buttons. Vector. Diagram chart line icon. Neumorphic, Flat shadow, 3d buttons. Presentation graph sign. Market analytics symbol. Line diagram chart icon. Social media icons. Vector
Free with trial Set line Dollar rate decrease, , Global economic crisis news and Burning dollar bill icon. Vector. Decrease line graph vectors Set line Dollar rate decrease, , Global economic crisis news and Burning dollar bill icon. Vector
Free with trial Set line Financial growth decrease, Arrow, Pie chart infographic and Factory icon. Vector. Decrease line graph illustrations Set line Financial growth decrease, Arrow, Pie chart infographic and Factory icon. Vector
Free with trial Pie chart line icon. Halftone dotted pattern. Gradient icon with grain shadow. Presentation graph sign. Market analytics symbol. Line pie chart icon. Various designs. Vector. Decrease line graph vectors Pie chart line icon. Presentation graph sign. Halftone dotted pattern. Vector. Pie chart line icon. Halftone dotted pattern. Gradient icon with grain shadow. Presentation graph sign. Market analytics symbol. Line pie chart icon. Various designs. Vector
Free with trial Graph line icon. Continuous one line with curl. Column chart sign. Growth diagram symbol. Graph chart single outline ribbon. Loop curve pattern. Vector. Decrease line graph vectors Graph line icon. Column chart sign. Continuous line with curl. Vector. Graph line icon. Continuous one line with curl. Column chart sign. Growth diagram symbol. Graph chart single outline ribbon. Loop curve pattern. Vector
Free with trial Graph line icon. Continuous one line with curl. Column chart sign. Growth diagram symbol. Graph chart single outline ribbon. Loop curve pattern. Vector. Decrease line graph vectors Graph line icon. Column chart sign. Continuous line with curl. Vector. Graph line icon. Continuous one line with curl. Column chart sign. Growth diagram symbol. Graph chart single outline ribbon. Loop curve pattern. Vector
Free with trial Hand interacting with a red downward trend line against a blue bar graph background image. Generative AI. Decrease line graph illustrations Hand interacting with a red downward trend line against a blue bar graph background image
Free with trial Set line Financial growth decrease, Casino signboard, increase and Dart arrow icon. Vector. Decrease line graph vectors Set line Financial growth decrease, Casino signboard, increase and Dart arrow icon. Vector
Free with trial A 3D illustration of a blue line graph on a light blue background. The graph features a wavy blue line connecting several data points represented by small pink and green spheres. The overall shape suggests fluctuating data or trends, with some points indicating upward movement. Decrease line graph illustrations 3D Blue Line Graph with Pink and Green Data Points on Light Blue Background chart statistics. A 3D illustration of a blue line graph on a light blue background. The graph features a wavy blue line connecting several data points represented by small pink and green spheres. The overall shape suggests fluctuating data or trends, with some points indicating upward movement