Free with trial Growth vector icon. Graph or diagram with arrow going up and down. Vector illustration. Decrease line graph vectors Growth vector icon. Graph or diagram with arrow going up and down. Vector
Free with trial A stylized 3D business growth chart depicted against a light blue background. The chart features a blue mountain-like shape representing a peak, with two intersecting lines. One line, marked with pink nodes, shows fluctuations, while another line with green nodes indicates a general upward trend. This visual metaphor conveys concepts of business performance, market trends, and financial analysis. Decrease line graph illustrations 3D Stylized Business Growth Chart with Red and Green Nodes on Blue Background graph data. A stylized 3D business growth chart depicted against a light blue background. The chart features a blue mountain-like shape representing a peak, with two intersecting lines. One line, marked with pink nodes, shows fluctuations, while another line with green nodes indicates a general upward trend. This visual metaphor conveys concepts of business performance, market trends, and financial analysis
Free with trial Graph going Up and Down sign with blue arrows vector. Flat design vector illustration concept of sales bar chart symbol icon with arrow moving down and sales bar chart with arrow moving up. Decrease line graph vectors Graph going Up and Down sign with blue arrows vector. Flat design vector illustration concept of sales bar chart symbol icon. Graph going Up and Down sign with blue arrows vector. Flat design vector illustration concept of sales bar chart symbol icon with arrow moving down and sales bar chart with arrow moving up.
Free with trial Growth vector icon. Graph or diagram with arrow going up and down. Vector illustration. Decrease line graph vectors Growth vector icon. Graph or diagram with arrow going up and down. Vector
Free with trial Growth vector icon. Graph or diagram with arrow going up and down. Vector illustration. Decrease line graph vectors Growth vector icon. Graph or diagram with arrow going up and down. Vector
Free with trial Growth vector icon. Graph or diagram with arrow going up and down. Vector illustration. Decrease line graph vectors Growth vector icon. Graph or diagram with arrow going up and down. Vector
Free with trial Growth vector icon. Graph or diagram with arrow going up and down. Vector illustration. Decrease line graph vectors Growth vector icon. Graph or diagram with arrow going up and down. Vector
Free with trial Growth vector icon. Graph or diagram with arrow going up and down. Vector illustration. Decrease line graph vectors Growth vector icon. Graph or diagram with arrow going up and down. Vector
Free with trial A financial market graph on a blue background illustrating investment trends, this is a visual representation of market fluctuations and volume, reflecting economic movements, investment strategies and business performance analysis. Generative AI. Decrease line graph illustrations Financial markets graph on a blue background showing investment trends. A financial market graph on a blue background illustrating investment trends, this is a visual representation of market fluctuations and volume, reflecting economic movements, investment strategies and business performance analysis. Generative AI
Free with trial Growth vector icon. Graph or diagram with arrow going up and down. Vector illustration. Decrease line graph vectors Growth vector icon. Graph or diagram with arrow going up and down. Vector
Free with trial Decline bar chart with downward trend arrow outline icon. Decrease, loss, and financial drop symbol vector. Decrease line graph vectors Decline bar chart with downward trend arrow outline icon. Decrease, loss, and financial drop symbol
Free with trial This image depicts a descending graph and bar chart, symbolizing a stock market downturn, or bear market, and financial crisis. The illustration represents financial loss and market volatility. Decrease line graph illustrations Stock Market Downturn Bear Market, Financial Crisis, Falling Graph Illustration. This image depicts a descending graph and bar chart, symbolizing a stock market downturn, or bear market, and financial crisis. The illustration represents financial loss and market volatility.
Free with trial Simple up and down arrow line icon on black circle. Upward and downward sign symbol vector in rounded corner. Decrease line graph vectors Simple up and down arrow line icon on black circle. Upward and downward sign symbol in rounded corner
Free with trial A 3D bar chart with a red line graph indicating a significant decline, isolated on a white background. Decrease line graph illustrations Financial bar chart showing downward trend isolated on white background. A 3D bar chart with a red line graph indicating a significant decline, isolated on a white background
Free with trial This image shows a stock market graph with a downward trend, generated by AI. The red line vividly depicts a significant market decline, potentially indicating economic instability or investor uncertainty. Analyzing this data requires further context and analysis. Decrease line graph illustrations AI-Generated Stock Market Decline. This image shows a stock market graph with a downward trend, generated by AI. The red line vividly depicts a significant market decline, potentially indicating economic instability or investor uncertainty. Analyzing this data requires further context and analysis.
Free with trial The graph of the economy went down, the growth of unemployment. Market trading problems. Women are sitting on the graph and are sad vector illustration. Business is low and arrow fall. Lost money. Decrease line graph vectors The graph of the economy went down, the growth of unemployment. Market trading problems. Women are sitting on the graph and are
Free with trial Hand interacts with glowing line graphs and percentage symbols. Decrease line graph illustrations Hand interacts with glowing line graphs and percentage symbols
Free with trial Hand interacts with glowing line graphs and percentage symbols. Decrease line graph illustrations Hand interacts with glowing line graphs and percentage symbols
Free with trial A simple line drawing of a decreasing chart with an arrow pointing downwards, depicting negative growth or decline. Useful for presentations, infographics, and reports. Decrease line graph vectors Minimalist Line Style Decreasing Chart Arrow Down Financial Graphic Element. A simple line drawing of a decreasing chart with an arrow pointing downwards, depicting negative growth or decline. Useful for presentations, infographics, and reports.
Free with trial Percent growth and decline arrow icon vector. Increase and decrease percentage concept. Decrease line graph vectors Percent growth and decline arrow icon. Increase and decrease percentage concept
Free with trial Uptrend and downtrend arrow line icon in generic style. Rising and falling arrows illustration concept. Decrease line graph vectors Uptrend and downtrend arrow line icon in generic style. Rising and falling arrows concept
Free with trial Data analysis graphs with up and down arrow line icons set. Increase and reduction of economy or trend charts, price boost, stock market research thin black and red outline symbols vector illustration. Decrease line graph vectors Data analysis graphs with up and down arrow, economy or trend charts line icons set. Data analysis graphs with up and down arrow line icons set. Increase and reduction of economy or trend charts, price boost, stock market research thin black and red outline symbols vector illustration
Free with trial House model placed on a graph showcasing fluctuating mortgage rates ok. Decrease line graph illustrations House model placed on a graph showcasing fluctuating mortgage rates
Free with trial Revenue Decline line icon. Universal creative premium symbol. Vector sign icon logo template. Vector illustration. Decrease line graph vectors Revenue Decline line icon. Universal creative premium symbol. Vector sign icon logo template. Vector illustration
Free with trial Increase and decrease dollar arrow icon. USD up and down sign symbol vector. Decrease line graph vectors Increase and decrease dollar arrow icon. USD up and down sign symbol
Free with trial Increase and reduction of economy or trend charts, price boost, stock market research thin black outline symbols vector illustration. Data analysis graphs with up and down arrow line icons set. Decrease line graph vectors Data analysis graphs with up and down arrow, economy or trend charts line icons set. Increase and reduction of economy or trend charts, price boost, stock market research thin black outline symbols vector illustration. Data analysis graphs with up and down arrow line icons set.
Free with trial Pointing to Graph Showing the Trend of Fluctuations in Financial Stock Values , vibrant highlights. Decrease line graph illustrations Pointing to Graph Showing the Trend of Fluctuations in Financial Stock Values
Free with trial Graph going Up and Down sign with green and red arrows vector set. Flat design vector set of a concept of sales bar chart symbol icon with arrow moving down and sales bar chart with arrow moving up. Decrease line graph vectors Graph going Up and Down sign with green and red arrows vector set. Vector set of a concept of sales bar chart symbol icon. Graph going Up and Down sign with green and red arrows vector set. Flat design vector set of a concept of sales bar chart symbol icon with arrow moving down and sales bar chart with arrow moving up.
Free with trial A 3D render illustrates a downward trending bar chart. Five light blue vertical bars of decreasing height are arranged from left to right. A bright yellow line with an arrow at its end descends across the bars, indicating a negative trend. The background is a solid, soft pink. Decrease line graph illustrations Downward Trending Bar Chart with Yellow Arrow on a Pink Background graph data. A 3D render illustrates a downward trending bar chart. Five light blue vertical bars of decreasing height are arranged from left to right. A bright yellow line with an arrow at its end descends across the bars, indicating a negative trend. The background is a solid, soft pink
Free with trial This 3D graph, generated by AI, depicts a sharp market downturn. The red line dramatically falls, illustrating significant financial losses and economic instability. The textured background enhances the visual impact, conveying a sense of crisis. Decrease line graph illustrations AI-Generated Market Crash Visualization. This 3D graph, generated by AI, depicts a sharp market downturn. The red line dramatically falls, illustrating significant financial losses and economic instability. The textured background enhances the visual impact, conveying a sense of crisis.
Free with trial Graph going Up and Down with red arrows vector. Blue chart bar vector illustration concept of sales bar chart symbol icon with arrow moving down and sales bar chart with arrow moving up. Decrease line graph vectors Graph going Up and Down with red arrows vector. Blue chart bar vector illustration concept of sales bar chart symbol icon
Free with trial Businessman pointing at a declining graph, warning of financial trouble. Doodle style with an editable stroke. Decrease line graph vectors Businessman pointing at a declining graph, warning of financial trouble. Doodle style with an editable stroke
Free with trial A simple vector illustration of a graph showing a sharp downward trend, representing a financial crisis or market decline. Perfect for illustrating economic downturn concepts. Decrease line graph vectors Trending Downward Graph Financial Crisis Icon Stock Market Decline Illustration. A simple vector illustration of a graph showing a sharp downward trend, representing a financial crisis or market decline. Perfect for illustrating economic downturn concepts.
Free with trial Top Position and Promotion Icon Line Style Design Simple Finance and Business Vector Symbol Perfect Illustration. Decrease line graph vectors Top Position and Promotion Icon Line Style Design Simple Vector Perfect Illustration. Top Position and Promotion Icon Line Style Design Simple Finance and Business Vector Symbol Perfect Illustration
Free with trial Set of Investment, Interest rate and Percentage diagram linear icons. Design shape elements. Loan line icons. Car leasing, analytics plan, Credit card percent and loan rate. Vector. Decrease line graph vectors Loan line icons. Set of Investment, Interest rate and Percentage diagram icons. Design elements. Vector. Set of Investment, Interest rate and Percentage diagram linear icons. Design shape elements. Loan line icons. Car leasing, analytics plan, Credit card percent and loan rate. Vector
Free with trial Percent growth decline arrow icon vector on black circle. Increase and decrease percentage sign symbol. Decrease line graph vectors Percent growth decline arrow icon on black circle. Increase and decrease percentage sign symbol
Free with trial This 3D rendering showcases a vibrant bar chart illustrating business growth and financial performance. The colorful cylinders represent data points, rising to show increasing success. A line graph adds additional information about trends over time. Decrease line graph illustrations Colorful 3D Bar Chart with Growth Graph Showing Business Success and Financial Data. This 3D rendering showcases a vibrant bar chart illustrating business growth and financial performance. The colorful cylinders represent data points, rising to show increasing success. A line graph adds additional information about trends over time.
Free with trial Blue arrow pointing downward on financial graph. Business chart showing descending trend. Digital stock market data visualization for decline analysis. Decrease line graph illustrations Blue arrow pointing downward on financial graph. Business chart showing descending trend. Digital stock market data visualization for decline analysis
Free with trial Red candlestick chart and yellow line graph on dark background symbolize financial crisis, stock market crash, and global economic collapse. 3D Rendering. Decrease line graph illustrations Financial market crash with red candlestick chart and yellow line showing downward trend on dark background representing global. Red candlestick chart and yellow line graph on dark background symbolize financial crisis, stock market crash, and global economic collapse. 3D Rendering
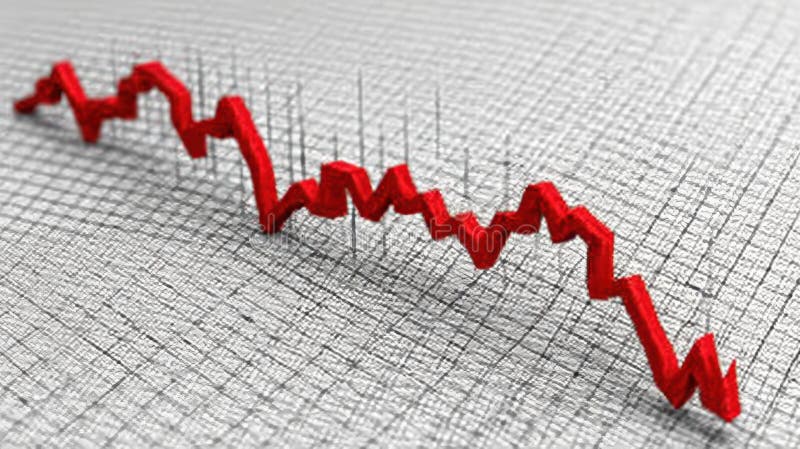
Free with trial Line chart with red and yellow bars on a black grid background, illustrating a steep decline. The graph features jagged peaks and troughs, indicating significant volatility. The use of bright colors against the dark grid enhances the dramatic effect, commonly associated with financial market downturns. Gridlines and numerical axes suggest precise data metrics. Decrease line graph illustrations Stock Market Chart With Downturn. A Dramatic Finance Graph Depicts Economic Recession. Line chart with red and yellow bars on a black grid background, illustrating a steep decline. The graph features jagged peaks and troughs, indicating significant volatility. The use of bright colors against the dark grid enhances the dramatic effect, commonly associated with financial market downturns. Gridlines and numerical axes suggest precise data metrics.
Free with trial A 3D illustration of a bar graph with a blue downward arrow, symbolizing financial decline or loss, isolated on white. Decrease line graph illustrations Bar Graph with Blue Arrow Pointing Down 3D Illustration Isolated on White Background. A 3D illustration of a bar graph with a blue downward arrow, symbolizing financial decline or loss, isolated on white.
Free with trial Dollar arrow up and down outline icon vector. USD increase and decrease sign symbol. Decrease line graph vectors Dollar arrow up and down outline icon. USD increase and decrease sign symbol
Free with trial Descending data analytics line graphic outline icon in white and black colors. descending data analytics line graphic flat vector icon from business collection for web, mobile apps and ui. Decrease line graph vectors Descending data analytics line graphic outline icon in white and black colors. descending data analytics line graphic flat vector
Free with trial Illustration shows a sad woman with a downward trending graph behind her representing loss or decline, conveying a somber and reflective mood. Generative AI. Decrease line graph vectors Sad woman standing in front of declining graph showing economic or personal loss vector illustration. Illustration shows a sad woman with a downward trending graph behind her representing loss or decline, conveying a somber and reflective mood. Generative AI
Free with trial Stock market chart featuring a red downtrend line against a black background, fluctuations in financial data. perfect for illustrating concepts in finance, investment analysis, and economic downturns. Generative AI. Decrease line graph illustrations Dynamic Stock Market Analysis with Red Downtrend Line on Black Background Generative AI. Stock market chart featuring a red downtrend line against a black background, fluctuations in financial data. perfect for illustrating concepts in finance, investment analysis, and economic downturns. Generative AI
Free with trial A financial candlestick chart illustrates a positive market trend, with green and red candles indicating price movements and a smooth green line representing a moving average. Decrease line graph illustrations Financial stock market candlestick chart showing upward trend with moving average line. A financial candlestick chart illustrates a positive market trend, with green and red candles indicating price movements and a smooth green line representing a moving average
Free with trial A 3D illustration depicting financial growth. A line graph with blue and red data points ascends across a light blue background. Interspersed are green and red candlestick bars, representing market fluctuations. Stacks of gold coins and individual coins with dollar signs are arranged at the base of the chart, symbolizing wealth and investment. Decrease line graph illustrations 3D Financial Growth Chart with Stacks of Gold Coins and Candlestick Bars finance graph. A 3D illustration depicting financial growth. A line graph with blue and red data points ascends across a light blue background. Interspersed are green and red candlestick bars, representing market fluctuations. Stacks of gold coins and individual coins with dollar signs are arranged at the base of the chart, symbolizing wealth and investment
Free with trial Ranking stars, Refresh bitcoin and Dirty water minimal line icons. 3d spheres or balls buttons. Decreasing graph icons. For web, application, printing. Vector. Decrease line graph vectors Ranking stars, Refresh bitcoin and Dirty water minimal line icons. For web application, printing. Vector. Ranking stars, Refresh bitcoin and Dirty water minimal line icons. 3d spheres or balls buttons. Decreasing graph icons. For web, application, printing. Vector
Free with trial Red graph shows plummeting house prices scattered coins economic crisis risk management Vector illustration for high-quality printing. Decrease line graph illustrations Red graph shows plummeting house prices; scattered coins , economic crisis, risk management. Red graph shows plummeting house prices scattered coins economic crisis risk management Vector illustration for high-quality printing
Free with trial Declining chart icon. Downward trend symbol. Falling graph illustration. Simple vector design. EPS 10. Decrease line graph vectors Declining chart icon. Downward trend symbol. Falling graph illustration. Simple vector design.
Free with trial This vibrant image showcases a collection of colorful 3D charts and graphs, including bar graphs, pie charts, and a line graph, all illustrating positive growth. A calculator and pencil are included, emphasizing the analytical and planning aspects of business success. Perfect for illustrating finan. Decrease line graph illustrations Colorful 3D Financial Charts and Graphs with Calculator for Business Growth Presentation. This vibrant image showcases a collection of colorful 3D charts and graphs, including bar graphs, pie charts, and a line graph, all illustrating positive growth. A calculator and pencil are included, emphasizing the analytical and planning aspects of business success. Perfect for illustrating finan
Free with trial Red graph shows plummeting house prices scattered coins coin scatter investment strategy Vector illustration. Decrease line graph illustrations Red graph shows plummeting house prices; scattered coins , coin scatter, investment strategy. Red graph shows plummeting house prices scattered coins coin scatter investment strategy Vector illustration.
Free with trial 3D rendering of declining bar and line graphs on a grid background. Decrease line graph illustrations 3D rendering of declining bar and line graphs on a grid background
Free with trial Outline bar chart icon vector with upward and downward trend arrow. Uptrend and downtrend business graph symbol in black circle. Decrease line graph vectors Outline bar chart icon with upward and downward trend arrow. Uptrend and downtrend business graph symbol in black circle
Free with trial AI-powered trend prediction graph showing CSRpoepiojican metrics over time. Data visualization of future trends. Decrease line graph illustrations AI Trend Prediction Graph Visualization: Data Analysis of CSRpoepiojican Metrics Over Time. AI-powered trend prediction graph showing CSRpoepiojican metrics over time. Data visualization of future trends
Free with trial Economic recession, business owner seated on a falling down bar graph and a red arrow. Decrease line graph vectors Economic recession, business owner seated on a falling down bar graph and a red arrow
Free with trial Hand-drawn line chart doodle is showing grid backdrop and axis over gradient background, copy space. Data visualization, infographics, analytics, diagram, business, educational, minimalistic. Decrease line graph illustrations Hand-drawn line chart doodle is showing grid backdrop and axis over gradient background, copy space
Free with trial Set line Worker, Credit card, Global economic crisis and. Business infographic template. Vector. Decrease line graph vectors Set line Worker, Credit card, Global economic crisis and . Business infographic template. Vector
Free with trial Percent growth decline arrow icon. Increase and decrease percentage sign symbol vector. Decrease line graph vectors Percent growth decline arrow icon. Increase and decrease percentage sign symbol
Free with trial House model placed on a graph showcasing fluctuating mortgage rates ok. Decrease line graph illustrations House model placed on a graph showcasing fluctuating mortgage rates
Free with trial House model placed on a graph showcasing fluctuating mortgage rates ok. Decrease line graph illustrations House model placed on a graph showcasing fluctuating mortgage rates
Free with trial A striking graph illustrates opposing trends one line sharply decreases while another rises, enveloped in warm orange hues that evoke energy and transformation. Decrease line graph illustrations Dynamic Trends Displayed Through Contrasting Lines in Shades of Orange With a Vivid Background. A striking graph illustrates opposing trends one line sharply decreases while another rises, enveloped in warm orange hues that evoke energy and transformation
Free with trial Loan interest rate doodle icon set. Hand drawn sketch doodle line style bank money loan interest rate icon for house, car discount percentage concept. Trendy cute element. Vector illustration. Decrease line graph vectors Loan interest rate doodle icon set. Hand drawn sketch doodle line style bank money loan interest rate icon for house
Free with trial Loan interest rate doodle icon set. Hand drawn sketch doodle line style bank money loan interest rate icon for house, car discount percentage concept. Trendy cute element. Vector illustration. Decrease line graph vectors Loan interest rate doodle icon set. Hand drawn sketch doodle line style bank money loan interest rate icon for house
Free with trial Loan interest rate doodle icon set. Hand drawn sketch doodle line style bank money loan interest rate icon for house, car discount percentage concept. Trendy cute element. Vector illustration. Decrease line graph vectors Loan interest rate doodle icon set. Hand drawn sketch doodle line style bank money loan interest rate icon for house
Free with trial Loan interest rate doodle icon set. Hand drawn sketch doodle line style bank money loan interest rate icon for house, car discount percentage concept. Trendy cute element. Vector illustration. Decrease line graph vectors Loan interest rate doodle icon set. Hand drawn sketch doodle line style bank money loan interest rate icon for house
Free with trial Loan interest rate doodle icon set. Hand drawn sketch doodle line style bank money loan interest rate icon for house, car discount percentage concept. Trendy cute element. Vector illustration. Decrease line graph vectors Loan interest rate doodle icon set. Hand drawn sketch doodle line style bank money loan interest rate icon for house
Free with trial A financial illustration shows coins decreasing in size along a horizontal axis, representing devaluation. An upward-pointing arrow indicates increasing inflation percentages, with labels of "4%", "20%", and "50%". The chart is labeled "INFLATION" at the top, with percentages scattered around. Broken pieces from a large coin suggest fragmentation and loss of value. The background features a subtle line graph, reinforcing the economic theme. Decrease line graph illustrations Inflation increasing and devaluing money, showing a financial chart with coins and an arrow going up. A financial illustration shows coins decreasing in size along a horizontal axis, representing devaluation. An upward-pointing arrow indicates increasing inflation percentages, with labels of "4%", "20%", and "50%". The chart is labeled "INFLATION" at the top, with percentages scattered around. Broken pieces from a large coin suggest fragmentation and loss of value. The background features a subtle line graph, reinforcing the economic theme.
Free with trial Percent up and down icon on circle line. Percentage arrow growth and decline sign symbol vector. Decrease line graph vectors Percent up and down icon on circle line. Percentage arrow growth and decline sign symbol
Free with trial Inventory cart, Snowflake and 3d chart minimal line icons. Neon laser 3d lights. People icons. For web, application, printing. Warehouse goods, Snow, Presentation column. Support job. Vector. Decrease line graph vectors Inventory cart, Snowflake and 3d chart minimal line icons. For web application, printing. Neon laser 3d lights. Vector. Inventory cart, Snowflake and 3d chart minimal line icons. Neon laser 3d lights. People icons. For web, application, printing. Warehouse goods, Snow, Presentation column. Support job. Vector
Free with trial Declining red arrow and bar graph against a matching backdrop visually represent a significant economic downturn and financial market losses indicating potential business risks and investment failure. Decrease line graph illustrations Red downward trend line and bar graph illustrate economic decline and financial market downturn effect. Declining red arrow and bar graph against a matching backdrop visually represent a significant economic downturn and financial market losses indicating potential business risks and investment failure
Free with trial Chart icons for data analysis vector art design, Minimalist business charts icons bar graphs, line graphs, and pie charts vector illustration on white background the image is generated using AI. Decrease line graph vectors Chart icons for data analysis vector art design, Minimalist business charts icons bar graphs, line graphs, and pie charts vector
Free with trial Inflation or interest rate falling down, decrease or reduction, profit fall in economic recession, stock market value loss, FED reduce interest rate, businessman on percentage sign with falling down. Decrease line graph vectors Inflation or interest rate falling down, decrease or reduction, profit fall in economic recession, stock market value loss, FED
Free with trial Inflation or interest rate falling down, decrease or reduction, profit fall in economic recession, stock market value loss, FED reduce interest rate, businessman on percentage sign with falling down. Decrease line graph vectors Inflation or interest rate falling down, decrease or reduction, profit fall in economic recession, stock market value loss, FED
Free with trial Business Analytics And Data Visualization Line Icon Set. Financial Growth, Market Trends, And Performance Analysis Outline Symbol Collection. Editable Stroke. Isolated Vector Illustration. Decrease line graph vectors Business Analytics And Data Visualization Line Icon Set. Financial Growth, Market Trends, And Performance Analysis
Free with trial Set line Global economic crisis, and Calculation of expenses on seamless pattern. Vector. Decrease line graph illustrations Set line Global economic crisis, and Calculation of expenses on seamless pattern. Vector
Free with trial Reduction chart icon Black line art vector in black and white outline set collection sign. Decrease line graph vectors Decline Chart Icon Illustrating Decrease in Performance, Economic Downturn, and Analytical Data. Reduction chart icon Black line art vector in black and white outline set collection sign
Free with trial Business and financial concept. Bar graph with a drop-down arrow to show low cost on black background. Decrease line graph vectors Business and financial concept. Bar graph with drop-down arrow to show low cost on black background
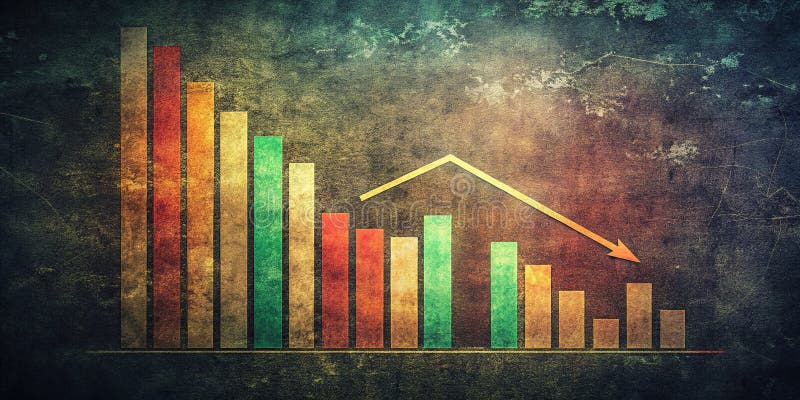
Free with trial This striking vintage-style bar graph, set against a dramatic dark background, visually represents a consistent downward trend in financial data. The muted colors and grainy texture add an authentic, analog feel to the digital visualization, emphasizing the impactful nature of the decline. Ideal for business presentations, financial reports, or investment analysis, this image powerfully. Decrease line graph illustrations Vintage Bar Graph Depicts Consistent Market Decline A Financial Data Visualization for Trend Analysis. This striking vintage-style bar graph, set against a dramatic dark background, visually represents a consistent downward trend in financial data. The muted colors and grainy texture add an authentic, analog feel to the digital visualization, emphasizing the impactful nature of the decline. Ideal for business presentations, financial reports, or investment analysis, this image powerfully