Free with trial A minimalist vector icon illustrating market volatility and financial trends. The graphic features two distinct line graphs on a coordinate system: a jagged, highly fluctuating upper line representing high volatility, and a smoother lower line with marked points indicating a general trend. Up-down arrows and separate up down indicators further emphasize market movement and unpredictable changes. Ideal for financial reports, business presentations, data visualization, and economic analysis. Decrease line graph vectors Market Volatility and Financial Trend Graph Icon. A minimalist vector icon illustrating market volatility and financial trends. The graphic features two distinct line graphs on a coordinate system: a jagged, highly fluctuating upper line representing high volatility, and a smoother lower line with marked points indicating a general trend. Up-down arrows and separate up down indicators further emphasize market movement and unpredictable changes. Ideal for financial reports, business presentations, data visualization, and economic analysis.
Free with trial A clean, minimalist icon representing the stock market. The image features a bull and a bear, symbolizing market trends, with a rising green arrow indicating an upward trend. The design is enclosed in a circular frame, suitable for financial reports, investment presentations, or business infographics. The simple line art style makes it versatile for various applications. Decrease line graph illustrations Stock Market Bull and Bear Trend Icon. A clean, minimalist icon representing the stock market. The image features a bull and a bear, symbolizing market trends, with a rising green arrow indicating an upward trend. The design is enclosed in a circular frame, suitable for financial reports, investment presentations, or business infographics. The simple line art style makes it versatile for various applications.
Free with trial Set of six black business charts icons showing growth and decline trends with arrows and bars in vector style clear and simple design calm. Generative AI. Decrease line graph vectors Business growth and decline charts arrows statistics bar graph icons vector illustration. Set of six black business charts icons showing growth and decline trends with arrows and bars in vector style clear and simple design calm. Generative AI
Free with trial Decline Chart simple icons set designed in filled, outline, line and stroke style. Decrease line graph vectors Decline Chart simple icons set designed in filled and stroke style. Decline Chart simple icons set designed in filled, outline, line and stroke style
Free with trial This vector graphic depicts a magnifying glass focused on a female figure and a declining bar graph, symbolizing the. Decrease line graph illustrations Women\'s Job Loss Magnifying Glass on Female Employment Decline. This vector graphic depicts a magnifying glass focused on a female figure and a declining bar graph, symbolizing the.
Free with trial This image features a variety of icons representing financial growth, percentage increases, and economic trends. The icons include symbols of upward and downward arrows, bar graphs, line graphs, and percentage signs, all in a simple, black-and-white design. These icons are commonly used in financial charts, business presentations, and economic reports to illustrate data trends and financial. Decrease line graph vectors Collection of financial growth and percentage icons. This image features a variety of icons representing financial growth, percentage increases, and economic trends. The icons include symbols of upward and downward arrows, bar graphs, line graphs, and percentage signs, all in a simple, black-and-white design. These icons are commonly used in financial charts, business presentations, and economic reports to illustrate data trends and financial
Free with trial A conceptual vector illustration depicting the currency exchange rate between the US Dollar (USD) and the Euro (EUR). The green dollar sign is shown with an upward-pointing arrow and a rising trend line, symbolizing an increase in its value. Conversely, the red Euro sign is accompanied by a downward-pointing arrow and a falling trend line, indicating a decrease in its value. A red checkmark sits between them, emphasizing the shift. This graphic effectively visualizes market fluctuations, forex trading, economic trends, and international finance, suitable for financial news, reports, and presentations. Decrease line graph vectors USD EUR Currency Exchange Rate Trend and Fluctuation. A conceptual vector illustration depicting the currency exchange rate between the US Dollar (USD) and the Euro (EUR). The green dollar sign is shown with an upward-pointing arrow and a rising trend line, symbolizing an increase in its value. Conversely, the red Euro sign is accompanied by a downward-pointing arrow and a falling trend line, indicating a decrease in its value. A red checkmark sits between them, emphasizing the shift. This graphic effectively visualizes market fluctuations, forex trading, economic trends, and international finance, suitable for financial news, reports, and presentations.
Free with trial Graphic bar chart illustrating business data analysis, financial statistics, and market trends with both positive growth and negative decline on a clean white background. Decrease line graph vectors Business financial graph showing increase and decrease. Graphic bar chart illustrating business data analysis, financial statistics, and market trends with both positive growth and negative decline on a clean white background
Free with trial Reduce costs concept, business and company to keep cost low, cut spending or expense deduction in budget plan, businessman breaking the graph cost. Decrease line graph vectors Reduce costs concept
Free with trial A collection of nine flat vector icons for data visualization including bar graphs, line charts, pie charts, and performance meters isolated on a white background. Decrease line graph vectors Simple black data analysis and business chart icon set. A collection of nine flat vector icons for data visualization including bar graphs, line charts, pie charts, and performance meters isolated on a white background
Free with trial A 3D illustration of a financial chart showing a dramatic downward trend. A large red arrow points sharply down over a series of declining blue bar graphs, symbolizing a stock market crash, economic recession, or business failure. The background features complex data and grids, representing financial analysis and market data. This image is perfect for concepts related to economic crisis, investment loss, financial risk, bankruptcy, and negative business reports. Decrease line graph illustrations Stock Market Crash Financial Graph. A 3D illustration of a financial chart showing a dramatic downward trend. A large red arrow points sharply down over a series of declining blue bar graphs, symbolizing a stock market crash, economic recession, or business failure. The background features complex data and grids, representing financial analysis and market data. This image is perfect for concepts related to economic crisis, investment loss, financial risk, bankruptcy, and negative business reports.
Free with trial This image depicts a financial downturn, with stacks of coins decreasing under a magnifying glass, accompanied by a. Decrease line graph illustrations Economic Downturn Magnifying Glass on Falling Money Graph. This image depicts a financial downturn, with stacks of coins decreasing under a magnifying glass, accompanied by a.
Free with trial A collection of eight thin-line related to finance and business. The depict a stack of coins with a dollar sign, a document with a dollar sign, an upward trending graph over city buildings, and a bar chart with a plus sign. The bottom row coins and currency symbols, a calculator with a dollar sign, a document with a calculator and charts, and a person. Decrease line graph illustrations Financial set with charts and calculator finance business. A collection of eight thin-line related to finance and business. The depict a stack of coins with a dollar sign, a document with a dollar sign, an upward trending graph over city buildings, and a bar chart with a plus sign. The bottom row coins and currency symbols, a calculator with a dollar sign, a document with a calculator and charts, and a person
Free with trial A digital illustration depicting a Bitcoin crash. A glowing Bitcoin symbol is shown breaking apart with a downward trending line graph overlaid on a dark, grid-like background. The image represents financial loss, market volatility, and the risks associated with cryptocurrency investments. Suitable for illustrating articles about economic downturns, crypto market analysis, and investment strategies. Decrease line graph illustrations Bitcoin Crash: Market Downturn Concept. A digital illustration depicting a Bitcoin crash. A glowing Bitcoin symbol is shown breaking apart with a downward trending line graph overlaid on a dark, grid-like background. The image represents financial loss, market volatility, and the risks associated with cryptocurrency investments. Suitable for illustrating articles about economic downturns, crypto market analysis, and investment strategies.
Free with trial An empty corporate conference room featuring a large wooden table, office chairs, and a whiteboard displaying a hand-drawn graph indicating a downward trend in performance. Decrease line graph illustrations Modern Office Conference Room Showing Financial Loss Chart. An empty corporate conference room featuring a large wooden table, office chairs, and a whiteboard displaying a hand-drawn graph indicating a downward trend in performance
Free with trial A downward trending bar graph with a question mark is examined under a magnifying glass, symbolizing uncertainty and. Decrease line graph illustrations Decreasing Chart Under Magnifying Glass with Question Mark. A downward trending bar graph with a question mark is examined under a magnifying glass, symbolizing uncertainty and.
Free with trial Data analytics dashboard illustrating a mix of line graphs, bar charts, and data summaries, representing business growth, financial trends, and statistical insights for market analysis. Decrease line graph vectors Data analytics dashboard showing business growth and decline. Data analytics dashboard illustrating a mix of line graphs, bar charts, and data summaries, representing business growth, financial trends, and statistical insights for market analysis
Free with trial Set of alpha transparent business and finance icons drawn in white chalk, illustrating net asset value rising and falling alongside a market chart and Indian currency notation. Decrease line graph vectors Sketch of mutual fund NAV increase and decrease icons with Indian rupee symbol alpha transparent. Set of alpha transparent business and finance icons drawn in. Set of alpha transparent business and finance icons drawn in white chalk, illustrating net asset value rising and falling alongside a market chart and Indian currency notation.
Free with trial Black and white graph with dollar signs and decreasing trend line on white background. Decrease line graph vectors Black map pin icon with white circle in center. Black and white graph with dollar signs and decreasing trend line on white background
Free with trial Outline vector graphic depicting a decline in business performance. Decrease line graph illustrations Declining Performance Gear, Man, Graph, Arrow. Business Downturn. Outline vector graphic depicting a decline in business performance.
Free with trial This comprehensive vector illustration features a set of 18 flat icons depicting various financial trends, market indicators, and warning signals. The collection includes rising and falling line graphs, bar charts, currency symbols (dollar and euro) indicating fluctuations, and alert symbols like sirens and exclamation marks. Ideal for illustrating concepts of economic growth, decline, market volatility, financial crisis, investment risks, and business performance. Perfect for presentations, reports, websites, and applications related to finance, economics, and stock markets. Decrease line graph vectors Financial Trends, Market Indicators and Crisis Alert Icons Set. This comprehensive vector illustration features a set of 18 flat icons depicting various financial trends, market indicators, and warning signals. The collection includes rising and falling line graphs, bar charts, currency symbols (dollar and euro) indicating fluctuations, and alert symbols like sirens and exclamation marks. Ideal for illustrating concepts of economic growth, decline, market volatility, financial crisis, investment risks, and business performance. Perfect for presentations, reports, websites, and applications related to finance, economics, and stock markets.
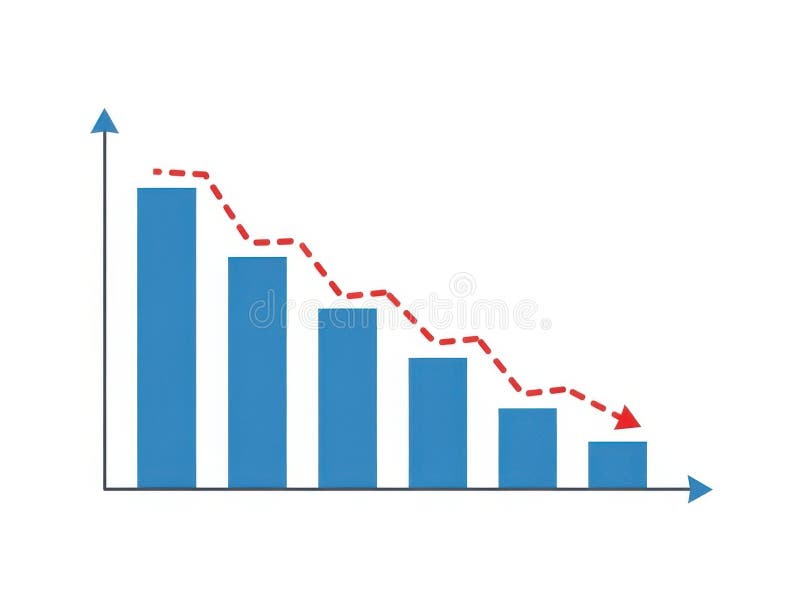
Free with trial This image features a bar chart with a decreasing trend isolated on a white background. The chart displays blue bars that progressively decrease in height from left to right, with a red dashed line indicating the downward trend. The horizontal axis represents different categories, while the vertical axis shows the corresponding values. The image is clear and SEO-friendly, highlighting data. Decrease line graph illustrations Bar chart with decreasing trend isolated on white background. This image features a bar chart with a decreasing trend isolated on a white background. The chart displays blue bars that progressively decrease in height from left to right, with a red dashed line indicating the downward trend. The horizontal axis represents different categories, while the vertical axis shows the corresponding values. The image is clear and SEO-friendly, highlighting data
Free with trial Collection of simple black vector icons representing financial charts, data analysis graphs, and business statistics. Includes trend arrows, magnifier, and settings symbols. Decrease line graph vectors Set of black business graph and chart icons for data analysis. Collection of simple black vector icons representing financial charts, data analysis graphs, and business statistics. Includes trend arrows, magnifier, and settings symbols
Free with trial A magnifying glass focuses on a downward trend graph and briefcase, symbolizing economic downturn analysis and market. Decrease line graph illustrations Economic Downturn Analysis Magnifying Glass on Market Decline. A magnifying glass focuses on a downward trend graph and briefcase, symbolizing economic downturn analysis and market.
Free with trial This image features a clear financial chart on a plain white background, illustrating a significant downward trend. A bold red line with an arrow points sharply downwards, symbolizing decline, loss, or a crisis. A grey line, possibly representing historical data or another metric, also shows a general downward movement. This visual effectively conveys concepts of economic recession, market crash, poor business performance, or financial distress. It's ideal for presentations, reports, news articles, or any content discussing negative economic indicators, investment risks, or strategic challenges. Decrease line graph vectors Financial Chart Illustrating Economic Decline and Market Downturn. This image features a clear financial chart on a plain white background, illustrating a significant downward trend. A bold red line with an arrow points sharply downwards, symbolizing decline, loss, or a crisis. A grey line, possibly representing historical data or another metric, also shows a general downward movement. This visual effectively conveys concepts of economic recession, market crash, poor business performance, or financial distress. It's ideal for presentations, reports, news articles, or any content discussing negative economic indicators, investment risks, or strategic challenges.
Free with trial A striking 3D rendering depicts a significant financial market decline, symbolized by a bold red arrow sharply pointing downwards across a dark grey background. The scene includes a subtle line graph and bar charts in shades of red and grey, illustrating a negative trend in data. This image effectively conveys concepts of economic recession, stock market crash, business losses, and financial crisis. Ideal for articles, presentations, and reports discussing market downturns, investment risks, or economic challenges. Decrease line graph illustrations Financial Market Decline with Red Arrow Chart. A striking 3D rendering depicts a significant financial market decline, symbolized by a bold red arrow sharply pointing downwards across a dark grey background. The scene includes a subtle line graph and bar charts in shades of red and grey, illustrating a negative trend in data. This image effectively conveys concepts of economic recession, stock market crash, business losses, and financial crisis. Ideal for articles, presentations, and reports discussing market downturns, investment risks, or economic challenges.
Free with trial This graphic illustration depicts a stark representation of declining business performance. It features a bar chart with three colorful bars (yellow, orange, green) suggesting varying data points, overlaid with three distinct lines in yellow, blue, and orange, all sharply descending downwards. A prominent red arrow points downwards, emphasizing the negative trend. A small yellow plus sign is also visible, potentially signifying a point of reference or a contrasting element. The clean white background isolates the graphical elements, making them ideal for conveying concepts of loss, recession, or negative growth. Decrease line graph illustrations Declining Business Graph with Downward Arrows. This graphic illustration depicts a stark representation of declining business performance. It features a bar chart with three colorful bars (yellow, orange, green) suggesting varying data points, overlaid with three distinct lines in yellow, blue, and orange, all sharply descending downwards. A prominent red arrow points downwards, emphasizing the negative trend. A small yellow plus sign is also visible, potentially signifying a point of reference or a contrasting element. The clean white background isolates the graphical elements, making them ideal for conveying concepts of loss, recession, or negative growth.
Free with trial A close-up shot of a smartphone displaying a stock market chart, showing fluctuating prices. The dark theme enhances the visual impact of the pink graph line, generated by AI for a modern and sleek aesthetic. This image is perfect for illustrating financial technology, mobile trading, and investmen. Decrease line graph illustrations Mobile Stock Market Chart. A close-up shot of a smartphone displaying a stock market chart, showing fluctuating prices. The dark theme enhances the visual impact of the pink graph line, generated by AI for a modern and sleek aesthetic. This image is perfect for illustrating financial technology, mobile trading, and investmen
Free with trial A collection of nine simple, solid black icons on a white background, illustrating concepts of decline, loss, and negative trends using various charts like bar graphs, line graphs, and pie charts with downward pointing arrows. Decrease line graph vectors Set of black icons representing financial decrease and downward trends. A collection of nine simple, solid black icons on a white background, illustrating concepts of decline, loss, and negative trends using various charts like bar graphs, line graphs, and pie charts with downward pointing arrows
Free with trial A comprehensive collection of hand-drawn business and data visualization icons. This doodle-style set features a variety of essential elements, including different types of arrows, bar graphs, line charts, and pie charts. The sketchy, black and white illustrations are perfect for infographics, presentations, financial reports, and marketing materials. Each icon is isolated on a white background, representing concepts like growth, statistics, process flow, and direction. This versatile vector set is ideal for adding a creative, hand-made touch to any project related to analytics, finance, or strategy. Decrease line graph illustrations Hand Drawn Business and Finance Doodle Icon Set. A comprehensive collection of hand-drawn business and data visualization icons. This doodle-style set features a variety of essential elements, including different types of arrows, bar graphs, line charts, and pie charts. The sketchy, black and white illustrations are perfect for infographics, presentations, financial reports, and marketing materials. Each icon is isolated on a white background, representing concepts like growth, statistics, process flow, and direction. This versatile vector set is ideal for adding a creative, hand-made touch to any project related to analytics, finance, or strategy.
Free with trial Collection of business growth and financial analysis icons featuring bar charts and arrows with editable line art and flat shape style. Editable vector icon set. Decrease line graph vectors Collection of business growth and financial analysis icons featuring bar charts and arrows with editable line art and flat shape
Free with trial A black and white line illustration depicts a bar chart with bars of decreasing height from left to right. A thick, angular arrow points downwards across the chart, indicating a negative trend. To the upper right of the arrow, a circle contains a dollar sign, representing currency. The overall composition suggests a financial downturn or loss. Decrease line graph vectors Bar chart with downward trend arrow and dollar coin. A black and white line illustration depicts a bar chart with bars of decreasing height from left to right. A thick, angular arrow points downwards across the chart, indicating a negative trend. To the upper right of the arrow, a circle contains a dollar sign, representing currency. The overall composition suggests a financial downturn or loss
Free with trial A collage of nine distinct charts and graphs, primarily displaying financial data, growth trends, and economic indicators. The visuals feature line graphs, area charts, and bar charts with various colored lines and shaded areas representing different metrics over time. Accompanying text and labels suggest analysis of business performance, economic growth, and financial markets. This collection is ideal for presentations, reports, and articles related to finance, economics, and business analytics. Decrease line graph illustrations Collection of Financial and Business Growth Charts. A collage of nine distinct charts and graphs, primarily displaying financial data, growth trends, and economic indicators. The visuals feature line graphs, area charts, and bar charts with various colored lines and shaded areas representing different metrics over time. Accompanying text and labels suggest analysis of business performance, economic growth, and financial markets. This collection is ideal for presentations, reports, and articles related to finance, economics, and business analytics.
Free with trial Abstract 3D render of a financial growth chart. The image features a series of vertical bars, some in teal and others in orange, representing data points on a graph. The bars increase in height towards the right, suggesting positive growth or progress. The chart is set against a dark background with a subtle grid pattern and a reflective surface, adding depth and visual interest. Suitable for illustrating financial reports, market analysis, or business trends. Decrease line graph illustrations Abstract Financial Growth Chart. Abstract 3D render of a financial growth chart. The image features a series of vertical bars, some in teal and others in orange, representing data points on a graph. The bars increase in height towards the right, suggesting positive growth or progress. The chart is set against a dark background with a subtle grid pattern and a reflective surface, adding depth and visual interest. Suitable for illustrating financial reports, market analysis, or business trends.