Free with trial Declining graph icon in line design. decline, graph, chart, analytics, business, decrease, statistics on white background vector. Declining graph editable stroke icon. Decrease line graph vectors Declining graph icon in line design. decline, graph, chart, analytics, business, decrease, statistics on white background vector
Free with trial A flat vector icon of a line graph showing a downward trend. Represents financial loss, market decline, negative statistics, or decreasing performance. Suitable for business reports, financial news, or graphics illustrating economic downturns, vector design Generative AI. Decrease line graph vectors Downward trending line graph icon financial market decrease, vector design Generative AI. A flat vector icon of a line graph showing a downward trend. Represents financial loss, market decline, negative statistics, or decreasing performance. Suitable for business reports, financial news, or graphics illustrating economic downturns, vector design Generative AI
Free with trial A stark bar graph illustrates a clear downward trend, symbolized by a descending arrow. This image represents decline, decrease, or negative progression in data. Decrease line graph vectors Vector art of bar graph with a downward trend line indicating decline or decrease in data. A stark bar graph illustrates a clear downward trend, symbolized by a descending arrow. This image represents decline, decrease, or negative progression in data
Free with trial Recession down loss arrows icon simple graphic line stroke and solid bold vector set, decrease negative graph shape silhouette logo, statistics low performance element image clip art. Decrease line graph vectors Recession down loss arrows icon simple graphic line stroke and solid bold vector set, decrease negative graph shape silhouette
Free with trial Oil price decrease graph color line icon with down arrows, barrels and drop of crude oil. Economic and energy industry crisis vector outline symbol, economy downturn, finance and business recession. Decrease line graph vectors Oil price decrease graph line icon, energy crisis. Oil price decrease graph color line icon with down arrows, barrels and drop of crude oil. Economic and energy industry crisis vector outline symbol, economy downturn, finance and business recession
Free with trial Stock market graph loss icon graphic vector line stroke outline art, negative decrease down trend chart arrow sign symbol pictogram, economy crash indicator image clipart. Decrease line graph vectors Stock market graph loss icon graphic vector line stroke outline art, negative decrease down trend chart arrow sign symbol
Free with trial Graph reduction with arrow down, line chart icon. Financial fall, decrease, fail. Statistics and analytics. Vector flat illustration. Decrease line graph vectors Graph reduction with arrow down, line chart icon. Financial fall, decrease, fail. Statistics and analytics. Vector illustration
Free with trial Graph growth with arrow up and reduction with arrow down, line chart icon. Financial invest, fall, increase and decrease. Statistics and analytics. Vector flat illustration. Decrease line graph vectors Graph growth with arrow up and reduction with arrow down, line chart icon. Financial invest, fall, increase and decrease
Free with trial Graph growth with arrow up and reduction with arrow down, line chart icon. Financial invest, fall, increase and decrease. Statistics and analytics. Vector flat illustration. Decrease line graph vectors Graph growth with arrow up and reduction with arrow down, line chart icon. Financial invest, fall, increase and decrease
Free with trial Finance data analytics, decrease graph line icon. Business research report analysis, finance performance analytics or company statistic outline vector icon column infographics and pointing down arrow. Decrease line graph illustrations Finance data analytics, decrease graph line icon
Free with trial A line graph representing the correlation between the rise in grocery prices and the decrease in household savings emphasizing the economic shock on personal finances.. Vector. Decrease line graph vectors A line graph representing the correlation between the rise in grocery prices and the decrease in household savings
Free with trial A line graph displaying the decrease in crop yields over time with each line representing a different type of crop and highlighting the overall downward trend.. Vector illustration. Decrease line graph vectors A line graph displaying the decrease in crop yields over time with each line representing a different type of crop and
Free with trial A concise vector illustration of a red downward trending line graph, indicating an economic downturn or statistical decrease. This graphic is ideal for financial analysis, business reports, performance reviews, or economic forecasts. It clearly represents a decline in data, suitable for analytical and business-oriented designs, vector design Generative AI. Decrease line graph vectors Red downward trend line graph, economic downturn, statistical decrease, vector design Generative AI. A concise vector illustration of a red downward trending line graph, indicating an economic downturn or statistical decrease. This graphic is ideal for financial analysis, business reports, performance reviews, or economic forecasts. It clearly represents a decline in data, suitable for analytical and business-oriented designs, vector design Generative AI
Free with trial Decrease graph icon on circle line. Statistic illustration concept. Decrease line graph vectors Decrease graph icon on circle line. Statistic concept. Decrease graph icon on circle line. Statistic illustration concept
Free with trial Set line Graph, chart, diagram, Wrench and gear and Financial growth decrease. Business infographic template. Vector. Decrease line graph vectors Set line Graph, chart, diagram, Wrench and gear and Financial growth decrease. Business infographic template. Vector
Free with trial Set line Financial growth decrease, Graph, chart, diagram and Clock icon. Vector. Decrease line graph illustrations Set line Financial growth decrease, Graph, chart, diagram and Clock icon. Vector
Free with trial An older couple looking worried as they watch a graph showing their retirement savings decrease while a line representing student debt rises steadily.. Vector illustration. Decrease line graph vectors An older couple looking worried as they watch a graph showing their retirement savings decrease while a line
Free with trial Yellow business trend line graph shows financial decline, revenue decrease with white arrow pointing downward, market fall concept. Decrease line graph illustrations Yellow business trend line graph shows financial decline, revenue decrease with white arrow pointing downward
Free with trial Exponential Decay Curve Graph, icon in line design. Exponential, decay, curve, graph, decrease, decline, reduction on white background vector. Exponential Decay Curve Graph editable stroke icon. Decrease line graph vectors Exponential Decay Curve Graph, icon in line design. Exponential, decay, curve, graph, decrease, decline, reduction on
Free with trial Statistic graph progress, financial profit growth, increase, and decrease line icons set. Infographic charts with arrows, circles, and bars thin black outline symbols vector illustration. Decrease line graph vectors Statistic graph progress, financial profit growth, increase and decrease line icons set. Statistic graph progress, financial profit growth, increase, and decrease line icons set. Infographic charts with arrows, circles, and bars thin black outline symbols vector illustration.
Free with trial Decrease bar graph icon on circle line. Market crash illustration concept. Decrease line graph vectors Decrease bar graph icon on circle line. Market crash concept. Decrease bar graph icon on circle line. Market crash illustration concept
Free with trial Statistic graph progress, financial profit growth, increase and decrease line icons set. Infographic charts with arrow, circles and bars thin black and red outline symbols vector illustration. Decrease line graph vectors Statistic graph progress, financial profit growth, increase and decrease line icons set
Free with trial A timeline with a line graph showing the gradual decrease in debt over time with the avalanche od.. Vector illustration. Decrease line graph vectors A timeline with a line graph showing the gradual decrease in debt over time with the avalanche od.. Vector illustration.
Free with trial Set line Factory Graph chart diagram Dollar symbol Arrow Pie infographic Financial growth increase decrease and icon. Vector. Decrease line graph vectors Set line Factory, Graph, chart, diagram, Dollar symbol, Arrow, Pie infographic, Financial growth increase, decrease and. Set line Factory Graph chart diagram Dollar symbol Arrow Pie infographic Financial growth increase decrease and icon. Vector.
Free with trial Set line Financial growth decrease, Document with graph chart, Cloud download and upload and Data analysis icon. Vector. Decrease line graph illustrations Set line Financial growth decrease, Document with graph chart, Cloud download and upload and Data analysis icon. Vector
Free with trial Set line Graph, chart, diagram, Pie infographic, Financial growth decrease and icon. Vector. Decrease line graph vectors Set line Graph, chart, diagram, Pie infographic, Financial growth decrease and icon. Vector
Free with trial Set line Old hourglass with sand, Graph, chart, diagram, Financial growth decrease and Factory. White rectangle button. Vector. Decrease line graph vectors Set line Old hourglass with sand, Graph, chart, diagram, Financial growth decrease and Factory. White rectangle button
Free with trial A minimalist, black and white graphic representing a downward trend. A thick, bold arrow points diagonally down and to the right, symbolizing a decline. Below it, a jagged, irregular line graph mirrors this downward trajectory, depicting volatility and a general decrease. This imagery is ideal for illustrating financial losses, market downturns, negative performance, or any concept of falling or decreasing values. Decrease line graph vectors Down Trend Arrow and Jagged Line Graph. A minimalist, black and white graphic representing a downward trend. A thick, bold arrow points diagonally down and to the right, symbolizing a decline. Below it, a jagged, irregular line graph mirrors this downward trajectory, depicting volatility and a general decrease. This imagery is ideal for illustrating financial losses, market downturns, negative performance, or any concept of falling or decreasing values.
Free with trial Currency crisis line icon with color money and down arrow graph. Vector economy crisis, financial stock prices decrease, cost reduction and bankruptcy, money loss and business recession outline symbol. Decrease line graph vectors Currency crisis line icon, money down arrow graph. Currency crisis line icon with color money and down arrow graph. Vector economy crisis, financial stock prices decrease, cost reduction and bankruptcy, money loss and business recession outline symbol
Free with trial Dec collapsing line graph illustration decrease drop, fall dip, plummet slide dec collapsing line graph. Decrease line graph illustrations Dec collapsing line graph
Free with trial Data melting line graph illustration trend analysis, visualization ice, decrease plot data melting line graph. Decrease line graph illustrations Data melting line graph
Free with trial Analysis spiraling line graph illustration curve plot, statistics diagram, increase decrease analysis spiraling line graph. Decrease line graph illustrations Analysis spiraling line graph
Free with trial Temperature melting line graph illustration data trend, analysis visualization, ice decrease temperature melting line graph. Decrease line graph illustrations Temperature melting line graph
Free with trial Analysis stretching line graph illustration chvisualization axis, points curve, increase decrease analysis stretching line graph. Decrease line graph illustrations Analysis stretching line graph
Free with trial Trend disintegrating line graph illustration dec decrease, fall analysis, visualization statistics trend disintegrating line graph. Decrease line graph illustrations Trend disintegrating line graph
Free with trial A simple line graph icon showing a downward trend with two arrows and the words "DECREASE DECLINE. Decrease line graph illustrations Downward Trend Graph Icon with Decrease Decline Text chart. A simple line graph icon showing a downward trend with two arrows and the words "DECREASE DECLINE
Free with trial Trend melting line graph illustration analysis visualization, ice decrease, plot statistics trend melting line graph. Decrease line graph illustrations Trend melting line graph
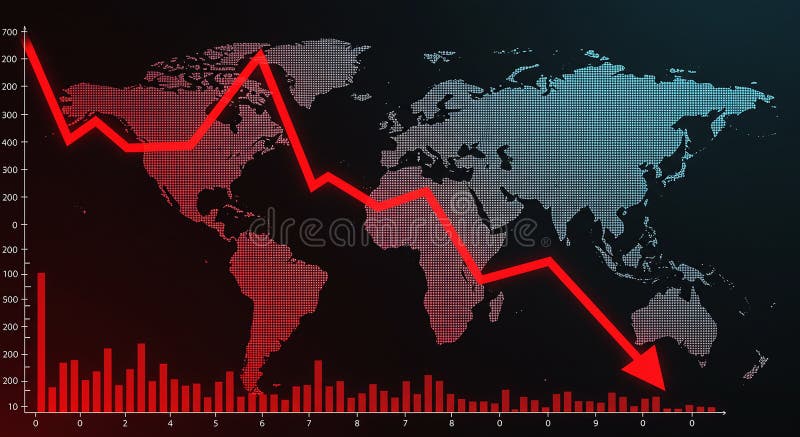
Free with trial World map with a red declining line graph overlay, illustrating a decrease or economic downturn. The graph features sharp declines across various data points, reflecting a downward trend. Red bar chart at the bottom represents additional numerical data against a black background. The map uses a dotted pattern for continents, highlighting regions globally. The image conveys financial analysis, market trends, or economic statistics. Decrease line graph illustrations World map with a red declining line graph overlay
Free with trial An illustration of a simple line graph showing a decline or decrease, accompanied by an exclamation mark inside a triangle, indicating a warning, danger or risk. Suitable for topics like financial loss, market crash, or economic downturn. Decrease line graph vectors Simple Line Decline Graph with Exclamation Mark Attention Icon Design. An illustration of a simple line graph showing a decline or decrease, accompanied by an exclamation mark inside a triangle, indicating a warning, danger or risk. Suitable for topics like financial loss, market crash, or economic downturn.
Free with trial A clear vector illustration of a line graph showing a downward trend. Represents financial decline, negative performance, market downturns, or decreasing metrics. Ideal for business reports, financial analysis, economic indicators, or risk assessment. It visually communicates a decrease or a challenging period, vector design Generative AI. Decrease line graph vectors Downtrend Line Graph Financial Market Decline, vector design Generative AI. A clear vector illustration of a line graph showing a downward trend. Represents financial decline, negative performance, market downturns, or decreasing metrics. Ideal for business reports, financial analysis, economic indicators, or risk assessment. It visually communicates a decrease or a challenging period, vector design Generative AI
Free with trial Set line Financial growth decrease, Hierarchy organogram chart, Graph, chart, diagram and Location. Gradient color icons. Vector. Decrease line graph vectors Set line Financial growth decrease, Hierarchy organogram chart, Graph, chart, diagram and Location. Gradient color icons
Free with trial A 3D red bar chart shows a declining trend against a white grid background. The bars decrease in height from left to right, with a red line graph following the downward trajectory. Decrease line graph illustrations Red 3 D bar chart with downward trend line on white grid background graph line graph. A 3D red bar chart shows a declining trend against a white grid background. The bars decrease in height from left to right, with a red line graph following the downward trajectory
Free with trial A black curved line graph showing a downward trend on a white background. Clear details and vibrant colors enh. Decrease line graph illustrations Black curved line graph showing decrease on white background chart decreasing. A black curved line graph showing a downward trend on a white background. Clear details and vibrant colors enh
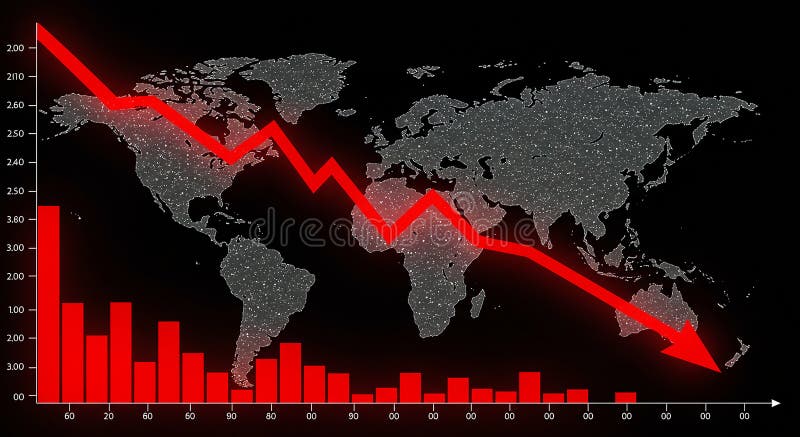
Free with trial World map backdrop with a downward-trending red line graph and red bar graph, set against a black background. The bar graph features various heights, indicating statistical data points, while the line graph suggests a decrease. The map includes continents like Africa, Europe, Asia, and the Americas, with numerous small white dots representing data or illumination. The dramatic red color emphasizes the negative trend, possibly symbolizing economic or market decline on a global scale. Decrease line graph illustrations World map backdrop with a downward-trending red line graph and red bar graph
Free with trial Isolated showing simple line graph showing downward trend on white background keywords: graph, chart, line graph, downward trend, decline, decrease. Decrease line graph illustrations Simple Line Graph Showing Downward Trend on White Background Keywords: graph, chart, line graph, downward trend
Free with trial A clear vector illustration of a declining line graph, symbolizing market downturn, economic challenges, and negative trends. Ideal for financial reports, business analysis, and risk assessment. Represents a decrease in performance and a need for strategic adjustments, vector design Generative AI. Decrease line graph vectors Declining Line Graph for Market Downturn and Economic Challenges, vector design Generative AI. A clear vector illustration of a declining line graph, symbolizing market downturn, economic challenges, and negative trends. Ideal for financial reports, business analysis, and risk assessment. Represents a decrease in performance and a need for strategic adjustments, vector design Generative AI
Free with trial A minimalist flat style vector illustration showing a downward sloping line graph in red. Represents decline, decrease, loss, or negative trends. Useful for financial reports, business presentations, analytics dashboards, or economic charts indicating reduction, vector design Generative AI. Decrease line graph vectors Flat style red line chart graph decline icon vector design Generative AI. A minimalist flat style vector illustration showing a downward sloping line graph in red. Represents decline, decrease, loss, or negative trends. Useful for financial reports, business presentations, analytics dashboards, or economic charts indicating reduction, vector design Generative AI
Free with trial A vector icon of a descending line graph on a green base, illustrating a downward trend, decrease, or decline in data. Represents financial loss, reduced performance, or negative growth. Suitable for business reports, statistical analysis, and economic presentations, vector design Generative AI. Decrease line graph vectors Descending Line Graph Decline Trend Chart Icon, vector design Generative AI. A vector icon of a descending line graph on a green base, illustrating a downward trend, decrease, or decline in data. Represents financial loss, reduced performance, or negative growth. Suitable for business reports, statistical analysis, and economic presentations, vector design Generative AI
Free with trial A vector graphic of a line graph showing a downward trend. Represents decrease, decline, loss, or negative performance. In automotive context, could symbolize falling sales, decreasing fuel efficiency, or a system performance drop. A clear visual for illustrating negative trends, vector design Generative AI. Decrease line graph vectors Downtrend graph icon, decrease decline loss symbol, vector design Generative AI. A vector graphic of a line graph showing a downward trend. Represents decrease, decline, loss, or negative performance. In automotive context, could symbolize falling sales, decreasing fuel efficiency, or a system performance drop. A clear visual for illustrating negative trends, vector design Generative AI
Free with trial A simple line graph icon showing a downward trend, representing statistics, data, or a decline in performance. Useful for financial reports, market analysis, or educational materials. Its clear visual direction conveys negative momentum or a decrease, vector design Generative AI. Decrease line graph vectors Downward Trend Line Graph Icon for Statistics and Data, vector design Generative AI. A simple line graph icon showing a downward trend, representing statistics, data, or a decline in performance. Useful for financial reports, market analysis, or educational materials. Its clear visual direction conveys negative momentum or a decrease, vector design Generative AI
Free with trial A flat vector icon showing a line graph with a distinct downward trend. Represents decline, decrease, negative growth, or falling performance. Suitable for business analysis, financial reports, or graphics illustrating negative progress or statistics, vector design Generative AI. Decrease line graph vectors Downward line graph icon representing negative trend decline, vector design Generative AI. A flat vector icon showing a line graph with a distinct downward trend. Represents decline, decrease, negative growth, or falling performance. Suitable for business analysis, financial reports, or graphics illustrating negative progress or statistics, vector design Generative AI
Free with trial Simple line graph illustrating a negative trend, representing a decrease or decline in data. Perfect for presentations, reports, or website design. Decrease line graph vectors Downward Trending Line Graph, Showing Negative Growth or Decline. Simple line graph illustrating a negative trend, representing a decrease or decline in data. Perfect for presentations, reports, or website design.
Free with trial Neon graph with a blue zigzag line sharply descending from left to right, depicting a decline. The horizontal and vertical axes are in bright green, forming a right angle. The arrow points downward at the graph's end, emphasizing the decrease. The setup is on a black background, making the neon colors vivid and clear. Decrease line graph illustrations Neon graph arrow going down showing decrease. Neon graph with a blue zigzag line sharply descending from left to right, depicting a decline. The horizontal and vertical axes are in bright green, forming a right angle. The arrow points downward at the graph's end, emphasizing the decrease. The setup is on a black background, making the neon colors vivid and clear.
Free with trial Business graph data in a bar chart showing increase and decrease with blue line illustration on plain background. Decrease line graph vectors Business graph data in a bar chart showing increase and decrease with blue line illustration on plain background
Free with trial Trend melting line graph illustration analysis visualization, ice decrease, plot statistics trend melting line graph. Decrease line graph illustrations Trend melting line graph
Free with trial A digital illustration of a black rectangular device with a dark blue background features a blue line graph on its screen, where an orange arrow points downward to indicate a decrease in frequency, with the x-axis representing time and the y-axis showing frequency, creating a visually striking and modern design for technology and data analysis concepts. Decrease line graph illustrations Digital device displaying a blue line graph with orange arrow on dark background. A digital illustration of a black rectangular device with a dark blue background features a blue line graph on its screen, where an orange arrow points downward to indicate a decrease in frequency, with the x-axis representing time and the y-axis showing frequency, creating a visually striking and modern design for technology and data analysis concepts
Free with trial Graph growth with arrow up and reduction with arrow down, line chart icon. Financial invest, fall, increase and decrease. Statistics and analytics. Vector flat illustration. Decrease line graph vectors Graph growth with arrow up and reduction with arrow down, line chart icon. Financial invest, fall, increase and decrease
Free with trial This minimalist vector illustration depicts a retail store icon integrated into a shopping cart, positioned against a declining line graph. The visual metaphor highlights a negative economic trend or a decrease in consumer activity. The color palette uses muted tones with a bold red accent to emphasize the downward trajectory of the market performance. Decrease line graph vectors A line graph showing a downward trend for a retail business concept. This minimalist vector illustration depicts a retail store icon integrated into a shopping. This minimalist vector illustration depicts a retail store icon integrated into a shopping cart, positioned against a declining line graph. The visual metaphor highlights a negative economic trend or a decrease in consumer activity. The color palette uses muted tones with a bold red accent to emphasize the downward trajectory of the market performance
Free with trial Depreciation color line icon with decline bar graph and percent vector symbol. Inflation, economic crisis, business and finance recession, money loss and bankruptcy outline sign with decrease chart. Decrease line graph vectors Depreciation color line icon with decline graph. Depreciation color line icon with decline bar graph and percent vector symbol. Inflation, economic crisis, business and finance recession, money loss and bankruptcy outline sign with decrease chart
Free with trial A minimalist 3D rendered white graph depicting a sharp downward trend with jagged peaks and valleys. The graph is isolated on a white background, casting a subtle shadow. The visual represents a decline or decrease, suitable for concepts related to finance, economics, or data analysis. Decrease line graph illustrations White 3D Jagged Line Graph Showing Decline Isolated on White Background chart decrease. A minimalist 3D rendered white graph depicting a sharp downward trend with jagged peaks and valleys. The graph is isolated on a white background, casting a subtle shadow. The visual represents a decline or decrease, suitable for concepts related to finance, economics, or data analysis
Free with trial A two-toned zigzag line graph against a white background. The line starts in red, descending from the top left, and transitions to green around the midway point, continuing downward. This design symbolizes a decline, often used in financial or performance metrics to indicate a decrease. The red section suggests loss or negative performance, while the green section might imply a potential recovery or different segment in charting data analysis. The photo is generated using Ai. Decrease line graph illustrations Two-toned zigzag line graph against a white background.
Free with trial A critical flat vector icon showing a downward trending line graph, symbolizing business decline, negative statistics, and falling values. Essential for financial warnings, market analysis, risk assessment, or performance reviews. It clearly visualizes a decrease in metrics and potential challenges, vector design Generative AI. Decrease line graph vectors Downward Trending Line Graph Icon for Business Decline, vector design Generative AI. A critical flat vector icon showing a downward trending line graph, symbolizing business decline, negative statistics, and falling values. Essential for financial warnings, market analysis, risk assessment, or performance reviews. It clearly visualizes a decrease in metrics and potential challenges, vector design Generative AI
Free with trial This somber and contemplative black and white illustration depicts an old, worn, and slightly yellowed open book with a cross positioned centrally on its page, flanked by a detailed map of the world on the right side and a line graph showing a distinct downward trend on the left, symbolizing decrease or loss, all rendered with a sense of depth and dimension against a plain grey background. Decrease line graph illustrations A black and white illustration of an old open book with a cross on top, featuring a world map and a declining line graph on its. This somber and contemplative black and white illustration depicts an old, worn, and slightly yellowed open book with a cross positioned centrally on its page, flanked by a detailed map of the world on the right side and a line graph showing a distinct downward trend on the left, symbolizing decrease or loss, all rendered with a sense of depth and dimension against a plain grey background
Free with trial Decline investment color line icon. Vector graph of cost reduction and financial decrease with down red arrow and money. Economy, business, finance crisis, stock market crash, bankruptcy outline sign. Decrease line graph vectors Decline investment arrow graph color line icon. Decline investment color line icon. Vector graph of cost reduction and financial decrease with down red arrow and money. Economy, business, finance crisis, stock market crash, bankruptcy outline sign
Free with trial Outline vector icon of a line graph showing a downward trend in line art. Represents decrease, loss, decline, or negative performance data. Suitable for financial charts, reports, data visualization, and illustrating negative changes over time, vector design Generative AI. Decrease line graph vectors Line Graph Downward Trend Outline, Decline Loss Chart Symbol, vector design Generative AI. Outline vector icon of a line graph showing a downward trend in line art. Represents decrease, loss, decline, or negative performance data. Suitable for financial charts, reports, data visualization, and illustrating negative changes over time, vector design Generative AI
Free with trial A graph displaying a red line that trends downward, indicating a decline or decrease, set against a grid patterned background. Decrease line graph illustrations Graph showing a downward trend with a red line on a grid background. A graph displaying a red line that trends downward, indicating a decline or decrease, set against a grid patterned background
Free with trial Decline investment color line icon. Vector graph of cost reduction and financial decrease with down red arrow and money. Economy, business, finance crisis, stock market crash, bankruptcy outline sign. Decrease line graph illustrations Decline investment arrow graph color line icon. Decline investment color line icon. Vector graph of cost reduction and financial decrease with down red arrow and money. Economy, business, finance crisis, stock market crash, bankruptcy outline sign
Free with trial A conceptual black and white line graph depicting economic recession trends is presented on a piece of torn and crumpled paper with a worn, aged texture, featuring a hand-drawn sketch-like style with three distinct lines representing different time periods where the first line shows a sharp downward trend, the second line indicates an upward trend suggesting economic decrease, and the third line. Decrease line graph illustrations A black and white line graph on torn crumpled paper illustrating economic recession trends with downward and upward indicators. A conceptual black and white line graph depicting economic recession trends is presented on a piece of torn and crumpled paper with a worn, aged texture, featuring a hand-drawn sketch-like style with three distinct lines representing different time periods where the first line shows a sharp downward trend, the second line indicates an upward trend suggesting economic decrease, and the third line
Free with trial The image displays a graph with a red line trending downward, suggesting a decrease or decline in the represented data over a period of time. The background of the graph is gray with a grid pattern, and the red line has fluctuations but overall points downwards, ending with a red arrowhead at the bottom right. Decrease line graph illustrations A graph showing a downward trend with a red line indicating decline over time. The image displays a graph with a red line trending downward, suggesting a decrease or decline in the represented data over a period of time. The background of the graph is gray with a grid pattern, and the red line has fluctuations but overall points downwards, ending with a red arrowhead at the bottom right
Free with trial A line graph tracking the decline in crop yields for a particular region accompanied by a timeline of significant environmental events that may have contributed to the decrease.. Vector. Decrease line graph vectors A line graph tracking the decline in crop yields for a particular region accompanied by a timeline of significant
Free with trial Black silhouette of a jagged line graph showing a decrease over time on a white background. Decrease line graph illustrations Black silhouette of a jagged line graph decreasing over time chart economics. Black silhouette of a jagged line graph showing a decrease over time on a white background
Free with trial The image displays a red line graph trending downward on a white graph paper background with a grid pattern, indicating a decline or decrease in the data being represented. Decrease line graph illustrations Graph showing a sharp decline in a red line on a white graph paper background with grid pattern. The image displays a red line graph trending downward on a white graph paper background with a grid pattern, indicating a decline or decrease in the data being represented
Free with trial Isolated showing simple line graph showing a downward trend on white background keywords: graph, chart, line, trend, data, decline, decrease. Decrease line graph illustrations Simple line graph showing a downward trend on white background Keywords: graph, chart, line, trend, data, decline
Free with trial A line graph shows a steady increase in sales over the past five years while a corresponding bar graph demonstrates the decrease in operating expenses during the same period.. Vector. Decrease line graph illustrations A line graph shows a steady increase in sales over the past five years while a corresponding bar graph demonstrates the
Free with trial Chart bars down, icon in line design. Chart, bars, down, decrease, drop, decline, graph on white background vector. Chart bars down editable stroke icon. Decrease line graph vectors Chart bars down, icon in line design. Chart, bars, down, decrease, drop, decline, graph on white background vector