Free with trial Neon sign depicts a downward-sloping line graph with a descending arrow, symbolizing a decrease or loss. The graph is outlined in bright white and orange neon against a black background, creating a stark, eye-catching contrast. The zigzag line moves downward from left to right, suggesting a trend of decline. Decrease line graph illustrations Neon graph arrow going down showing decrease and loss. Neon sign depicts a downward-sloping line graph with a descending arrow, symbolizing a decrease or loss. The graph is outlined in bright white and orange neon against a black background, creating a stark, eye-catching contrast. The zigzag line moves downward from left to right, suggesting a trend of decline.
Free with trial Analytics graph line icon. Continuous line big heart. Column chart sign. Growth diagram symbol. 3d hearts in heart shaped loop. Analytics graph single line ribbon. Loop curve pattern. Vector. Decrease line graph vectors Analytics graph line icon. Column chart sign. Continuous line big heart. Vector. Analytics graph line icon. Continuous line big heart. Column chart sign. Growth diagram symbol. 3d hearts in heart shaped loop. Analytics graph single line ribbon. Loop curve pattern. Vector
Free with trial Up and down graph chart icon. Growth increase and decrease sign. Graph or diagram with arrow going up and down. Vector illustration. Decrease line graph illustrations Up and down graph chart icon. Growth increase and decrease sign. Graph or diagram with arrow going up and down. Vector
Free with trial A line graph with a decreasing trend is commonly used to depict scenarios like declining sales, decreasing stock prices, or any situation where a decrease in values over time or across categories is a significant aspect of the data. It provides a clear and intuitive way to understand trends and make informed interpretations about the decreasing values being represented. Decrease line graph illustrations Chart with decreasing line graph. A line graph with a decreasing trend is commonly used to depict scenarios like declining sales, decreasing stock prices, or any situation where a decrease in values over time or across categories is a significant aspect of the data. It provides a clear and intuitive way to understand trends and make informed interpretations about the decreasing values being represented.
Free with trial A simple line graph illustration showing fluctuations and an upward trend. The graph is drawn on a grid with a black line and red data points, indicating a period of increase, followed by a decrease, and then a final increase. This image can be used to represent business trends, financial analysis, stock market data, or any data that shows changes over time. Decrease line graph vectors Line Graph with Fluctuations. A simple line graph illustration showing fluctuations and an upward trend. The graph is drawn on a grid with a black line and red data points, indicating a period of increase, followed by a decrease, and then a final increase. This image can be used to represent business trends, financial analysis, stock market data, or any data that shows changes over time.
Free with trial Data disintegrating line graph illustration trend dec, decrease fall, analysis visualization data disintegrating line graph. Decrease line graph illustrations Data disintegrating line graph
Free with trial A graph with a red line and a green line. This could represent a decrease in one variable and an increase in another. Decrease line graph illustrations A graph with a red line and a green line
Free with trial This minimalist vector illustration features two identical line graphs, presented in contrasting black and white themes. The left graph displays a black line on a white background, while the right shows a white line on a black background. Both graphs depict a clear downward trend with jagged fluctuations, symbolizing decline, loss, or negative growth over time. This versatile icon set is ideal for illustrating concepts such as economic downturns, financial losses, market crashes, business failures, or any data showing a significant decrease. Perfect for presentations, reports, infographics, and web design. Decrease line graph vectors Declining Line Graph Icon Set - Black and White. This minimalist vector illustration features two identical line graphs, presented in contrasting black and white themes. The left graph displays a black line on a white background, while the right shows a white line on a black background. Both graphs depict a clear downward trend with jagged fluctuations, symbolizing decline, loss, or negative growth over time. This versatile icon set is ideal for illustrating concepts such as economic downturns, financial losses, market crashes, business failures, or any data showing a significant decrease. Perfect for presentations, reports, infographics, and web design.
Free with trial A bold black line graph icon showing a downward trend with an arrow. Symbolizes financial downturn, sales decrease, or negative performance metrics. Clear visual for business reports and data analysis indicating a decline value. vector design Generative AI. Decrease line graph vectors Bold Decreasing Line Graph Icon Financial Downturn Data vector design Generative AI. A bold black line graph icon showing a downward trend with an arrow. Symbolizes financial downturn, sales decrease, or negative performance metrics. Clear visual for business reports and data analysis indicating a decline value. vector design Generative AI
Free with trial A simple yet impactful vector illustration of an orange line graph showing a downward trend, representing a decrease or negative performance. This graphic is perfect for financial dashboards, stock market analysis, business presentations, or statistical reports. It clearly conveys declining metrics and critical data points, vector design Generative AI. Decrease line graph vectors Orange Decreasing Line Graph Vector. Financial Market Drop Graphic, vector design Generative AI. A simple yet impactful vector illustration of an orange line graph showing a downward trend, representing a decrease or negative performance. This graphic is perfect for financial dashboards, stock market analysis, business presentations, or statistical reports. It clearly conveys declining metrics and critical data points, vector design Generative AI
Free with trial Steep downward trending line graph red arrow decrease devaluation Can be customized to fit various themes and styles. Decrease line graph illustrations Steep downward trending line graph, red arrow , decrease, devaluation. Steep downward trending line graph red arrow decrease devaluation Can be customized to fit various themes and styles
Free with trial A clear vector illustration of a red downward trending line graph, symbolizing a decrease, decline, or negative performance. This icon is essential for financial reports, business presentations, data visualization, or any context indicating a reduction. Its simple, sharp design effectively communicates a downward trend in various metrics, vector design Generative AI. Decrease line graph vectors Red Downward Trending Graph Line Icon, vector design Generative AI. A clear vector illustration of a red downward trending line graph, symbolizing a decrease, decline, or negative performance. This icon is essential for financial reports, business presentations, data visualization, or any context indicating a reduction. Its simple, sharp design effectively communicates a downward trend in various metrics, vector design Generative AI
Free with trial This image features a striking red neon-style line graph on a black background, symbolizing decline, decrease, or downward trend in data visualization. Ideal for business, finance, and analytics concepts, it visually represents performance drops or negative growth in a modern, eye-catching manner. Decrease line graph illustrations Red Neon Declining Graph Line Icon for Business Data Visualization. This image features a striking red neon-style line graph on a black background, symbolizing decline, decrease, or downward trend in data visualization. Ideal for business, finance, and analytics concepts, it visually represents performance drops or negative growth in a modern, eye-catching manner.
Free with trial A vector icon of a line graph showing a downward trend with a red arrow. Represents decline, loss, negative performance, or decreasing statistics. Useful for financial reports, business analytics, or illustrating unfavorable trends. Clear visual for decrease, vector design Generative AI. Decrease line graph vectors Downward Trend Line Graph Vector Icon for Decline Loss, vector design Generative AI. A vector icon of a line graph showing a downward trend with a red arrow. Represents decline, loss, negative performance, or decreasing statistics. Useful for financial reports, business analytics, or illustrating unfavorable trends. Clear visual for decrease, vector design Generative AI
Free with trial A blue line graph displays a sharp decrease in data points, isolated on a clean white background. Decrease line graph illustrations Line graph showing a steep decline in values over time isolated on white background. A blue line graph displays a sharp decrease in data points, isolated on a clean white background
Free with trial A stark pink line graph shows a dramatic downward trend against a dark green grid, symbolizing a significant loss or decrease. Decrease line graph illustrations Sharp decline illustrated by a jagged pink line graph on a dark green grid background. A stark pink line graph shows a dramatic downward trend against a dark green grid, symbolizing a significant loss or decrease
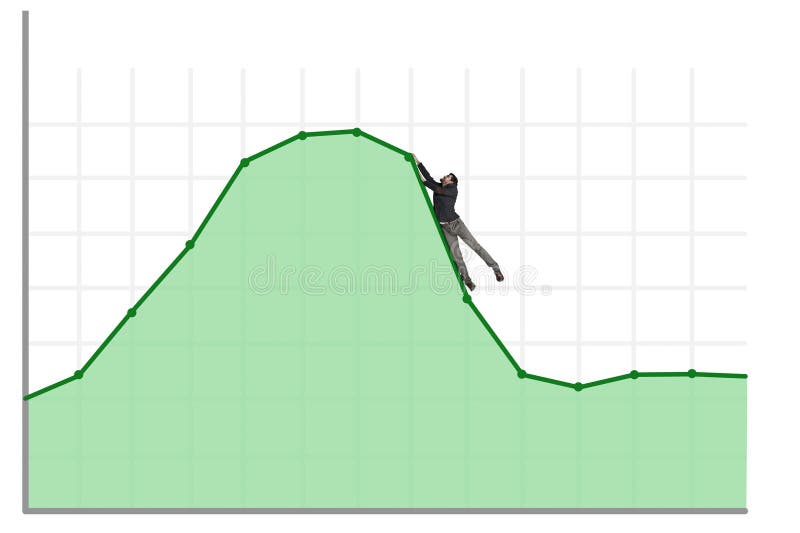
Free with trial Man, crypto price or line graph decrease in studio, stock market broker or financial loss on white background. Illustration, current economy trend or value drop of currency for interest rate risk. Decrease line graph illustrations Man, crypto price or line graph decrease in studio, stock market broker or financial loss on white background
Free with trial Set line Graph chart infographic Server Data Browser window Financial growth decrease Laptop with browser Cloud technology data transfer and Secure your site HTTPS SSL icon. Vector. Decrease line graph illustrations Set line Graph chart infographic, Server, Data, Browser window, Financial growth decrease, Laptop with browser, Cloud. Set line Graph chart infographic Server Data Browser window Financial growth decrease Laptop with browser Cloud technology data transfer and Secure your site HTTPS SSL icon. Vector.
Free with trial Set line Financial growth decrease Arrow Pie chart infographic Many ways directional arrow Pyramid infographics and Graph chart diagram icon. Vector. Decrease line graph illustrations Set line Financial growth decrease, Arrow, Pie chart infographic, Many ways directional arrow, Pyramid infographics, and. Set line Financial growth decrease Arrow Pie chart infographic Many ways directional arrow Pyramid infographics and Graph chart diagram icon. Vector.
Free with trial This image shows a bar graph with a downward trending line and a dollar sign. It represents financial loss, economic downturn, or a decrease in market value. Decrease line graph vectors Vector art of a bar graph with a downward trending line and a dollar sign, representing financial loss or economic downturn. This image shows a bar graph with a downward trending line and a dollar sign. It represents financial loss, economic downturn, or a decrease in market value
Free with trial Red glowing line graph shows market decline. Bar chart bars decrease, indicating falling sales, revenue loss. Financial report chart displays economic crisis, business downturn tech. Decrease line graph illustrations Red glowing line graph shows market decline. Bar chart bars decrease, indicating falling sales, revenue loss. Financial report
Free with trial A detailed line graph visualization titled Global Climate Trends presents annual data from 2011 through 2013, plotting precipitation levels and CO2 emissions on the y-axis against years on the x-axis, where a blue line indicates a steady increase in precipitation over time, a green line shows corresponding CO2 levels, and a separate green trend line suggests a potential decrease in another. Decrease line graph illustrations A line graph showing global climate trends from 2011 to 2013 with precipitation and CO2 levels visualized in blue and green. A detailed line graph visualization titled Global Climate Trends presents annual data from 2011 through 2013, plotting precipitation levels and CO2 emissions on the y-axis against years on the x-axis, where a blue line indicates a steady increase in precipitation over time, a green line shows corresponding CO2 levels, and a separate green trend line suggests a potential decrease in another
Free with trial Set line Arrow Pie chart infographic Graph chart diagram Wrench and gear Pyramid infographics Financial growth decrease Flag and Factory icon. Vector. Decrease line graph vectors Set line Arrow, Pie chart infographic, Graph, chart, diagram, Wrench and gear, Pyramid infographics, Financial growth. Set line Arrow Pie chart infographic Graph chart diagram Wrench and gear Pyramid infographics Financial growth decrease Flag and Factory icon. Vector.
Free with trial Stock and economic crisis graph background. Trade exchange, financial decrease, bed business strategy, digital asset, loss investment fund, online broker, stock collapse and crisis concept. Decrease line graph vectors Stock and economic crisis graph background. Trade exchange, financial decrease
Free with trial Stock and economic crisis graph background. Trade exchange, financial decrease, bed business strategy, digital asset, loss investment fund, online broker, stock collapse and crisis concept. Decrease line graph illustrations Stock and economic crisis graph background. Trade exchange, financial decrease
Free with trial Decline graph line outline icon isolated on white. Vector illustration. Decrease line graph vectors Decline graph line outline icon
Free with trial Stock and economic crisis graph background. Trade exchange, financial decrease, bed business strategy, digital asset, loss investment fund, online broker, stock collapse and crisis concept. Decrease line graph illustrations Stock and economic crisis graph background. Trade exchange, financial decrease
Free with trial Continuous one line art down graph chart icon flat style design isolated vector illustration on white background. Decrease line graph vectors Continuous one line art down graph chart icon flat style
Free with trial Graph and diagram from planes with decrease. Finance and business concepts. Vector Illustration isolated. Decrease line graph vectors Graph and diagram from planes with decrease. Finance and business concepts. Vector Illustration
Free with trial Falling graph with downward bars and arrow icon set. Line and outline, solid vector icon. Editable stroke finance sign and market symbol. Decrease line graph vectors Graph down vector icon set in line and solid style. Falling graph with downward bars and arrow icon set. Line and outline, solid vector icon. Editable stroke. Falling graph with downward bars and arrow icon set. Line and outline, solid vector icon. Editable stroke finance sign and market symbol.
Free with trial Downward Bar Graph Line Icon, Decline or Loss Vector. Decrease line graph vectors Downward Bar Graph Line Icon
Free with trial Bar graph with varying heights beside a line chart with rising and falling pattern on a grid. Ideal for business analysis, statistics, metrics, trends, presentation, infographics, simple flat. Decrease line graph illustrations Data Visualization with Bar Graph and Line Chart in Minimalist Design. Bar graph with varying heights beside a line chart with rising and falling pattern on a grid. Ideal for business analysis, statistics, metrics, trends, presentation, infographics, simple flat
Free with trial Abstract Graph Decrease Badge And Label Collection, vector editable design, can be used for business or presentation design. Decrease line graph vectors Abstract Graph Decrease Badge And Label Collection
Free with trial Abstract Graph Decrease Silhouette Illustration, vector editable design, can be used for business or presentation design. Decrease line graph vectors Abstract Graph Decrease Silhouette Illustration
Free with trial Graph line icon. Continuous line big heart. Column chart sign. Growth diagram symbol. 3d hearts in heart shaped loop. Graph chart single line ribbon. Loop curve pattern. Vector. Decrease line graph vectors Graph line icon. Column chart sign. Continuous line big heart. Vector. Graph line icon. Continuous line big heart. Column chart sign. Growth diagram symbol. 3d hearts in heart shaped loop. Graph chart single line ribbon. Loop curve pattern. Vector
Free with trial Graph line icon. Continuous line with share plane. Column chart sign. Growth diagram symbol. 3d heart in speech bubble. Graph chart single line ribbon. Loop curve pattern. Vector. Decrease line graph vectors Graph line icon. Column chart sign. Continuous line with plane. Vector. Graph line icon. Continuous line with share plane. Column chart sign. Growth diagram symbol. 3d heart in speech bubble. Graph chart single line ribbon. Loop curve pattern. Vector
Free with trial Graph line icon. Continuous line with share plane. Column chart sign. Ab test diagram symbol. 3d star in speech bubble. Graph chart single line ribbon. Loop curve pattern. Vector. Decrease line graph vectors Graph line icon. Column chart sign. Continuous line with plane. Vector. Graph line icon. Continuous line with share plane. Column chart sign. Ab test diagram symbol. 3d star in speech bubble. Graph chart single line ribbon. Loop curve pattern. Vector
Free with trial Declining Business Line Graph Icon Set vol 32485. Decrease line graph vectors Declining Business Line Graph Icon Set
Free with trial Graph line icon. Halftone dotted pattern. Gradient icon with grain shadow. Column chart sign. Growth diagram symbol. Line graph chart icon. Various designs. Vector. Decrease line graph vectors Graph line icon. Column chart sign. Halftone dotted pattern. Vector. Graph line icon. Halftone dotted pattern. Gradient icon with grain shadow. Column chart sign. Growth diagram symbol. Line graph chart icon. Various designs. Vector
Free with trial Graph line icon. Halftone dotted pattern. Gradient icon with grain shadow. Column chart sign. Growth diagram symbol. Line graph chart icon. Various designs. Vector. Decrease line graph vectors Graph line icon. Column chart sign. Halftone dotted pattern. Vector. Graph line icon. Halftone dotted pattern. Gradient icon with grain shadow. Column chart sign. Growth diagram symbol. Line graph chart icon. Various designs. Vector
Free with trial Web report line icon. Neumorphic, Flat shadow, 3d buttons. Column graph sign. Growth diagram symbol. Line web report icon. Social media icons. Vector. Decrease line graph illustrations Web report line icon. Column graph sign. Neumorphic buttons. Vector. Web report line icon. Neumorphic, Flat shadow, 3d buttons. Column graph sign. Growth diagram symbol. Line web report icon. Social media icons. Vector
Free with trial Downward Trend Line Graph Icons for Financial Data vol 34820. Decrease line graph vectors Downward Trend Line Graph Icons for Financial Data
Free with trial Line graph illustrating data analysis and business statistics, charting financial growth, market changes, and performance metrics for visual information and infographic content. Decrease line graph illustrations Analyzing data with line graph showing business trends. Line graph illustrating data analysis and business statistics, charting financial growth, market changes, and performance metrics for visual information and infographic content
Free with trial Graph laptop line icon. Neumorphic, Flat shadow, 3d buttons. Column chart sign. Growth diagram symbol. Line graph laptop icon. Social media icons. Vector. Decrease line graph illustrations Graph laptop line icon. Column chart sign. Neumorphic buttons. Vector. Graph laptop line icon. Neumorphic, Flat shadow, 3d buttons. Column chart sign. Growth diagram symbol. Line graph laptop icon. Social media icons. Vector
Free with trial Decrease bar chart icon on circle line. Statistic sign symbol illustration. Decrease line graph vectors Decrease bar chart icon on circle line. Statistic sign symbol
Free with trial Calendar graph line icon. Neumorphic, Flat shadow, 3d buttons. Column chart sign. Growth diagram symbol. Line calendar graph icon. Social media icons. Vector. Decrease line graph vectors Calendar graph line icon. Column chart sign. Neumorphic buttons. Vector. Calendar graph line icon. Neumorphic, Flat shadow, 3d buttons. Column chart sign. Growth diagram symbol. Line calendar graph icon. Social media icons. Vector
Free with trial Pie chart line icon. Neumorphic, Flat shadow, 3d buttons. Presentation graph sign. Market analytics symbol. Line pie chart icon. Social media icons. Vector. Decrease line graph vectors Pie chart line icon. Presentation graph sign. Neumorphic buttons. Vector. Pie chart line icon. Neumorphic, Flat shadow, 3d buttons. Presentation graph sign. Market analytics symbol. Line pie chart icon. Social media icons. Vector
Free with trial Web report line icon. Halftone dotted pattern. Gradient icon with grain shadow. Column graph sign. Growth diagram symbol. Line web report icon. Various designs. Vector. Decrease line graph illustrations Web report line icon. Column graph sign. Halftone dotted pattern. Vector. Web report line icon. Halftone dotted pattern. Gradient icon with grain shadow. Column graph sign. Growth diagram symbol. Line web report icon. Various designs. Vector
Free with trial Pie chart line icon. Neumorphic, Flat shadow, 3d buttons. Presentation graph sign. Market analytics symbol. Line pie chart icon. Social media icons. Vector. Decrease line graph vectors Pie chart line icon. Presentation graph sign. Neumorphic buttons. Vector. Pie chart line icon. Neumorphic, Flat shadow, 3d buttons. Presentation graph sign. Market analytics symbol. Line pie chart icon. Social media icons. Vector
Free with trial Report document line icon. Neumorphic, Flat shadow, 3d buttons. Column graph sign. Growth diagram, pie chart symbol. Line report document icon. Social media icons. Vector. Decrease line graph vectors Report document line icon. Column graph sign. Neumorphic buttons. Vector. Report document line icon. Neumorphic, Flat shadow, 3d buttons. Column graph sign. Growth diagram, pie chart symbol. Line report document icon. Social media icons. Vector
Free with trial Statistics line icon. Neumorphic, Flat shadow, 3d buttons. Column chart sign. Growth graph diagram symbol. Line graph chart icon. Social media icons. Vector. Decrease line graph vectors Statistics line icon. Column graph chart sign. Neumorphic buttons. Vector. Statistics line icon. Neumorphic, Flat shadow, 3d buttons. Column chart sign. Growth graph diagram symbol. Line graph chart icon. Social media icons. Vector
Free with trial Growth chart line icon. Halftone dotted pattern. Gradient icon with grain shadow. Column graph sign. Market analytics symbol. Line growth chart icon. Various designs. Vector. Decrease line graph vectors Growth chart line icon. Column graph sign. Halftone dotted pattern. Vector. Growth chart line icon. Halftone dotted pattern. Gradient icon with grain shadow. Column graph sign. Market analytics symbol. Line growth chart icon. Various designs. Vector
Free with trial Growth chart line icon. Halftone dotted pattern. Gradient icon with grain shadow. Column graph sign. Market analytics symbol. Line growth chart icon. Various designs. Vector. Decrease line graph illustrations Growth chart line icon. Column graph sign. Halftone dotted pattern. Vector. Growth chart line icon. Halftone dotted pattern. Gradient icon with grain shadow. Column graph sign. Market analytics symbol. Line growth chart icon. Various designs. Vector
Free with trial Graph line icon. Continuous line big heart. Column chart sign. Growth diagram symbol. 3d hearts in heart shaped loop. Graph chart single line ribbon. Loop curve pattern. Vector. Decrease line graph vectors Graph line icon. Column chart sign. Continuous line big heart. Vector. Graph line icon. Continuous line big heart. Column chart sign. Growth diagram symbol. 3d hearts in heart shaped loop. Graph chart single line ribbon. Loop curve pattern. Vector
Free with trial Economic downturn, financial stress, investment failure, business loss, market decline, risk. Line graph shows downward trend. Financial stress and economic downturn. Decrease line graph illustrations Financial Loss Concept with Declining Line Graph, Sad Face, and Coin Symbol. Economic downturn, financial stress, investment failure, business loss, market decline, risk. Line graph shows downward trend. Financial stress and economic downturn
Free with trial Diagram graph line icon. Halftone dotted pattern. Gradient icon with grain shadow. Column chart sign. Market analytics symbol. Line diagram graph icon. Various designs. Vector. Decrease line graph vectors Diagram graph line icon. Column chart sign. Halftone dotted pattern. Vector. Diagram graph line icon. Halftone dotted pattern. Gradient icon with grain shadow. Column chart sign. Market analytics symbol. Line diagram graph icon. Various designs. Vector
Free with trial Pie chart line icon. Continuous line with share plane. Presentation graph sign. Market analytics symbol. 3d heart in speech bubble. Pie chart single line ribbon. Loop curve pattern. Vector. Decrease line graph vectors Pie chart line icon. Presentation graph sign. Continuous line with plane. Vector. Pie chart line icon. Continuous line with share plane. Presentation graph sign. Market analytics symbol. 3d heart in speech bubble. Pie chart single line ribbon. Loop curve pattern. Vector
Free with trial Analytics graph line icon. Continuous line with share plane. Column chart sign. Growth diagram symbol. Hearts rate review in speech bubble. Analytics graph single line ribbon. Vector. Decrease line graph illustrations Analytics graph line icon. Column chart sign. Continuous line with plane. Vector. Analytics graph line icon. Continuous line with share plane. Column chart sign. Growth diagram symbol. Hearts rate review in speech bubble. Analytics graph single line ribbon. Vector
Free with trial Presentation board line icon. Neumorphic, Flat shadow, 3d buttons. Column graph sign. Growth diagram symbol. Line presentation board icon. Social media icons. Vector. Decrease line graph vectors Presentation board line icon. Column graph sign. Neumorphic buttons. Vector. Presentation board line icon. Neumorphic, Flat shadow, 3d buttons. Column graph sign. Growth diagram symbol. Line presentation board icon. Social media icons. Vector
Free with trial Up and down graph chart icon. Growth increase and decrease sign. Graph or diagram with arrow going up and down. Vector illustration. Decrease line graph vectors Up and down graph chart icon. Growth increase and decrease sign. Graph or diagram with arrow going up and down. Vector
Free with trial Candlestick chart line icon. Neumorphic, Flat shadow, 3d buttons. Analytics graph sign. Market analytics symbol. Line candlestick chart icon. Social media icons. Vector. Decrease line graph vectors Candlestick chart line icon. Analytics graph sign. Neumorphic buttons. Vector. Candlestick chart line icon. Neumorphic, Flat shadow, 3d buttons. Analytics graph sign. Market analytics symbol. Line candlestick chart icon. Social media icons. Vector
Free with trial Analytics graph line icon. Halftone dotted pattern. Gradient icon with grain shadow. Column chart sign. Growth diagram symbol. Line analytics graph icon. Various designs. Vector. Decrease line graph vectors Analytics graph line icon. Column chart sign. Halftone dotted pattern. Vector. Analytics graph line icon. Halftone dotted pattern. Gradient icon with grain shadow. Column chart sign. Growth diagram symbol. Line analytics graph icon. Various designs. Vector
Free with trial Pie chart line icon. Halftone dotted pattern. Gradient icon with grain shadow. Presentation graph sign. Market analytics symbol. Line pie chart icon. Various designs. Vector. Decrease line graph vectors Pie chart line icon. Presentation graph sign. Halftone dotted pattern. Vector. Pie chart line icon. Halftone dotted pattern. Gradient icon with grain shadow. Presentation graph sign. Market analytics symbol. Line pie chart icon. Various designs. Vector
Free with trial Report statistics line icon. Continuous line with share plane. Column graph sign. Growth diagram symbol. Five star rate review in speech bubble. Report statistics single line ribbon. Vector. Decrease line graph illustrations Report statistics line icon. Column graph sign. Continuous line with plane. Vector. Report statistics line icon. Continuous line with share plane. Column graph sign. Growth diagram symbol. Five star rate review in speech bubble. Report statistics single line ribbon. Vector
Free with trial Report line icon. Halftone dotted pattern. Gradient icon with grain shadow. Column graph, pie chart sign. Market analytics symbol. Line report icon. Various designs. Vector. Decrease line graph vectors Report line icon. Column graph, pie chart sign. Halftone dotted pattern. Vector. Report line icon. Halftone dotted pattern. Gradient icon with grain shadow. Column graph, pie chart sign. Market analytics symbol. Line report icon. Various designs. Vector
Free with trial Minimalist style gradient blue diagram showing downward trend line graph on black background representing economic decline or loss. Decrease line graph vectors Downward trend line graph on black background for infographic. Minimalist style gradient blue diagram showing downward trend line graph on black background representing economic decline or loss.
Free with trial Decreasing graph line icon. Halftone dotted pattern. Gradient icon with grain shadow. Column chart sign. Market analytics symbol. Line decreasing graph icon. Various designs. Vector. Decrease line graph vectors Decreasing graph line icon. Column chart sign. Halftone dotted pattern. Vector. Decreasing graph line icon. Halftone dotted pattern. Gradient icon with grain shadow. Column chart sign. Market analytics symbol. Line decreasing graph icon. Various designs. Vector
Free with trial Report line icon. Halftone dotted pattern. Gradient icon with grain shadow. Column graph, pie chart sign. Market analytics symbol. Line report icon. Various designs. Vector. Decrease line graph vectors Report line icon. Column graph, pie chart sign. Halftone dotted pattern. Vector. Report line icon. Halftone dotted pattern. Gradient icon with grain shadow. Column graph, pie chart sign. Market analytics symbol. Line report icon. Various designs. Vector
Free with trial A line graph showing a downward trend with two colored lines on a grid background. The graph represents data analysis and statistics. Decrease line graph illustrations Downward Trend Line Graph. A line graph showing a downward trend with two colored lines on a grid background. The graph represents data analysis and statistics.
Free with trial Presentation board line icon. Halftone dotted pattern. Gradient icon with grain shadow. Column graph sign. Growth diagram symbol. Line presentation board icon. Various designs. Vector. Decrease line graph vectors Presentation board line icon. Column graph sign. Halftone dotted pattern. Vector. Presentation board line icon. Halftone dotted pattern. Gradient icon with grain shadow. Column graph sign. Growth diagram symbol. Line presentation board icon. Various designs. Vector
Free with trial Pie chart line icon. Halftone dotted pattern. Gradient icon with grain shadow. Presentation 3d graph sign. Market analytics symbol. Line pie chart icon. Various designs. Vector. Decrease line graph vectors Pie chart line icon. Presentation 3d graph sign. Halftone dotted pattern. Vector. Pie chart line icon. Halftone dotted pattern. Gradient icon with grain shadow. Presentation 3d graph sign. Market analytics symbol. Line pie chart icon. Various designs. Vector
Free with trial A minimalist line graph depicts a significant downward trend with a sharp, jagged line indicating a decline. Decrease line graph illustrations Simple line graph illustrating a sharp downward trend and decline. A minimalist line graph depicts a significant downward trend with a sharp, jagged line indicating a decline
Free with trial Financial crisis recession falling graph chart warning declining bar and line graph red exclamation coins documents cityscape abstract background Vector illustration. Decrease line graph vectors Financial crisis recession falling graph chart warning declining bar and line graph red exclamation coins documents cityscape
Free with trial The graph displays two lines, one green and one red. The green line is ascending, indicating growth or progress, while the red line is descending, suggesting a decline or decrease. Decrease line graph illustrations A graph with a green line and a red line. The graph displays two lines, one green and one red. The green line is ascending, indicating growth or progress, while the red line is descending, suggesting a decline or decrease
Free with trial A simple and clean line art icon of a graph, isolated on a white background. This vector illustration features a line chart with axes, showing a fluctuating trend with distinct data points. The minimalist design makes it perfect for various applications related to business, finance, and data analysis. Ideal for use in presentations, infographics, websites, mobile apps, and user interfaces to represent concepts like statistics, growth, market trends, performance reports, and financial analytics. A versatile symbol for progress and data visualization. Decrease line graph illustrations Analytics Line Graph Vector Icon. A simple and clean line art icon of a graph, isolated on a white background. This vector illustration features a line chart with axes, showing a fluctuating trend with distinct data points. The minimalist design makes it perfect for various applications related to business, finance, and data analysis. Ideal for use in presentations, infographics, websites, mobile apps, and user interfaces to represent concepts like statistics, growth, market trends, performance reports, and financial analytics. A versatile symbol for progress and data visualization.
Free with trial Yellow sad emoticon and green pants next to stylized line graph with nodes. Ideal for fashion industry, sales decrease, trends, dissatisfaction, analysis, loss, economics. Simple flat metaphor. Decrease line graph illustrations Sad face with pants and graph chart symbolizing loss or decline in trends or fashion demand. Yellow sad emoticon and green pants next to stylized line graph with nodes. Ideal for fashion industry, sales decrease, trends, dissatisfaction, analysis, loss, economics. Simple flat metaphor
Free with trial A graphic illustration featuring a black jagged downward-pointing arrow overlapping a black Indian Rupee symbol and a decreasing line graph on a white background, symbolizing financial loss, market crash, and currency depreciation. Decrease line graph illustrations Black Downward Arrow with Indian Rupee Symbol and Declining Line Graph. A graphic illustration featuring a black jagged downward-pointing arrow overlapping a black Indian Rupee symbol and a decreasing line graph on a white background, symbolizing financial loss, market crash, and currency depreciation.
Free with trial Set line Mind map infographic, Financial growth decrease and icon. Vector. Decrease line graph illustrations Set line Mind map infographic, Financial growth decrease and icon. Vector
Free with trial Six simple line graphs showcase various data trends, including upward, downward, and fluctuating patterns. Each graph features key data points marked with letters. Decrease line graph illustrations Six Line Graph Charts Data Visualization, Trends, Growth, Analysis. Six simple line graphs showcase various data trends, including upward, downward, and fluctuating patterns. Each graph features key data points marked with letters
Free with trial A simple and clean line graph icon illustration, perfect for illustrating financial data, growth charts, and statistical analysis. Ideal for use in presentations, reports, and websites. Decrease line graph vectors Minimalist Line Graph Icon Design for Financial Data Analysis Presentation. A simple and clean line graph icon illustration, perfect for illustrating financial data, growth charts, and statistical analysis. Ideal for use in presentations, reports, and websites.