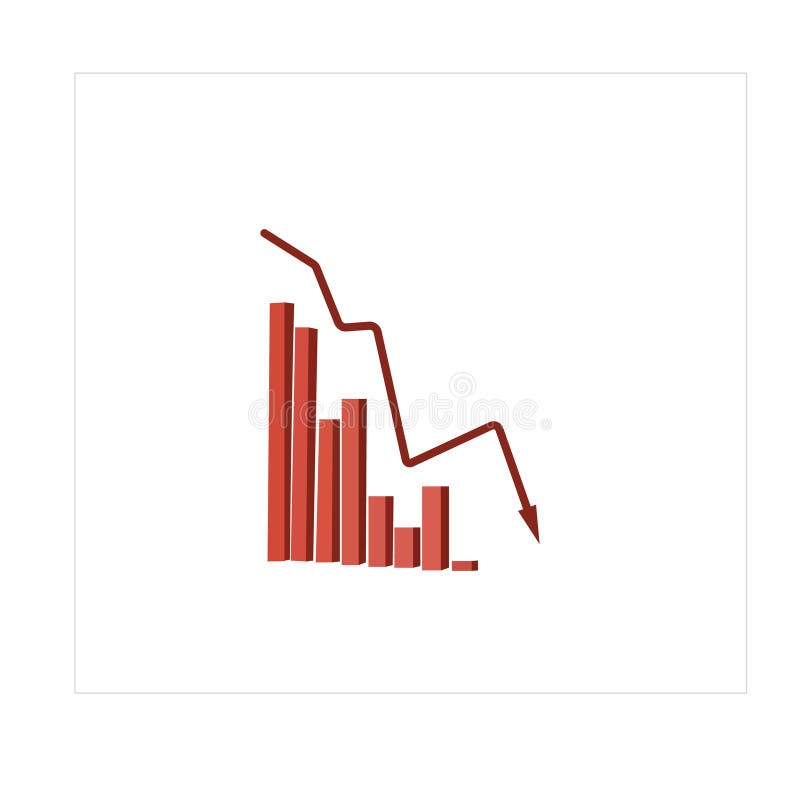
Free with trial This image displays a 3D bar graph with five vertical bars of decreasing height, rendered in a vibrant pink color. A pink line graph with a sharp downward trajectory originates from the top of the tallest bar and descends across the bars, ending at the base of the shortest bar. The entire composition is isolated on a clean white background, clearly illustrating a negative trend or decline. Decrease line graph illustrations A pink 3D bar graph with a descending line graph on a white background chart. This image displays a 3D bar graph with five vertical bars of decreasing height, rendered in a vibrant pink color. A pink line graph with a sharp downward trajectory originates from the top of the tallest bar and descends across the bars, ending at the base of the shortest bar. The entire composition is isolated on a clean white background, clearly illustrating a negative trend or decline
Free with trial Growth chart line icon. Neumorphic, Flat shadow, 3d buttons. Column graph sign. Market analytics symbol. Line growth chart icon. Social media icons. Vector. Decrease line graph vectors Growth chart line icon. Column graph sign. Neumorphic buttons. Vector. Growth chart line icon. Neumorphic, Flat shadow, 3d buttons. Column graph sign. Market analytics symbol. Line growth chart icon. Social media icons. Vector
Free with trial A magn magnifying glass hovering over a black surface. The background is blurred, but it is a cityscape with buildings and skyscrapers. In the center of the image, there is a red and orange line graph that appears to show a stock market data. The lines on the graph are in orange and yellow, indicating a decrease in the market. The image was taken from a close-up perspective, with the focus on the magnifying lens. Decrease line graph illustrations A magnifying glass with a stock market graph on it (ai generated). A magn magnifying glass hovering over a black surface. The background is blurred, but it is a cityscape with buildings and skyscrapers. In the center of the image, there is a red and orange line graph that appears to show a stock market data. The lines on the graph are in orange and yellow, indicating a decrease in the market. The image was taken from a close-up perspective, with the focus on the magnifying lens.
Free with trial Financial problem color line icon with money and recession graph. Vector economic crisis, bankruptcy, money loss and poverty outline symbol with decline chart arrow, dollar currency bill and coins. Decrease line graph vectors Financial problem color line icon, money and graph. Financial problem color line icon with money and recession graph. Vector economic crisis, bankruptcy, money loss and poverty outline symbol with decline chart arrow, dollar currency bill and coins
Free with trial Minimalist style percentage illustration continuous line drawing business graph vector art. Decrease line graph vectors Minimalist style percentage illustration continuous line drawing business graph
Free with trial Data combining line graph style illustration analysis visualization, ch series, point plot data combining line graph style. Decrease line graph illustrations Data combining line graph style
Free with trial Set line Financial growth decrease, Data analysis, and Server on black and white. Vector. Decrease line graph illustrations Set line Financial growth decrease, Data analysis, and Server on black and white. Vector
Free with trial Climate change, sustainability, carbon tracking, CO2 emissions reduction, environmental impact, data visualization. Line graph tracking data. Climate change and sustainability concepts. Decrease line graph vectors Carbon Footprint Reduction Concept with Line Graph, CO2 Symbol, and Decreasing Temperature Indicator. Climate change, sustainability, carbon tracking, CO2 emissions reduction, environmental impact, data visualization. Line graph tracking data. Climate change and sustainability concepts
Free with trial A black and white icon depicts a laptop with a downward-trending graph on the screen. The graph features a zigzagging line sloping downward, ending with an arrow. The design implies a decrease, decline, or loss in data or performance, commonly used in financial or business contexts. Simple and minimalistic, it effectively communicates the concept of negative change in a digital context. Decrease line graph vectors Laptop with a downward-trending graph
Free with trial Red bar graph with downward trend line and arrow. Four vertical bars decrease in height from left to right, illustrating a declining pattern. Bold, simple vector style on a white background, emphasizing financial or statistical downward movement. Decrease line graph illustrations Graph down or scale down vector art illustration. Red bar graph with downward trend line and arrow. Four vertical bars decrease in height from left to right, illustrating a declining pattern. Bold, simple vector style on a white background, emphasizing financial or statistical downward movement.
Free with trial Set line Pie chart infographic, Financial growth decrease and Data analysis icon. Vector. Decrease line graph vectors Set line Pie chart infographic, Financial growth decrease and Data analysis icon. Vector
Free with trial An isolated graphic illustration featuring a red downward-trending jagged arrow overlapping an outlined Indian Rupee symbol and a decreasing line graph, symbolizing financial loss, market decline, and currency depreciation. Delivered with an alpha transparent background. Decrease line graph vectors Red Downward Arrow with Indian Rupee Symbol and Declining Line Graph Alpha Transparent. An isolated graphic illustration featuring a red downward-trending jagged arrow overlapping an outlined Indian Rupee symbol and a decreasing line graph, symbolizing financial loss, market decline, and currency depreciation. Delivered with an alpha transparent background.
Free with trial A stark white line graph depicts a significant downward trend with sharp fluctuations against a dark grid. Decrease line graph illustrations Sharp downward trend illustrated by a jagged white line graph on a black grid background. A stark white line graph depicts a significant downward trend with sharp fluctuations against a dark grid
Free with trial Set line Data analysis, Financial growth, Calculator, Folder and lock, decrease and icon. Vector. Decrease line graph illustrations Set line Data analysis, Financial growth, Calculator, Folder and lock, decrease and icon. Vector
Free with trial Red zigzag line graph with broken arrows pointing up and down. Business metaphor for market volatility and financial crisis. Handdrawn zig zag arrows. Decrease line graph vectors Red zigzag line graph with broken arrows pointing up and down. Market volatility and financial crisis. Zig zag arrows. Red zigzag line graph with broken arrows pointing up and down. Business metaphor for market volatility and financial crisis. Handdrawn zig zag arrows
Free with trial A simple and effective line graph illustrating the concept of debt reduction. The chart, on a clean white background, shows a green line trending downwards, representing a successful decrease in liabilities over time. A final red arrow emphasizes a significant or accelerated drop, symbolizing a successful financial strategy, cost-cutting, or achieving financial freedom. This vector illustration is perfect for presentations, articles, and infographics on personal or business finance, money management, and economic stability. Decrease line graph vectors Debt Reduction Concept Graph Showing Downward Trend. A simple and effective line graph illustrating the concept of debt reduction. The chart, on a clean white background, shows a green line trending downwards, representing a successful decrease in liabilities over time. A final red arrow emphasizes a significant or accelerated drop, symbolizing a successful financial strategy, cost-cutting, or achieving financial freedom. This vector illustration is perfect for presentations, articles, and infographics on personal or business finance, money management, and economic stability.
Free with trial Set line Shopping cart and dollar Piggy bank with coin and Financial growth decrease icon. Vector. Decrease line graph illustrations Set line Shopping cart and dollar, Piggy bank with coin and Financial growth decrease icon. Vector
Free with trial Set line Location, Financial growth decrease, Old hourglass with sand and increase icon. Vector. Decrease line graph illustrations Set line Location, Financial growth decrease, Old hourglass with sand and increase icon. Vector
Free with trial Line Graph Chart Line And Solid Icon Set. Data Analysis, Trend Visualization, And Business Growth Symbol Collection. Statistical Representation And Performance Tracking. Isolated Vector Illustration. Decrease line graph vectors Line Graph Chart Line And Solid Icon Set. Data Analysis, Trend Visualization, And Business Growth Symbol Collection
Free with trial A digital representation of a blue line graph showing a significant downward trend with fluctuations against a dark grid. Decrease line graph illustrations Abstract blue line graph depicting a sharp decline and volatile trend on a black grid background. A digital representation of a blue line graph showing a significant downward trend with fluctuations against a dark grid
Free with trial Set line Search cloud computing, Financial growth decrease and Pie chart infographic icon. Vector. Decrease line graph vectors Set line Search cloud computing, Financial growth decrease and Pie chart infographic icon. Vector
Free with trial Decreasing graph line icon. Neumorphic, Flat shadow, 3d buttons. Column chart sign. Crisis diagram symbol. Line decreasing graph icon. Social media icons. Vector. Decrease line graph vectors Decreasing graph line icon. Crisis chart sign. Neumorphic buttons. Vector. Decreasing graph line icon. Neumorphic, Flat shadow, 3d buttons. Column chart sign. Crisis diagram symbol. Line decreasing graph icon. Social media icons. Vector
Free with trial Decreasing graph line icon. Neumorphic, Flat shadow, 3d buttons. Column chart sign. Market analytics symbol. Line decreasing graph icon. Social media icons. Vector. Decrease line graph vectors Decreasing graph line icon. Column chart sign. Neumorphic buttons. Vector. Decreasing graph line icon. Neumorphic, Flat shadow, 3d buttons. Column chart sign. Market analytics symbol. Line decreasing graph icon. Social media icons. Vector
Free with trial A 3D icon depicts a financial graph. The icon features a rounded purple square with a lighter purple top edge. Inside, a yellow line chart with circular data points shows an upward trend, overlaid on a series of yellow vertical bars representing a bar chart. The overall design is clean and modern, symbolizing data analysis, business growth, and financial performance. Decrease line graph illustrations 3D icon representing a financial graph with bars and a line chart on a purple background. A 3D icon depicts a financial graph. The icon features a rounded purple square with a lighter purple top edge. Inside, a yellow line chart with circular data points shows an upward trend, overlaid on a series of yellow vertical bars representing a bar chart. The overall design is clean and modern, symbolizing data analysis, business growth, and financial performance
Free with trial The image depicts a graph with a prominent downward trend. The graph features a thick black line sloping downwards from left to right, indicating a decline. Alongside this line, there are several vertical bars representing data points. The bars vary in height, with some being taller and others shorter, suggesting fluctuations in the data. The overall visual representation suggests a decrease in. Decrease line graph vectors Graph displaying downward trend with multiple data points. The image depicts a graph with a prominent downward trend. The graph features a thick black line sloping downwards from left to right, indicating a decline. Alongside this line, there are several vertical bars representing data points. The bars vary in height, with some being taller and others shorter, suggesting fluctuations in the data. The overall visual representation suggests a decrease in
Free with trial Set line Data analysis, Financial growth decrease, and Search data. Business infographic template. Vector. Decrease line graph illustrations Set line Data analysis, Financial growth decrease, and Search data. Business infographic template. Vector
Free with trial Graph Declining with Arrow Line Art Minimalist Representation. Decrease line graph vectors Graph Declining with Arrow Line Art Minimalist Representation
Free with trial A hand-drawn bar chart shows a downward trend with a line graph indicating a significant decrease in value over time. Decrease line graph vectors Downturn graph illustrating declining trends and financial loss. A hand-drawn bar chart shows a downward trend with a line graph indicating a significant decrease in value over time
Free with trial A 3D rendered graphic depicts a simplified bar chart with pastel colored bars in pink, yellow, and blue. A line graph with white lines and orange and yellow nodes crosses diagonally above the bars. The elements are set against a light blue background with a light tan border, all isolated on a white background. Decrease line graph vectors 3 D cartoon bar chart with line graph on blue background data. A 3D rendered graphic depicts a simplified bar chart with pastel colored bars in pink, yellow, and blue. A line graph with white lines and orange and yellow nodes crosses diagonally above the bars. The elements are set against a light blue background with a light tan border, all isolated on a white background
Free with trial Line graph with downward trend alongside sad face. Ideal for performance loss, business challenges, failure, analysis, recession, disappointment, frustration. Simple flat metaphor. Decrease line graph vectors Declining Line Graph with Sad Face Representing Negative Trend and Disappointment. Line graph with downward trend alongside sad face. Ideal for performance loss, business challenges, failure, analysis, recession, disappointment, frustration. Simple flat metaphor
Free with trial A 3D rendered red bar chart and line graph show a downward trend against a white grid background. The graph reflects a decline with a red arrow pointing down. Decrease line graph illustrations Red downward trending bar chart and line graph on white grid image. A 3D rendered red bar chart and line graph show a downward trend against a white grid background. The graph reflects a decline with a red arrow pointing down
Free with trial Black line graph showing upward and downward trends with arrows on a white background. Decrease line graph illustrations Black line graph with upward and downward trends and arrows chart data. Black line graph showing upward and downward trends with arrows on a white background
Free with trial Business Chart and Graph Set with Line, Bar, and Pie Icons for Data Analysis or Statistics in Reports and Research. Vector. Editable stroke. Decrease line graph vectors Business Chart and Graph Set with Line, Bar, and Pie Icons for Data Analysis or Statistics in Reports and Research
Free with trial Set line Financial growth decrease Data analysis Pie chart infographic Server Binary code and icon. Vector. Decrease line graph illustrations Set line Financial growth decrease, Data analysis, Pie chart infographic, Server, Binary code, and icon. Vector. Set line Financial growth decrease Data analysis. Set line Financial growth decrease Data analysis Pie chart infographic Server Binary code and icon. Vector.
Free with trial Set line Calculator Pie chart infographic Financial growth decrease and Network cloud connection. Business infographic template. Vector. Decrease line graph illustrations Set line Calculator, Pie chart infographic, Financial growth decrease and Network cloud connection. Business infographic
Free with trial Set line Pie chart infographic, Financial growth increase, decrease and Old hourglass with sand icon. Vector. Decrease line graph vectors Set line Pie chart infographic, Financial growth increase, decrease and Old hourglass with sand icon. Vector
Free with trial Aesthetic pastel style diminishing line graph illustration soft gradient, design minimal, subtle smooth aesthetic pastel style diminishing line graph. Decrease line graph illustrations Aesthetic pastel style diminishing line graph
Free with trial This image depicts a bar graph with a clear downward trend. Blue bars decrease in height from left to right, representing a decline in value. A bold red arrow overlays the bars, visually emphasizing the negative trend. A blue line also shows a downward trend. The image conveys a sense of loss, recession, or negative performance and is suitable for illustrating financial or economic concepts. Decrease line graph illustrations Declining Bar Graph with Downward Trend Lines. This image depicts a bar graph with a clear downward trend. Blue bars decrease in height from left to right, representing a decline in value. A bold red arrow overlays the bars, visually emphasizing the negative trend. A blue line also shows a downward trend. The image conveys a sense of loss, recession, or negative performance and is suitable for illustrating financial or economic concepts.
Free with trial Set line Shopping cart and dollar, Piggy bank hammer, Financial growth decrease and Money plant the pot. Business infographic template. Vector. Decrease line graph illustrations Set line Shopping cart and dollar, Piggy bank hammer, Financial growth decrease and Money plant the pot. Business
Free with trial This image features a minimalist and modern vector icon of a jagged downward trending line graph, sharply declining from left to right, symbolizing financial loss, economic downturn, or market decline, set against a clean and uncluttered white background suitable for use in presentations, reports, infographics, or digital media to visually communicate negative trends or decreasing performance. Decrease line graph illustrations Sharp downward trending line graph icon isolated on white background representing financial loss or market decline vector. This image features a minimalist and modern vector icon of a jagged downward trending line graph, sharply declining from left to right, symbolizing financial loss, economic downturn, or market decline, set against a clean and uncluttered white background suitable for use in presentations, reports, infographics, or digital media to visually communicate negative trends or decreasing performance
Free with trial A green line graph illustrating data points over time, with the y-axis labeled 'Value' and the x-axis labeled 'Time', showcasing significant ups and downs in the data. Decrease line graph illustrations Line graph showing fluctuating values over time. A green line graph illustrating data points over time, with the y-axis labeled 'Value' and the x-axis labeled 'Time', showcasing significant ups and downs in the data
Free with trial Black and white line graph comparing nominal and real return over time with axes labeled. Decrease line graph illustrations Black and white line graph showing nominal and real return over time chart nominal return. Black and white line graph comparing nominal and real return over time with axes labeled
Free with trial A minimalist and clean line art illustration of a graph depicting a downward trend, symbolizing economic decline, failure, or a recession in business. Decrease line graph vectors Simple Outline Falling Graph Line Chart Economic Recession Business Icon. A minimalist and clean line art illustration of a graph depicting a downward trend, symbolizing economic decline, failure, or a recession in business.
Free with trial A digital illustration on a black background features a world map rendered in shades of pink and purple with Data Doomsday text above it, divided into sections representing different data levels and centered by a line graph tracking data progression from 2000 to 2100 with green lines showing pre-industrial and contemporary data trends arranged vertically with a legend explaining each metric. Decrease line graph illustrations Data doomsday digital illustration showing world map with pink purple color scheme and line graph tracking data levels from 2000. A digital illustration on a black background features a world map rendered in shades of pink and purple with Data Doomsday text above it, divided into sections representing different data levels and centered by a line graph tracking data progression from 2000 to 2100 with green lines showing pre-industrial and contemporary data trends arranged vertically with a legend explaining each metric
Free with trial Set line Financial growth decrease Binary code Data analysis Search data with folder and Pie chart infographic icon. Vector. Decrease line graph illustrations Set line Financial growth decrease, Binary code, Data analysis, Search data, with folder and Pie chart infographic icon
Free with trial Set line Mobile stock trading, Safe, Drop crude oil price and Dollar rate decrease. Business infographic template. Vector. Decrease line graph vectors Set line Mobile stock trading, Safe, Drop crude oil price and Dollar rate decrease. Business infographic template
Free with trial Set line Drop in crude oil price Dollar rate decrease Global economic crisis Safe Money bag and Calculation of expenses icon. Vector. Decrease line graph vectors Set line Drop in crude oil price, Dollar rate decrease, Global economic crisis, Safe, Money bag and Calculation of. Set line Drop in crude oil price Dollar rate decrease Global economic crisis Safe Money bag and Calculation of expenses icon. Vector.
Free with trial Displaying purple world map with rising red bars, red line graph on slide with green grid. Infographic, analytics, digital, technology, finance, strategic, modern. Decrease line graph illustrations Displaying purple world map with rising red bars, red line graph on slide with green grid
Free with trial Basic charts line icon set. Bar diagram, pie and histogram graph. Data visualization, growth and distribution analysis for business and finance. Vector illustration Editable Stroke. Decrease line graph illustrations Basic charts line icon set. Bar diagram, pie and histogram graph. Data visualization, growth and distribution analysis
Free with trial A modern vector illustration of a line graph showing a clear decline, emphasized by a red downtrend arrow. Ideal for financial reports, business presentations, or data visualization projects illustrating negative trends or decreases. This graphic effectively communicates a downward movement in statistics, vector design Generative AI. Decrease line graph vectors Declining Line Graph with Red Downtrend Arrow, vector design Generative AI. A modern vector illustration of a line graph showing a clear decline, emphasized by a red downtrend arrow. Ideal for financial reports, business presentations, or data visualization projects illustrating negative trends or decreases. This graphic effectively communicates a downward movement in statistics, vector design Generative AI
Free with trial A visual representation of declining performance, with red bars and a descending line graph on a white background. Decrease line graph illustrations Red bar chart showing downward trend and line graph. A visual representation of declining performance, with red bars and a descending line graph on a white background.
Free with trial A white line graph with connected points and a bar chart are shown within a dark gray circle icon, representing data analysis. Decrease line graph illustrations White line graph and bar chart in a dark gray circle icon data statistics. A white line graph with connected points and a bar chart are shown within a dark gray circle icon, representing data analysis
Free with trial Logotype line Financial growth decrease icon isolated on grey background. Increasing revenue. Logo design template element. Vector. Decrease line graph illustrations Logotype line Financial growth decrease icon isolated on grey background. Increasing revenue. Logo design template
Free with trial A 3D blue bar chart and a dark blue line graph illustrate a significant downward trend, indicating a decline in data over time. Decrease line graph illustrations Blue bar chart and line graph showing downward trend. A 3D blue bar chart and a dark blue line graph illustrate a significant downward trend, indicating a decline in data over time.
Free with trial Down graph chart arrow drop icon. Decrease downward vector market decrease down trend. Decrease line graph vectors Down graph chart arrow drop icon. Decrease downward vector market decrease down trend.
Free with trial A simple line graph showing a downward trend with an arrow pointing down on a white background. Decrease line graph illustrations Downward trending line graph with arrow indicating decline business finance. A simple line graph showing a downward trend with an arrow pointing down on a white background
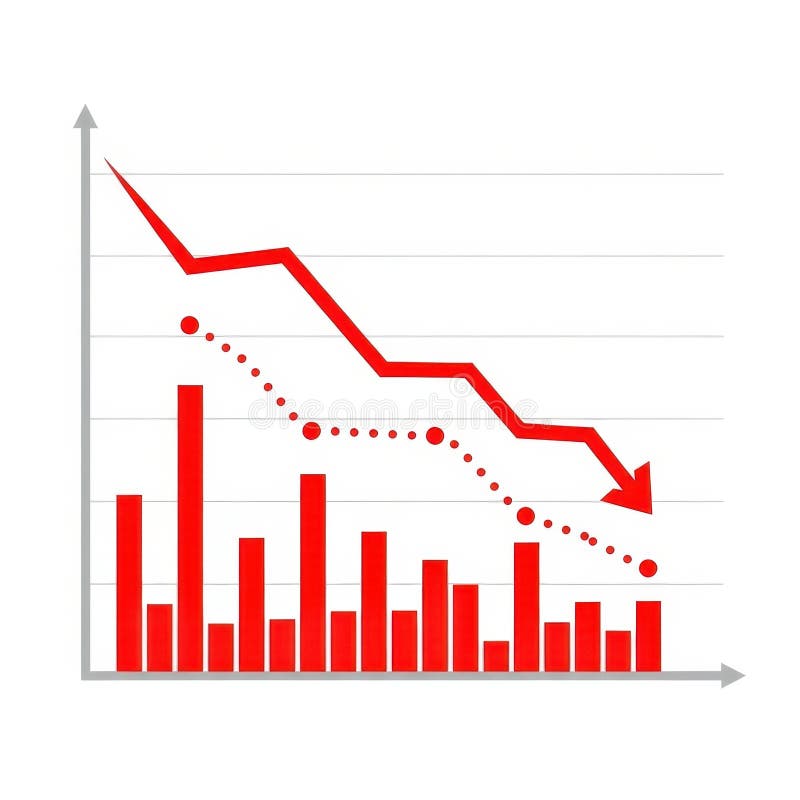
Free with trial A visual representation of negative financial performance. It features red bars and a red line graph showing a downward trend, accompanied by a dotted line indicating a similar pattern. Decrease line graph illustrations Red downward trending graph with bars and dotted line. A visual representation of negative financial performance. It features red bars and a red line graph showing a downward trend, accompanied by a dotted line indicating a similar pattern
Free with trial Set line Global economic crisis Gold bars Debt ball chained to coin Dollar rate decrease Prison cell door Safe and icon. Vector. Decrease line graph illustrations Set line Global economic crisis, Gold bars, Debt ball chained to coin, Dollar rate decrease, Prison cell door, Safe and
Free with trial Line Financial growth decrease icon isolated on white background. Increasing revenue. Colorful outline concept. Vector. Decrease line graph illustrations Line Financial growth decrease icon isolated on white background. Increasing revenue. Colorful outline concept. Vector
Free with trial Isometric line Financial growth decrease icon isolated on pink and blue background. Increasing revenue. Square button. Vector. Decrease line graph vectors Isometric line Financial growth decrease icon isolated on pink and blue background. Increasing revenue. Square button
Free with trial Line Financial growth decrease icon isolated on black background. Increasing revenue. Colorful outline concept. Vector. Decrease line graph illustrations Line Financial growth decrease icon isolated on black background. Increasing revenue. Colorful outline concept. Vector
Free with trial A black jagged line graph with an arrow pointing downwards on a white background. Clear details and vibrant co. Decrease line graph illustrations Black descending jagged line graph with arrow indicating downward trend chart. A black jagged line graph with an arrow pointing downwards on a white background. Clear details and vibrant co
Free with trial Ai-Generated. Professional chart stock image featuring set of black and white minimalist chart and graph line icons. Decrease line graph vectors Set of black and white minimalist chart and graph line icons
Free with trial Set line Debt ball chained to coin, Storm, Dollar rate decrease and Mobile stock trading. Business infographic template. Vector. Decrease line graph vectors Set line Debt ball chained to coin, Storm, Dollar rate decrease and Mobile stock trading. Business infographic template
Free with trial Graph of oscillating line with horizontal line and arrow isolated on white background. Decrease line graph vectors Graph of oscillating line with horizontal line and arrow isolated on white background
Free with trial Data Stats Board Display Line Icon Downward Down Trend Statistic Performance Market Decline Economy Downturn Bar Graph Progress Outline Presentation. Decrease line graph vectors Data Stats Board Display Line Icon Downward Down Trend Statistic Performance Market Decline Economy Downturn Bar Graph
Free with trial The image depicts a line graph with fluctuating values, marked by upward and downward arrows indicating trends. The graph starts at a low point, rises sharply, dips, and then continues to fluctuate with peaks and troughs. There are arrows pointing up and down at various points on the graph, suggesting increases and decreases in the values. The graph is set against a light, transparent background. Decrease line graph illustrations A fluctuating line graph with upward and downward trends highlighted by arrows. The image depicts a line graph with fluctuating values, marked by upward and downward arrows indicating trends. The graph starts at a low point, rises sharply, dips, and then continues to fluctuate with peaks and troughs. There are arrows pointing up and down at various points on the graph, suggesting increases and decreases in the values. The graph is set against a light, transparent background
Free with trial A jagged black line graph shows a steep downward trend ending with an arrow. Clear details and vibrant colors. Decrease line graph illustrations Jagged black line graph trending downwards with arrow on white background line chart. A jagged black line graph shows a steep downward trend ending with an arrow. Clear details and vibrant colors
Free with trial A black bar graph icon with a downward arrow and trend line indicates a decline. Clear details and vibrant col. Decrease line graph illustrations Black Bar Graph Icon with Downward Arrow and Trend Line on White Background data. A black bar graph icon with a downward arrow and trend line indicates a decline. Clear details and vibrant col
Free with trial Diagram chart line icon. Continuous line with share plane. Analytics graph sign. Market analytics symbol. 3d heart in speech bubble. Analytics chart single line ribbon. Loop curve pattern. Vector. Decrease line graph vectors Diagram chart line icon. Analytics graph sign. Continuous line with plane. Vector. Diagram chart line icon. Continuous line with share plane. Analytics graph sign. Market analytics symbol. 3d heart in speech bubble. Analytics chart single line ribbon. Loop curve pattern. Vector
Free with trial A black line graph with a zigzagging downward trend and an arrow pointing down. Clear details and vibrant colo. Decrease line graph illustrations Black line graph showing a sharp downward trend on white background chart decline. A black line graph with a zigzagging downward trend and an arrow pointing down. Clear details and vibrant colo
Free with trial A red line graph showing a downward trend. Generative AI. Decrease line graph illustrations A red line graph showing a downward trend
Free with trial A black line graph depicting a downward trend with an arrow on a white background Clear details and vibrant co. Decrease line graph illustrations Black line graph showing a downward trend with an arrow chart decline. A black line graph depicting a downward trend with an arrow on a white background Clear details and vibrant co
Free with trial A black line graph with two curves showing a downward trend on a white background. Decrease line graph illustrations Black line graph showing a downward trend with two lines on white background chart. A black line graph with two curves showing a downward trend on a white background
Free with trial Line graph with plotted data points, bar chart, and triangular warning alert. Ideal for analytics, business, risk management, financial trends, forecasting, reporting performance tracking simple. Decrease line graph vectors Data Analysis with Line Graph, Bar Chart, and Warning Sign for Risk Monitoring. Line graph with plotted data points, bar chart, and triangular warning alert. Ideal for analytics, business, risk management, financial trends, forecasting, reporting performance tracking simple
Free with trial Pyramid chart line icon. Halftone dotted pattern. Gradient icon with grain shadow. Analytics graph sign. Market analytics symbol. Line pyramid chart icon. Various designs. Vector. Decrease line graph vectors Pyramid chart line icon. Analytics graph sign. Halftone dotted pattern. Vector. Pyramid chart line icon. Halftone dotted pattern. Gradient icon with grain shadow. Analytics graph sign. Market analytics symbol. Line pyramid chart icon. Various designs. Vector
Free with trial Black line graph showing a downward trend on a white background with grid lines chart. Decrease line graph illustrations Black line graph showing a downward trend on a white background with grid lines chart
Free with trial Green arrow pointing downward on financial graph. Business chart with falling trend line. Digital stock market data visualization for investment analysis. Decrease line graph illustrations Green arrow pointing downward on financial graph. Business chart with falling trend line
Free with trial Black icon of a rising line graph with arrow pointing down on white background chart. Decrease line graph illustrations Black icon of a rising line graph with arrow pointing down on white background chart