Free with trial This image depicts a visual representation of financial or business growth and decline using a series of ascending and descending three-dimensional bar charts, where the left side shows smaller bars gradually increasing in height, transitioning through a central flat bar, and shifting to taller bars on the right side that progressively decrease, all set against a plain white background to. Decrease statistics illustrations Growth and progress concept with ascending and descending bar charts illustrating business success and financial improvement over. This image depicts a visual representation of financial or business growth and decline using a series of ascending and descending three-dimensional bar charts, where the left side shows smaller bars gradually increasing in height, transitioning through a central flat bar, and shifting to taller bars on the right side that progressively decrease, all set against a plain white background to
Free with trial Downward blue arrow, hand gesture, and declining bar graph. Ideal for business loss, negative trends, economy, failure, recession setback performance. Simple flat metaphor. Decrease statistics illustrations Downward Arrow with Hand and Declining Bar Graph Representing Business Loss or Decrease. Downward blue arrow, hand gesture, and declining bar graph. Ideal for business loss, negative trends, economy, failure, recession setback performance. Simple flat metaphor
Free with trial Black outline of descending bar chart with downward arrow, isolated on white background. concept of economic decline, data analysis, financial crisis, statistics. Decrease statistics vectors Black outline of descending bar chart with downward arrow, isolated on white background. concept of economic decline, data
Free with trial A magnifying glass focuses on a declining bar graph and a file folder, symbolizing a decrease in sales and the need for. Decrease statistics illustrations Declining Sales Analysis Magnifying Glass, Downward Graph. A magnifying glass focuses on a declining bar graph and a file folder, symbolizing a decrease in sales and the need for.
Free with trial Two sets of simple flat design charts showing bar graphs with line graphs and three-segment pie charts in red, green, and blue. Decrease statistics vectors Two bar charts with line graphs and two pie charts data visualization statistics. Two sets of simple flat design charts showing bar graphs with line graphs and three-segment pie charts in red, green, and blue
Free with trial An isometric 3D bar graph with three descending steps, made of a glossy, reflective material with a blue and purple gradient. This illustrates a decrease or decline. Concept of financial loss or reduced metrics. Decrease statistics vectors Blue and Purple Isometric Bar Graph Showing a Downtrend. An isometric 3D bar graph with three descending steps, made of a glossy, reflective material with a blue and purple gradient. This illustrates a decrease or decline. Concept of financial loss or reduced metrics
Free with trial A collection of nine simple black icons on a white background depicting concepts of decrease loss and downward trends using graphs charts and arrows. Decrease statistics vectors Set of black decline icons showing business failure and data reduction. A collection of nine simple black icons on a white background depicting concepts of decrease loss and downward trends using graphs charts and arrows
Free with trial A collection of nine simple, solid black icons on a white background, illustrating concepts of decline, loss, and negative trends using various charts like bar graphs, line graphs, and pie charts with downward pointing arrows. Decrease statistics vectors Set of black icons representing financial decrease and downward trends. A collection of nine simple, solid black icons on a white background, illustrating concepts of decline, loss, and negative trends using various charts like bar graphs, line graphs, and pie charts with downward pointing arrows
Free with trial A comprehensive collection of hand-drawn business and data visualization icons. This doodle-style set features a variety of essential elements, including different types of arrows, bar graphs, line charts, and pie charts. The sketchy, black and white illustrations are perfect for infographics, presentations, financial reports, and marketing materials. Each icon is isolated on a white background, representing concepts like growth, statistics, process flow, and direction. This versatile vector set is ideal for adding a creative, hand-made touch to any project related to analytics, finance, or strategy. Decrease statistics illustrations Hand Drawn Business and Finance Doodle Icon Set. A comprehensive collection of hand-drawn business and data visualization icons. This doodle-style set features a variety of essential elements, including different types of arrows, bar graphs, line charts, and pie charts. The sketchy, black and white illustrations are perfect for infographics, presentations, financial reports, and marketing materials. Each icon is isolated on a white background, representing concepts like growth, statistics, process flow, and direction. This versatile vector set is ideal for adding a creative, hand-made touch to any project related to analytics, finance, or strategy.
Free with trial A striking 3D render illustrating a significant financial or business decline. The image features a minimalist bar chart with three decreasing blue-grey bars, symbolizing a negative trend or falling performance. A prominent, jagged red arrow sharply points downwards across the chart, emphatically conveying concepts of loss, recession, crisis, or market downturn. Set against a vibrant yellow background, this clean and modern graphic is ideal for presentations, reports, articles, or educational materials discussing economic challenges, poor statistics, or business risks. Decrease statistics illustrations Financial Decline Bar Chart with Red Down Arrow. A striking 3D render illustrating a significant financial or business decline. The image features a minimalist bar chart with three decreasing blue-grey bars, symbolizing a negative trend or falling performance. A prominent, jagged red arrow sharply points downwards across the chart, emphatically conveying concepts of loss, recession, crisis, or market downturn. Set against a vibrant yellow background, this clean and modern graphic is ideal for presentations, reports, articles, or educational materials discussing economic challenges, poor statistics, or business risks.
Free with trial Black and white icon of a bar graph with short bars and a downward pointing arrow. Decrease statistics illustrations Bar graph with short bars and a downward pointing arrow bar chart decrease. Black and white icon of a bar graph with short bars and a downward pointing arrow
Free with trial Abstract 3d bar charts illustrating data visualization, financial statistics, and business analysis, presenting growth and decline trends in a report format. Decrease statistics illustrations Business data visualization showing 3d bar graphs. Abstract 3d bar charts illustrating data visualization, financial statistics, and business analysis, presenting growth and decline trends in a report format
Free with trial A colorful bar chart illustrates a downward trend, with a prominent red arrow indicating a significant decrease in data. Decrease statistics illustrations Bar chart showing declining trend with red arrow. A colorful bar chart illustrates a downward trend, with a prominent red arrow indicating a significant decrease in data
Free with trial A 3D red bar chart shows a declining trend against a white grid background. The bars decrease in height from left to right, with a red line graph following the downward trajectory. Decrease statistics illustrations Red 3 D bar chart with downward trend line on white grid background graph line graph. A 3D red bar chart shows a declining trend against a white grid background. The bars decrease in height from left to right, with a red line graph following the downward trajectory
Free with trial Black and white icon of a bar graph showing a downward trend with an arrow pointing down. Decrease statistics illustrations Downward trending bar graph with arrow indicating decrease bar chart decline. Black and white icon of a bar graph showing a downward trend with an arrow pointing down
Free with trial A modern vector illustration of a line graph showing a clear decline, emphasized by a red downtrend arrow. Ideal for financial reports, business presentations, or data visualization projects illustrating negative trends or decreases. This graphic effectively communicates a downward movement in statistics, vector design Generative AI. Decrease statistics vectors Declining Line Graph with Red Downtrend Arrow, vector design Generative AI. A modern vector illustration of a line graph showing a clear decline, emphasized by a red downtrend arrow. Ideal for financial reports, business presentations, or data visualization projects illustrating negative trends or decreases. This graphic effectively communicates a downward movement in statistics, vector design Generative AI
Free with trial A white line graph with connected points and a bar chart are shown within a dark gray circle icon, representing data analysis. Decrease statistics illustrations White line graph and bar chart in a dark gray circle icon data statistics. A white line graph with connected points and a bar chart are shown within a dark gray circle icon, representing data analysis
Free with trial A vibrant and modern illustration of a bar graph, featuring four bars of varying heights and colors: blue, green, orange, and red. The bars are positioned on a gray horizontal line, creating a sense of data comparison and visual hierarchy. This image is ideal for representing data, statistics, business reports, financial analysis, or any concept requiring visual data representation. The clean design and bright colors make it suitable for presentations, websites, and marketing materials. Decrease statistics illustrations Colorful Bar Graph Illustration. A vibrant and modern illustration of a bar graph, featuring four bars of varying heights and colors: blue, green, orange, and red. The bars are positioned on a gray horizontal line, creating a sense of data comparison and visual hierarchy. This image is ideal for representing data, statistics, business reports, financial analysis, or any concept requiring visual data representation. The clean design and bright colors make it suitable for presentations, websites, and marketing materials.
Free with trial Set of six black business charts icons showing growth and decline trends with arrows and bars in vector style clear and simple design calm. Generative AI. Decrease statistics vectors Business growth and decline charts arrows statistics bar graph icons vector illustration. Set of six black business charts icons showing growth and decline trends with arrows and bars in vector style clear and simple design calm. Generative AI
Free with trial This vector illustration features a set of two minimalist graphs depicting a significant decline. Each graph includes a downward-sloping line chart with an accompanying filled area, clearly indicating a negative trend. One version is presented in black on a white background, while the other is white on a black background, offering versatile usage. This icon is ideal for illustrating concepts of business loss, economic recession, market downturns, financial crisis, poor performance, or any data showing a decrease. Perfect for presentations, reports, infographics, and web design. Decrease statistics vectors Declining Business Graph Icon Set - Negative Trend Chart. This vector illustration features a set of two minimalist graphs depicting a significant decline. Each graph includes a downward-sloping line chart with an accompanying filled area, clearly indicating a negative trend. One version is presented in black on a white background, while the other is white on a black background, offering versatile usage. This icon is ideal for illustrating concepts of business loss, economic recession, market downturns, financial crisis, poor performance, or any data showing a decrease. Perfect for presentations, reports, infographics, and web design.
Free with trial A red downward arrow and a red bar chart showing a decline are presented on a white background. Decrease statistics illustrations Red Downward Arrow and Bar Chart Symbolizing Decrease and Decline Keywords: decrease, decline, down, arrow, bar. A red downward arrow and a red bar chart showing a decline are presented on a white background
Free with trial A visual representation of a financial or business trend showing a steady decrease over time. The bar chart illustrates negative performance with a prominent downward arrow. Decrease statistics illustrations Declining bar chart showing downward trend with arrow. A visual representation of a financial or business trend showing a steady decrease over time. The bar chart illustrates negative performance with a prominent downward arrow
Free with trial A series of seven golden, metallic bars are arranged in a descending order, forming a bar chart that illustrates a significant decline. The bars are highly reflective, catching the light and emphasizing their three-dimensional form. The chart is presented in isolation against a pure white background, making the visual representation of a downward trend clear and impactful. Decrease statistics illustrations Golden Bar Chart Showing a Steep Decline on White Background graph statistics. A series of seven golden, metallic bars are arranged in a descending order, forming a bar chart that illustrates a significant decline. The bars are highly reflective, catching the light and emphasizing their three-dimensional form. The chart is presented in isolation against a pure white background, making the visual representation of a downward trend clear and impactful
Free with trial A simple black silhouette of a bar chart with varying heights on a white background. The icon represents data analysis and statistical representation. Decrease statistics vectors Bar chart icon for data analysis and statistics graph. A simple black silhouette of a bar chart with varying heights on a white background. The icon represents data analysis and statistical representation
Free with trial Black down arrows and horizontal bars arranged vertically on a white background. Clear details and vibrant col. Decrease statistics illustrations Black down arrows and horizontal bars on white background descending decrease. Black down arrows and horizontal bars arranged vertically on a white background. Clear details and vibrant col
Free with trial A black curved line graph showing a downward trend on a white background. Clear details and vibrant colors enh. Decrease statistics illustrations Black curved line graph showing decrease on white background chart decreasing. A black curved line graph showing a downward trend on a white background. Clear details and vibrant colors enh
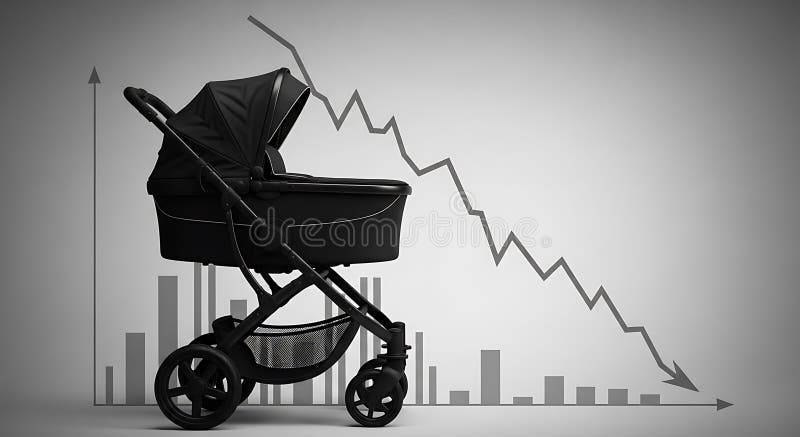
Free with trial A stark visual representation of demographic decline featuring a baby carriage silhouetted against a backdrop of a downward-trending graph and bar charts, symbolizing falling birth rates and. Decrease statistics illustrations Demographic Decline Baby Carriage with Downturn Graph and Population Decrease Concept. A stark visual representation of demographic decline featuring a baby carriage silhouetted against a backdrop of a downward-trending graph and bar charts, symbolizing falling birth rates and
Free with trial A black icon of a graph with a downward sloping curve and an arrow indicating decrease. Decrease statistics illustrations Black graph showing a downward trend with an arrow and Y axis label chart data. A black icon of a graph with a downward sloping curve and an arrow indicating decrease
Free with trial The image depicts a bar graph with a downward trend. The bars start high on the left and progressively decrease in height towards the right. A large red downward arrow further emphasizes the declining trend. Decrease statistics vectors Decreasing trend in bar graph. The image depicts a bar graph with a downward trend. The bars start high on the left and progressively decrease in height towards the right. A large red downward arrow further emphasizes the declining trend
Free with trial A crisp, minimalist black percentage sign icon enclosed within a bold black circle, set against a clean white background. This flat vector illustration represents concepts such as discounts, sales, interest rates, statistics, and proportions. Its simple, modern design makes it highly versatile for various applications, including web and app interfaces, marketing materials, financial reports, e-commerce promotions, and infographics. Ideal for conveying numerical data, special offers, or mathematical concepts with clarity and impact. Decrease statistics illustrations Percentage Sign Icon in Circle. A crisp, minimalist black percentage sign icon enclosed within a bold black circle, set against a clean white background. This flat vector illustration represents concepts such as discounts, sales, interest rates, statistics, and proportions. Its simple, modern design makes it highly versatile for various applications, including web and app interfaces, marketing materials, financial reports, e-commerce promotions, and infographics. Ideal for conveying numerical data, special offers, or mathematical concepts with clarity and impact.
Free with trial A bold red arrow with a zigzag pattern points downwards, symbolizing a negative trend, loss, or decrease. Decrease statistics vectors Red arrow indicating downward trend or decline. A bold red arrow with a zigzag pattern points downwards, symbolizing a negative trend, loss, or decrease
Free with trial Sad face and falling graph with data points overlaid on a grid, soundwave, and musical note. Ideal for emotion analysis, music trends, negative data, audio, feedback statistics research. Simple. Decrease statistics vectors Declining Music Note Graph Representing Negative Sentiment and Audio Analysis. Sad face and falling graph with data points overlaid on a grid, soundwave, and musical note. Ideal for emotion analysis, music trends, negative data, audio, feedback statistics research. Simple
Free with trial A black silhouette of a bar chart with a vertical scale and grid lines, representing data analysis. Decrease statistics illustrations Black bar chart icon with grid lines and scale on white background graph statistics. A black silhouette of a bar chart with a vertical scale and grid lines, representing data analysis
Free with trial Downward arrow, dollar coin, and bar chart showing data. Ideal for finance, economy, loss, budget, analysis statistics and crisis. Flat simple metaphor. Decrease statistics vectors Declining Financial Trends Represented by Down Arrow, Dollar Coin, and Bar Chart. Downward arrow, dollar coin, and bar chart showing data. Ideal for finance, economy, loss, budget, analysis statistics and crisis. Flat simple metaphor
Free with trial A 3D rendered bar chart illustrates a decreasing trend. The bars, colored in a gradient from yellow to purple, represent data points that are diminishing in value. Placed on a simple gray base, the chart is isolated against a white background. This image is suitable for illustrating concepts related to business, finance, statistics, and economic downturns. Decrease statistics illustrations 3D Bar Chart Decreasing Trend. A 3D rendered bar chart illustrates a decreasing trend. The bars, colored in a gradient from yellow to purple, represent data points that are diminishing in value. Placed on a simple gray base, the chart is isolated against a white background. This image is suitable for illustrating concepts related to business, finance, statistics, and economic downturns.
Free with trial Bar graph showing decreasing values alongside arrows moving toward a minimal cloud. Ideal for data analysis, statistics, regression, performance tracking, economy, analytics, simple flat metaphor. Decrease statistics vectors Declining Bar Chart with Arrows and Cloud Representing Regression or Data Flow. Bar graph showing decreasing values alongside arrows moving toward a minimal cloud. Ideal for data analysis, statistics, regression, performance tracking, economy, analytics, simple flat metaphor
Free with trial Two flat design icons with color. One depicts an upward bar chart with a blue arrow and percentage, the other a downward bar chart with a grey arrow and percentage. Decrease statistics vectors Color Bar Chart Icons for Increase and Decrease graph Ai-Generated. Two flat design icons with color. One depicts an upward bar chart with a blue arrow and percentage, the other a downward bar chart with a grey arrow and percentage
Free with trial A compelling visual representation of declining retail sales or consumer spending, featuring a large green shopping bag alongside three progressively smaller white shopping bags. A prominent red arrow graphically illustrates a downward trend, symbolizing a decrease in market demand, economic downturn, or business loss. This 3D rendered image on a clean white background is ideal for financial reports, economic analysis, business presentations, or articles discussing retail challenges, recession, or reduced purchasing power. Decrease statistics illustrations Retail Sales Decline Concept with Shopping Bags and Downward Arrow. A compelling visual representation of declining retail sales or consumer spending, featuring a large green shopping bag alongside three progressively smaller white shopping bags. A prominent red arrow graphically illustrates a downward trend, symbolizing a decrease in market demand, economic downturn, or business loss. This 3D rendered image on a clean white background is ideal for financial reports, economic analysis, business presentations, or articles discussing retail challenges, recession, or reduced purchasing power.
Free with trial A 3D icon features a blue pound sterling symbol within a white circle, which is bordered by a light blue ring. To the right of the circle, a small orange circle contains a white downward-pointing triangle, indicating a decrease or fall. The icon is presented on a clean white background with a subtle shadow. Decrease statistics illustrations 3D Icon with Pound Sterling Symbol and Downward Arrow on White Background currency money. A 3D icon features a blue pound sterling symbol within a white circle, which is bordered by a light blue ring. To the right of the circle, a small orange circle contains a white downward-pointing triangle, indicating a decrease or fall. The icon is presented on a clean white background with a subtle shadow
Free with trial Vibrant financial decisions shown through floating digital market charts --chaos 55 --ar 16:9 --profile 8vfa4lb --v 7 Job ID: 73c43520-d3ac-4d75-940e-9fab8db6f1ed. Generative AI. Decrease statistics illustrations Red Arrow Decrease on Stock Market Graph Showing Economic Downturn and Financial Decline. Vibrant financial decisions shown through floating digital market charts --chaos 55 --ar 16:9 --profile 8vfa4lb --v 7 Job ID: 73c43520-d3ac-4d75-940e-9fab8db6f1ed. Generative AI
Free with trial Isolated showing simple line graph showing downward trend on white background keywords: graph, chart, line graph, downward trend, decline, decrease. Decrease statistics illustrations Simple Line Graph Showing Downward Trend on White Background Keywords: graph, chart, line graph, downward trend
Free with trial This image features a bar graph with red bars indicating a downward trend. The graph is isolated on a white background, making the red bars and the downward arrow clearly visible. The image is suitable for representing declining metrics or statistics. Decrease statistics illustrations Decreasing bar graph isolated on white background. This image features a bar graph with red bars indicating a downward trend. The graph is isolated on a white background, making the red bars and the downward arrow clearly visible. The image is suitable for representing declining metrics or statistics
Free with trial A vibrant, flat-design illustration depicts a bar graph with a downward-trending arrow, suggesting a decline in data. The graph features bars in red, yellow, green, and blue, set against a clean white background. The composition is simple, yet conveys a clear message of financial or performance decrease. Decrease statistics illustrations Colorful Bar Graph with Declining Trend and Arrows, Business Concept. A vibrant, flat-design illustration depicts a bar graph with a downward-trending arrow, suggesting a decline in data. The graph features bars in red, yellow, green, and blue, set against a clean white background. The composition is simple, yet conveys a clear message of financial or performance decrease
Free with trial A visual representation of contrasting directions using prominent green and red arrows, symbolizing growth and decline, increase and decrease, essential for data and trend analysis. Decrease statistics illustrations Green and red arrows facing each other on isolated on white background. A visual representation of contrasting directions using prominent green and red arrows, symbolizing growth and decline, increase and decrease, essential for data and trend analysis
Free with trial An upward trending line graph showcases data points increasing, symbolizing growth and progress. The visual represents success, development, and positive statistics. Decrease statistics vectors Positive Trend Graph, Data Points Rising Upward. An upward trending line graph showcases data points increasing, symbolizing growth and progress. The visual represents success, development, and positive statistics.
Free with trial A red line graph with data points illustrating a downward trend over time, suggesting a decrease in measured values. Decrease statistics illustrations Declining Trend in Data Analysis Representation. a red line graph with data points illustrating a downward trend over time, suggesting a decrease in measured values
Free with trial A simple red line graph showing a sharp downward trend with an arrow indicating a significant decrease, symbolizing loss or decline in performance. Decrease statistics illustrations Red downward trending graph isolated on white background. A simple red line graph showing a sharp downward trend with an arrow indicating a significant decrease, symbolizing loss or decline in performance
Free with trial A simple red line graph showing a sharp downward trend, indicating a significant decrease or loss in value, isolated against a clean white background for clarity. Decrease statistics illustrations Red downward trending graph isolated on white background. A simple red line graph showing a sharp downward trend, indicating a significant decrease or loss in value, isolated against a clean white background for clarity
Free with trial A graphic representing a 50 percent reduction or decline, depicted by a red arrow and percentage. Decrease statistics illustrations Red downward arrow indicating 50 percent decrease within a curved arc. A graphic representing a 50 percent reduction or decline, depicted by a red arrow and percentage
Free with trial This graphic features two distinct 3D arrows. A vibrant green arrow points upward, symbolizing increase, progress, or positive movement. Alongside it, a bold red arrow points downward, indicating a decrease, decline, or negative trend. Decrease statistics illustrations Green up arrow and red down arrow symbols representing growth and decline finances or data white background. This graphic features two distinct 3D arrows. A vibrant green arrow points upward, symbolizing increase, progress, or positive movement. Alongside it, a bold red arrow points downward, indicating a decrease, decline, or negative trend
Free with trial This image is a simple vector graphic depicting a downward trending line graph. The graph is enclosed in a square with a bold black border and shows a blue line indicating a decrease in values over ti. Decrease statistics illustrations Downward Trend Graph, Data Decline Icon. This image is a simple vector graphic depicting a downward trending line graph. The graph is enclosed in a square with a bold black border and shows a blue line indicating a decrease in values over ti
Free with trial This image is a simple vector graphic depicting a downward trending line graph. The graph is enclosed in a square with a bold black border and shows a blue line indicating a decrease in values over ti. Decrease statistics illustrations Downward Trend Graph, Data Decline Icon. This image is a simple vector graphic depicting a downward trending line graph. The graph is enclosed in a square with a bold black border and shows a blue line indicating a decrease in values over ti
Free with trial Colorful bar chart illustrating a gradual decrease against a transparent background, highlighting a decline in data and signaling a negative financial trend or recession. Decrease statistics vectors Bar chart gradually decreasing with transparent background. Colorful bar chart illustrating a gradual decrease against a transparent background, highlighting a decline in data and signaling a negative financial trend or recession
Free with trial This infographic displays a bar graph illustrating a sharp negative trend. The red line clearly depicts a significant decrease, showcasing concepts like downturn, recession, and loss within a business or financial context. Ideal for presentations, reports, and analyses highlighting negative market trends or economic decline, generated by AI. Decrease statistics illustrations Decreasing bar graph showing negative trend decline. This infographic displays a bar graph illustrating a sharp negative trend. The red line clearly depicts a significant decrease, showcasing concepts like downturn, recession, and loss within a business or financial context. Ideal for presentations, reports, and analyses highlighting negative market trends or economic decline, generated by AI.
Free with trial A line graph illustrates a steady decline in values, featuring a blue line dropping toward a bright red arrow indicating a significant downward trend over time. Decrease statistics illustrations Declining trend in data representation shows significant decrease over time. A line graph illustrates a steady decline in values, featuring a blue line dropping toward a bright red arrow indicating a significant downward trend over time.
Free with trial A sharp red arrow points downwards, illustrating a significant decrease or failure. This visual metaphor is commonly used to represent economic recession, stock market losses, or declining performance. Decrease statistics illustrations Red downward trend arrow symbolizing financial decline and market downturn. A sharp red arrow points downwards, illustrating a significant decrease or failure. This visual metaphor is commonly used to represent economic recession, stock market losses, or declining performance
Free with trial Downward line graph with sad face reflecting poor performance, folder with binary data, and cloud element. Ideal for finance, analytics, failure, statistics, digital storage, emotions simple flat. Decrease statistics illustrations Negative trend in data analysis with declining graph, sad face, and digital file management. Downward line graph with sad face reflecting poor performance, folder with binary data, and cloud element. Ideal for finance, analytics, failure, statistics, digital storage, emotions simple flat
Free with trial An illuminated downward arrow with a jagged line signifies a decline, representing negative performance and can be used to illustrate a decrease in business or any downward trend. Decrease statistics illustrations Declining Arrow Shows Downtrend and Negative Performance. An illuminated downward arrow with a jagged line signifies a decline, representing negative performance and can be used to illustrate a decrease in business or any downward trend
Free with trial A red line graph shows a steady decline in values over a period. The downward trajectory reflects a significant decrease, with data points plotted against a grid background. Decrease statistics illustrations Declining trend line illustrates significant downward movement in data over time. A red line graph shows a steady decline in values over a period. The downward trajectory reflects a significant decrease, with data points plotted against a grid background.
Free with trial This image shows a colorful 3D bar graph representing growth or progress. The bars increase in height, then decrease slightly before another sharp increase, indicating fluctuations in data. The wooden background adds a rustic and visually appealing contrast. Decrease statistics illustrations Colorful Bar Graph on Wooden Background. This image shows a colorful 3D bar graph representing growth or progress. The bars increase in height, then decrease slightly before another sharp increase, indicating fluctuations in data. The wooden background adds a rustic and visually appealing contrast.
Free with trial A bold, black downward-pointing arrow rendered in a textured, hand-drawn brush stroke or grunge style. Isolated on a clean white background, this graphic element conveys direction, download, scroll, or decrease. Its rough, artistic edges give it a dynamic and authentic feel, making it suitable for various design projects, web interfaces, mobile applications, presentations, or any content requiring a clear and impactful directional indicator with a modern, edgy aesthetic. Decrease statistics vectors Hand Drawn Grunge Style Down Arrow Icon. A bold, black downward-pointing arrow rendered in a textured, hand-drawn brush stroke or grunge style. Isolated on a clean white background, this graphic element conveys direction, download, scroll, or decrease. Its rough, artistic edges give it a dynamic and authentic feel, making it suitable for various design projects, web interfaces, mobile applications, presentations, or any content requiring a clear and impactful directional indicator with a modern, edgy aesthetic.
Free with trial A striking 3D rendering features an abstract bar graph composed of numerous translucent blue rectangular blocks against a dark, almost black, background. The varying heights of the blocks create a dynamic visual representation of data, statistics, or growth trends. This modern and futuristic design is ideal for illustrating concepts related to business, finance, technology, analytics, market research, or digital information in presentations, reports, websites, and corporate media. Decrease statistics illustrations Abstract 3D Blue Bar Graph Visualization. A striking 3D rendering features an abstract bar graph composed of numerous translucent blue rectangular blocks against a dark, almost black, background. The varying heights of the blocks create a dynamic visual representation of data, statistics, or growth trends. This modern and futuristic design is ideal for illustrating concepts related to business, finance, technology, analytics, market research, or digital information in presentations, reports, websites, and corporate media.
Free with trial A simple bar chart with a falling line, symbolizing financial decline, economic downturn, decreased profits, market loss, or negative business results. Ideal for illustrating risks, challenges, crisis situations, and economic analysis. Decrease statistics vectors Declining financial chart icon with downward trend showing loss, decrease and negative business performance. A simple bar chart with a falling line, symbolizing financial decline, economic downturn, decreased profits, market loss, or negative business results. Ideal for illustrating risks, challenges, crisis situations, and economic analysis.
Free with trial Dec fading line graph illustration data analysis, statistics visualization, slope axis dec fading line graph. Decrease statistics illustrations Dec fading line graph
Free with trial This image depicts a bar graph with a downward trend. The bars decrease in height from left to right, indicating a decline in the measured values. A red arrow at the top further emphasizes the downward direction. Decrease statistics illustrations Decreasing bar graph. This image depicts a bar graph with a downward trend. The bars decrease in height from left to right, indicating a decline in the measured values. A red arrow at the top further emphasizes the downward direction
Free with trial The image depicts a bar graph with three bars of varying heights. The first bar is the tallest, followed by a shorter blue bar, and the third bar is the shortest. A large red downward arrow is pointing from the top of the tallest bar to the shortest bar, indicating a downward trend or decrease. Decrease statistics illustrations Decreasing bar graph. The image depicts a bar graph with three bars of varying heights. The first bar is the tallest, followed by a shorter blue bar, and the third bar is the shortest. A large red downward arrow is pointing from the top of the tallest bar to the shortest bar, indicating a downward trend or decrease
Free with trial Business graph data in a bar chart showing increase and decrease with blue line illustration on plain background. Decrease statistics vectors Business graph data in a bar chart showing increase and decrease with blue line illustration on plain background
Free with trial A simple, clean graphic featuring two bold, black outline arrows on a white background. One arrow points directly upwards, symbolizing progress, increase, or ascent. The other arrow points directly downwards, representing decline, decrease, or descent. This versatile icon is ideal for representing opposing directions, choices, or data trends in various digital and print applications. Decrease statistics illustrations Up and Down Arrows Icon. A simple, clean graphic featuring two bold, black outline arrows on a white background. One arrow points directly upwards, symbolizing progress, increase, or ascent. The other arrow points directly downwards, representing decline, decrease, or descent. This versatile icon is ideal for representing opposing directions, choices, or data trends in various digital and print applications.
Free with trial A minimalist, black and white vector icon representing a bar chart or graph. The icon features a series of vertical bars of varying heights, set against a base of horizontal lines. This clean and modern design is ideal for representing data, statistics, progress, growth, or financial information in digital and print media. Its simple aesthetic makes it versatile for use in presentations, websites, apps, and infographics. Decrease statistics vectors Abstract Bar Chart Icon. A minimalist, black and white vector icon representing a bar chart or graph. The icon features a series of vertical bars of varying heights, set against a base of horizontal lines. This clean and modern design is ideal for representing data, statistics, progress, growth, or financial information in digital and print media. Its simple aesthetic makes it versatile for use in presentations, websites, apps, and infographics.
Free with trial A bold, three-dimensional red arrow is prominently displayed, pointing directly downwards. The arrow is cast against a textured, light-colored wall, creating a stark contrast. A dramatic shadow of the arrow is cast on the wall to its left, adding depth and visual interest. The lighting suggests a single light source, casting sharp shadows and highlighting the arrow's form. This image effectively symbolizes decline, decrease, failure, or a downward trend in various contexts, such as finance, business, or performance. Decrease statistics illustrations Red Arrow Pointing Downward Against Textured Wall. A bold, three-dimensional red arrow is prominently displayed, pointing directly downwards. The arrow is cast against a textured, light-colored wall, creating a stark contrast. A dramatic shadow of the arrow is cast on the wall to its left, adding depth and visual interest. The lighting suggests a single light source, casting sharp shadows and highlighting the arrow's form. This image effectively symbolizes decline, decrease, failure, or a downward trend in various contexts, such as finance, business, or performance.
Free with trial A set of four olive green percentage change icons on a white background. The icons depict arrows with percentage signs, indicating increase and decrease. The top left icon shows an upward arrow, the top right shows a downward curved arrow, and the bottom shows a circular double-headed arrow. Decrease statistics illustrations Percentage change icons
Free with trial A visual representation of market fluctuations and business performance, with a red downward arrow indicating a decrease and a green upward arrow signifying growth and positive trends. Decrease statistics illustrations Red down arrow and green up arrow symbols representing financial market trends and business growth. A visual representation of market fluctuations and business performance, with a red downward arrow indicating a decrease and a green upward arrow signifying growth and positive trends
Free with trial A vibrant red, three-dimensional zigzag arrow sharply points downwards and to the right, set against a transparent background. This striking graphic effectively symbolizes decline, loss, and negative trends across various sectors. It is ideal for illustrating financial downturns, market crashes, economic recessions, falling stock prices, or any situation depicting a decrease in performance. Perfect for business presentations, financial reports, infographics, and news articles requiring a clear visual representation of a downward trajectory or crisis. Decrease statistics illustrations Red Downward Zigzag Arrow on Transparent Background. A vibrant red, three-dimensional zigzag arrow sharply points downwards and to the right, set against a transparent background. This striking graphic effectively symbolizes decline, loss, and negative trends across various sectors. It is ideal for illustrating financial downturns, market crashes, economic recessions, falling stock prices, or any situation depicting a decrease in performance. Perfect for business presentations, financial reports, infographics, and news articles requiring a clear visual representation of a downward trajectory or crisis.
Free with trial A minimalist black icon depicting an arrow that features a distinct wavy, oscillating curve before straightening and pointing downwards. This graphic symbolizes a fluctuating decline, an unstable downward trend, or a challenging path with variations. Ideal for illustrating concepts such as market volatility, data fluctuations, difficult progress, or any process involving an unstable decrease. Isolated on a white background for versatile use in web, print, and presentations. Generated by AI. Decrease statistics vectors Black Wavy Down Arrow Icon. A minimalist black icon depicting an arrow that features a distinct wavy, oscillating curve before straightening and pointing downwards. This graphic symbolizes a fluctuating decline, an unstable downward trend, or a challenging path with variations. Ideal for illustrating concepts such as market volatility, data fluctuations, difficult progress, or any process involving an unstable decrease. Isolated on a white background for versatile use in web, print, and presentations. Generated by AI
Free with trial Circular bar chart with red upward arrow and dark gray downward arrow icon for growth and analytics featuring improvement, decrease, trend with. Decrease statistics vectors Circular bar chart with red upward arrow and dark gray downward arrow icon for growth
Free with trial A set of black icons representing percentage changes, including arrows and circular symbols. The icons depict various concepts such as decrease, increase, and rotation, all incorporating percentage signs. The simple design makes them versatile for use in financial, statistical, or educational materials. Decrease statistics illustrations Black percentage icons set. A set of black icons representing percentage changes, including arrows and circular symbols. The icons depict various concepts such as decrease, increase, and rotation, all incorporating percentage signs. The simple design makes them versatile for use in financial, statistical, or educational materials.
Free with trial A clean and modern vector illustration of a line graph, isolated on a white background. This flat design icon features two distinct lines, one blue and one brown, plotting various data points to show trends and comparisons over time. It's a versatile graphic representing concepts like data analysis, business analytics, financial statistics, market research, and performance tracking. Ideal for use in presentations, infographics, websites, business reports, and marketing materials to visualize progress, growth, or economic fluctuations. Decrease statistics vectors Data Analysis Line Graph Icon. A clean and modern vector illustration of a line graph, isolated on a white background. This flat design icon features two distinct lines, one blue and one brown, plotting various data points to show trends and comparisons over time. It's a versatile graphic representing concepts like data analysis, business analytics, financial statistics, market research, and performance tracking. Ideal for use in presentations, infographics, websites, business reports, and marketing materials to visualize progress, growth, or economic fluctuations.
Free with trial A clean, minimalist illustration featuring a combined line graph and bar chart on a white background. The line graph, with circular data points, shows an upward trend with fluctuations. It is overlaid on a series of vertical bars, alternating in black and white, representing discrete data values. The grid lines behind the charts suggest a data analysis or financial context. This graphic is ideal for presentations, reports, and websites related to statistics, business growth, market trends, and data visualization. Decrease statistics vectors Line and Bar Chart Combination. A clean, minimalist illustration featuring a combined line graph and bar chart on a white background. The line graph, with circular data points, shows an upward trend with fluctuations. It is overlaid on a series of vertical bars, alternating in black and white, representing discrete data values. The grid lines behind the charts suggest a data analysis or financial context. This graphic is ideal for presentations, reports, and websites related to statistics, business growth, market trends, and data visualization.
Free with trial This minimalist vector illustration depicts a line chart indicating a negative performance or decline. The design features a clean blue line with circular data points connected by segments, ending in a sharp red arrow pointing downwards. The background is a soft, neutral shade, emphasizing the clear visual representation of financial loss or decreasing statistics. Decrease statistics vectors A simple line graph showing a downward trend with a red arrow. This minimalist vector illustration depicts a line chart indicating a negative performance or. This minimalist vector illustration depicts a line chart indicating a negative performance or decline. The design features a clean blue line with circular data points connected by segments, ending in a sharp red arrow pointing downwards. The background is a soft, neutral shade, emphasizing the clear visual representation of financial loss or decreasing statistics