Free with trial Growth scanning revenue chart illustration decline forecast, data performance, metrics visualization growth scanning revenue chart. Decrease statistics illustrations Growth scanning revenue chart
Free with trial Flat icons related to financial transactions pertaining to business or personal both. Very well crafted business and finance icons set to be used in related projects. Grab this pack and enjoy designing. Decrease statistics illustrations Set of Business and Finance Flat Icons. Flat icons related to financial transactions pertaining to business or personal both. Very well crafted business and finance icons set to be used in related projects. Grab this pack and enjoy designing
Free with trial Area chart graph is going down showing market volatility. Decrease statistics vectors Red area chart graph showing market volatility going down. Area chart graph is going down showing market volatility
Free with trial This image showcases a dynamic data visualization, generated by AI, depicting a flowing wave pattern over a gridded background. The abstract design uses cool blue tones and suggests growth, movement, or change in data trends. The wave's form is both aesthetically pleasing and symbolic of complex in. Decrease statistics illustrations Abstract Data Wave. This image showcases a dynamic data visualization, generated by AI, depicting a flowing wave pattern over a gridded background. The abstract design uses cool blue tones and suggests growth, movement, or change in data trends. The wave's form is both aesthetically pleasing and symbolic of complex in
Free with trial A 3D rendering showing stacks of coins under a magnifying glass focusing on a bar graph, generated by AI. This image symbolizes financial analysis, investment, and wealth management. It's perfect for illustrating articles or presentations related to economic trends and monetary growth. Decrease statistics illustrations Financial Analysis Magnifier. A 3D rendering showing stacks of coins under a magnifying glass focusing on a bar graph, generated by AI. This image symbolizes financial analysis, investment, and wealth management. It's perfect for illustrating articles or presentations related to economic trends and monetary growth.
Free with trial Hand drawn charts and clock showing business growth and speed. Decrease statistics illustrations Business Growth Speed Concept. Hand drawn charts and clock showing business growth and speed
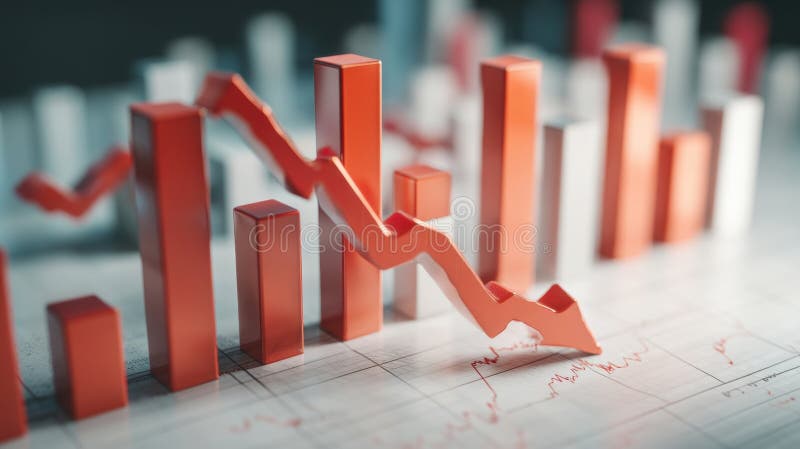
Free with trial This image depicts a dramatic stock market decline, visualized as a falling graph in intense orange and red hues, generated by AI. The dark background emphasizes the severity of the downturn, suggesting potential financial instability or market volatility. The bokeh effect adds a sense of depth and. Decrease statistics illustrations AI-Generated Stock Market Dip. This image depicts a dramatic stock market decline, visualized as a falling graph in intense orange and red hues, generated by AI. The dark background emphasizes the severity of the downturn, suggesting potential financial instability or market volatility. The bokeh effect adds a sense of depth and
Free with trial This image shows a 3D rendering of a red line graph sharply declining, resting on a white cube. The graphic is generated by AI, and visually represents a negative trend or downturn, suitable for presentations or reports on market analysis, economic forecasts, or business performance. Decrease statistics illustrations Declining Trend Visualization. This image shows a 3D rendering of a red line graph sharply declining, resting on a white cube. The graphic is generated by AI, and visually represents a negative trend or downturn, suitable for presentations or reports on market analysis, economic forecasts, or business performance.
Free with trial A tablet displays a colorful bar graph, showcasing data trends. The image emphasizes visual data analysis and modern business tools. The warm wood background adds a professional yet inviting feel. Decrease statistics illustrations Tablet Showing Business Graph. A tablet displays a colorful bar graph, showcasing data trends. The image emphasizes visual data analysis and modern business tools. The warm wood background adds a professional yet inviting feel.
Free with trial Hold positions during downturn in market activity, look into future to plan further actions, search for strategy for company operation during economic instability, man with umbrella on arrows on graph. Decrease statistics vectors Man with umbrella on arrows on graph
Free with trial Financial and economic improvement during stock market crash, stabilization of foreign currency, financial instruments to increase income, fight against inflation, woman holding umbrella over dollar. Decrease statistics vectors Woman holding umbrella over dollar
Free with trial Hold positions during downturn in market activity, look into future to plan further actions, search for strategy for company's operation during economic instability, man with umbrella on falling graph. Decrease statistics vectors Man with umbrella on falling graph
Free with trial A hand holds a piece of paper with a simple line graph, possibly representing data or a trend, generated by AI. The minimalist design emphasizes the visual simplicity and the concept of data representation. The image could be used to illustrate various concepts related to progress, decline, or chan. Decrease statistics illustrations Hand Holding Simple Line Graph. A hand holds a piece of paper with a simple line graph, possibly representing data or a trend, generated by AI. The minimalist design emphasizes the visual simplicity and the concept of data representation. The image could be used to illustrate various concepts related to progress, decline, or chan
Free with trial Vector illustration of 2D (two dimensional) x and y cartesian axes with a graph of a parabola. Decrease statistics vectors Cartesian axis 2D graph parabola. Vector illustration of 2D (two dimensional) x and y cartesian axes with a graph of a parabola
Free with trial This image depicts a long line of miniature people following a downward trending stock market graph, generated by AI. It visually represents economic downturn and its impact on a large population. The contrast between the dense crowd and the falling graph is striking. Decrease statistics illustrations People and Stock Market Decline. This image depicts a long line of miniature people following a downward trending stock market graph, generated by AI. It visually represents economic downturn and its impact on a large population. The contrast between the dense crowd and the falling graph is striking.
Free with trial Loss money arrow bar graph icon on white background depicting financial decline. Decrease statistics illustrations Loss money arrow bar graph icon
Free with trial Analysis replicating sales graph illustration trends visualization, performance growth, revenue forecasting analysis replicating sales graph. Decrease statistics illustrations Analysis replicating sales graph
Free with trial A 3D bar chart illustrating financial data with green bars indicating growth and red bars indicating decline, presented in a clean visual format for analysis. Decrease statistics illustrations Bar chart growth and decline on. A 3D bar chart illustrating financial data with green bars indicating growth and red bars indicating decline, presented in a clean visual format for analysis
Free with trial This image shows a simple isometric bar graph, generated by AI. It features four black bars of varying heights against a white background, suitable for use as a minimalist graphic or logo. The clean design allows for versatile application in various contexts. Decrease statistics illustrations AI-Generated Isometric Bar Graph. This image shows a simple isometric bar graph, generated by AI. It features four black bars of varying heights against a white background, suitable for use as a minimalist graphic or logo. The clean design allows for versatile application in various contexts.
Free with trial A minimalist, flat design illustration of a bar chart featuring three vertical bars of varying heights. The bars are colored in orange, teal, and a lighter orange, set against a clean white background. This graphic represents data visualization, trends, and comparisons, suitable for business reports, educational materials, or web design elements. Decrease statistics illustrations Simple Bar Chart with Three Bars. A minimalist, flat design illustration of a bar chart featuring three vertical bars of varying heights. The bars are colored in. A minimalist, flat design illustration of a bar chart featuring three vertical bars of varying heights. The bars are colored in orange, teal, and a lighter orange, set against a clean white background. This graphic represents data visualization, trends, and comparisons, suitable for business reports, educational materials, or web design elements.
Free with trial View of Graphs showing declining CO₂ emissions. Decrease statistics illustrations Graphs showing declining CO₂ emissions
Free with trial View of Graphs showing declining CO₂ emissions. Decrease statistics illustrations Graphs showing declining CO₂ emissions
Free with trial View of Graphs showing declining CO₂ emissions. Decrease statistics illustrations Graphs showing declining CO₂ emissions
Free with trial Downward arrow on blue bar chart. Decrease statistics illustrations Downward arrow on blue bar chart
Free with trial A symbolic illustration representing a journey's downturn or a business decline. Decrease statistics vectors Mountain Path Decline Arrow Icon. A symbolic illustration representing a journey's downturn or a business decline
Free with trial A conceptual illustration showing a financial bar chart in a steep decline. Decrease statistics vectors Declining Green Growth Bar Chart. A conceptual illustration showing a financial bar chart in a steep decline
Free with trial This image showcases six vibrant icons representing various data visualization methods, including pie charts, bar graphs, and gauges. These colorful and engaging visuals are perfect for presentations or reports and were generated by AI. They offer a quick and easy way to represent data in a clear a. Decrease statistics illustrations Colorful Data Visualization Icons. This image showcases six vibrant icons representing various data visualization methods, including pie charts, bar graphs, and gauges. These colorful and engaging visuals are perfect for presentations or reports and were generated by AI. They offer a quick and easy way to represent data in a clear a
Free with trial Visualization blinking sales graph illustration performance revenue, metrics dashboard, insights forecast visualization blinking sales graph. Decrease statistics illustrations Visualization blinking sales graph
Free with trial Isometric bar graph with decreasing trend shows negative financial results with dollar bills and coins, representing economic downturn and financial crisis. Decrease statistics vectors Isometric bar graph with decreasing trend shows negative financial results with dollar bills and coins, representing
Free with trial Bars down icon Thin outline art symbol vector logo thin line. Decrease statistics vectors Bars down icon Thin outline art symbol
Free with trial Businessman Analyzing Declining Red Bar Chart. High quality illustration. Decrease statistics illustrations Businessman Analyzing Declining Red Bar Chart
Free with trial A stylized illustration depicts a bar chart with blue bars of varying heights against a dark blue grid background. A prominent red and yellow arrow, symbolizing a downward trend, dramatically descends across the chart. This graphic represents financial decline, market crash, economic recession, or negative growth. Its clean, vector-style design makes it suitable for presentations, reports, and articles on business, finance, and economics. Decrease statistics illustrations Declining Bar Chart with Red Arrow. A stylized illustration depicts a bar chart with blue bars of varying heights against a dark blue grid background. A prominent red and yellow arrow, symbolizing a downward trend, dramatically descends across the chart. This graphic represents financial decline, market crash, economic recession, or negative growth. Its clean, vector-style design makes it suitable for presentations, reports, and articles on business, finance, and economics.
Free with trial Downward trend arrow and percentage symbol isolated on a white background, representing financial or economic decline. 3D Rendering. Decrease statistics illustrations Downward trend arrow and percentage symbol on a white background. 3D Rendering. Downward trend arrow and percentage symbol isolated on a white background, representing financial or economic decline. 3D Rendering
Free with trial Risky choice of strategy or development path,achieve high results through hard work despite obstacles,achieve your goals in a highly competitive environment,people add cubes with the letters risk. Decrease statistics vectors People add cubes with the letters risk
Free with trial Loss chart icon Thin outline art symbol vector logo thin line. Decrease statistics vectors Loss chart icon Thin outline art symbol
Free with trial A visual representation of a business downturn. This blue bar chart with a descending arrow illustrates a period of negative growth, financial loss, or economic recession. Decrease statistics vectors Business Decline Graph Vector Icon. A visual representation of a business downturn. This blue bar chart with a descending arrow illustrates a period of negative growth, financial loss, or economic recession
Free with trial A city street depicts an economic downturn. People walk past closed shops, a bar chart shows a sharp decline. Decrease statistics illustrations Economic Downturn: A City in Decline. A city street depicts an economic downturn. People walk past closed shops, a bar chart shows a sharp decline
Free with trial Downward arrow and declining stock chart on light background, representing financial crisis, market crash, and economic recession. 3D Rendering. Decrease statistics illustrations Financial market collapse with downward arrow and declining chart. 3D Rendering. Downward arrow and declining stock chart on light background, representing financial crisis, market crash, and economic recession. 3D Rendering
Free with trial Close-up of a digital stock market ticker showing share symbols, prices, percentage changes, and market index performance. The display features rising and falling stocks, market fluctuations, and trading data. Ideal for financial concepts, investment visuals, stock exchange, market trends, trading platforms, finance news, economic reports, and financial presentations. Decrease statistics illustrations . Close-up of a digital stock market ticker showing share symbols, prices, percentage changes, and market index performance. The display features rising and falling stocks, market fluctuations, and trading data. Ideal for financial concepts, investment visuals, stock exchange, market trends, trading platforms, finance news, economic reports, and financial presentations.
Free with trial This image showcases a downward trending graph, generated by AI, represented by a red arrow descending within a transparent glass structure. The visual effectively communicates decline or negative growth. The clean, minimalist design enhances the impact of the falling trend. Decrease statistics illustrations Decreasing Trend: AI-Generated Graph. This image showcases a downward trending graph, generated by AI, represented by a red arrow descending within a transparent glass structure. The visual effectively communicates decline or negative growth. The clean, minimalist design enhances the impact of the falling trend.
Free with trial Conceptual image illustrating digital property management. A miniature house sits in a shopping cart, symbolizing the purchase or management of real estate. A tablet displays property management apps and data, while a holographic interface shows charts and information. This image conveys the use of technology in modern real estate and property management. Decrease statistics illustrations Digital Property Management Concept. Conceptual image illustrating digital property management. A miniature house sits in a shopping cart, symbolizing the purchase or management of real estate. A tablet displays property management apps and data, while a holographic interface shows charts and information. This image conveys the use of technology in modern real estate and property management.
Free with trial This vibrant illustration depicts financial growth, showcasing a dramatic upward trend after an initial decline. The 3D bar chart and upward arrow, generated by AI, symbolize overcoming challenges and achieving significant financial success. The gold coin further emphasizes the positive outcome. Decrease statistics illustrations AI-Generated Financial Growth Chart. This vibrant illustration depicts financial growth, showcasing a dramatic upward trend after an initial decline. The 3D bar chart and upward arrow, generated by AI, symbolize overcoming challenges and achieving significant financial success. The gold coin further emphasizes the positive outcome.
Free with trial Stabilizing economy during stock market downturn, financial improvement, finding survival strategy during crisis, solving problems of declining business value, man balancing on falling stack of coins. Decrease statistics vectors Man balancing on falling stack of coins
Free with trial A striking white sculpture, generated by AI, depicts a figure slumping as a descending graph dramatically falls to the ground, symbolizing market downturn or economic crisis. The stark contrast between the white sculpture and the gray background emphasizes the gravity of the situation. The image i. Decrease statistics illustrations AI-Generated Sculpture: Market Crash. A striking white sculpture, generated by AI, depicts a figure slumping as a descending graph dramatically falls to the ground, symbolizing market downturn or economic crisis. The stark contrast between the white sculpture and the gray background emphasizes the gravity of the situation. The image i
Free with trial The image shows a series of colorful wooden blocks arranged in ascending order of height, resembling a bar graph. the blocks are placed on a weathered wooden surface, adding a rustic and natural feel to the composition. the colors of the blocks range from orange to purple, creating a visually appealing gradient. the background is blurred, suggesting an outdoor setting with natural light filtering through. the focus is on the blocks, highlighting their texture and the interplay of colors. Decrease statistics illustrations Colorful wooden blocks on rustic wood surface. the image shows a series of colorful wooden blocks arranged in ascending order of height, resembling a bar graph. the blocks are placed on a weathered wooden surface, adding a rustic and natural feel to the composition. the colors of the blocks range from orange to purple, creating a visually appealing gradient. the background is blurred, suggesting an outdoor setting with natural light filtering through. the focus is on the blocks, highlighting their texture and the interplay of colors.
Free with trial Checklist line icon. Neumorphic, Green gradient, 3d pin buttons. Graph chart sign. Growth diagram symbol. Line icons. Neumorphic buttons with outline signs. Vector. Decrease statistics vectors Checklist line icon. Graph chart sign. Line icons. Vector. Checklist line icon. Neumorphic, Green gradient, 3d pin buttons. Graph chart sign. Growth diagram symbol. Line icons. Neumorphic buttons with outline signs. Vector
Free with trial Decreasing bar graph behind magnifying glass. 3d render. Decrease statistics illustrations Decreasing bar graph behind magnifying glass
Free with trial Abstract 3D rendering of a blue bar chart receding into the distance. The bars are arranged in descending order, suggesting a decline or downward trend. The reflective surface adds depth and visual interest, creating a clean and modern aesthetic. This image can be used to illustrate concepts such as financial downturn, market analysis, or statistical data representation. Decrease statistics illustrations Abstract Blue Bar Chart. Abstract 3D rendering of a blue bar chart receding into the distance. The bars are arranged in descending order, suggesting a decline or downward trend. The reflective surface adds depth and visual interest, creating a clean and modern aesthetic. This image can be used to illustrate concepts such as financial downturn, market analysis, or statistical data representation.
Free with trial This image depicts a 3D rendering of a downward trending graph, generated by AI, showcasing a clear visual representation of market decline or economic downturn. The red bars and arrow emphasize the severity of the fall, suggesting potential financial instability or crisis. Decrease statistics illustrations Declining Market Trends. This image depicts a 3D rendering of a downward trending graph, generated by AI, showcasing a clear visual representation of market decline or economic downturn. The red bars and arrow emphasize the severity of the fall, suggesting potential financial instability or crisis.
Free with trial Strategy for surviving economic crisis, finding way out of business problems, maintaining financial position during stock market crash, risky investments, man tries not to fall from growing arrow. Decrease statistics vectors Man tries not to fall from growing arrow
Free with trial Line graph is representing market trend with data points. Decrease statistics vectors Line graph showing market trend with data points. Line graph is representing market trend with data points
Free with trial Graphic illustration of a downward trending red arrow over blue and red vertical bar graph on a light grey background. Image. Decrease statistics illustrations Bar Graph with Decreasing Trend Line. Graphic illustration of a downward trending red arrow over blue and red vertical bar graph on a light grey background. Image
Free with trial Strategic Decisions: Integrating Business Analytics with Strategic Thinking. This visual portrays the dynamic interaction between business analytics and strategic thinking, showcasing how analytical insights drive strategic planning and decision-making. It emphasizes the synergy between data analysis and strategic foresight in achieving business goals. --chaos 10 --ar 16:9 --style raw --stylize, immersive wallpaper background. Decrease statistics illustrations Hand Drawn Colorful Bar Charts and Pie Charts. Strategic Decisions: Integrating Business Analytics with Strategic Thinking. This visual portrays the dynamic interaction between business analytics and strategic thinking, showcasing how analytical insights drive strategic planning and decision-making. It emphasizes the synergy between data analysis and strategic foresight in achieving business goals. --chaos 10 --ar 16:9 --style raw --stylize, immersive wallpaper background
Free with trial Flat icons related to financial transactions pertaining to business or personal both. Very well crafted finance icons set to be used in related projects. Grab this pack and enjoy designing. Decrease statistics vectors Set of Finance Flat Icons. Flat icons related to financial transactions pertaining to business or personal both. Very well crafted finance icons set to be used in related projects. Grab this pack and enjoy designing
Free with trial Collection of red infographic elements including charts, graphs, diagrams and icons. Perfect for presentations, reports, and data visualization. Clean, modern design. Decrease statistics illustrations Red Infographic Elements
Free with trial A worrying business report showing a sharp decline, generated by AI, rests on a wooden desk in an office setting. The red graph line dramatically falls, symbolizing potential losses or market downturn. This AI-generated image is perfect for illustrating financial instability or economic crisis. Decrease statistics illustrations Declining Business Graph. A worrying business report showing a sharp decline, generated by AI, rests on a wooden desk in an office setting. The red graph line dramatically falls, symbolizing potential losses or market downturn. This AI-generated image is perfect for illustrating financial instability or economic crisis.
Free with trial Financial chart with red and orange bars on a dark background. Concept of market crash, recession, and falling stock index. 3D Rendering. Decrease statistics illustrations Financial chart displaying a downward trend with red and orange bars. 3D Rendering. Financial chart with red and orange bars on a dark background. Concept of market crash, recession, and falling stock index. 3D Rendering
Free with trial Vector illustration of a red downward trend line graph showing economic crisis, financial loss, or business decline. Concept of recession, risk, and negative performance. Decrease statistics vectors Downward trend red graph illustration. Vector illustration of a red downward trend line graph showing economic crisis, financial loss, or business decline. Concept of recession, risk, and negative performance.
Free with trial Web report line icon. Neumorphic, Red gradient, 3d pin buttons. Column graph sign. Growth diagram symbol. Line icons. Neumorphic buttons with outline signs. Vector. Decrease statistics illustrations Web report line icon. Column graph sign. Line icons. Vector. Web report line icon. Neumorphic, Red gradient, 3d pin buttons. Column graph sign. Growth diagram symbol. Line icons. Neumorphic buttons with outline signs. Vector
Free with trial Market down arrow icon symbol isolated on transparent background. Decrease statistics illustrations Market down arrow icon symbol isolated
Free with trial This simple icon depicts a line graph with one line trending upwards and one trending downwards. Decrease statistics vectors Line graph showing upward and downward trends icon. This simple icon depicts a line graph with one line trending upwards and one trending downwards
Free with trial Money graphs show growth with bars and charts rising on paper. Decrease statistics illustrations Money graphs show growth with bars and charts rising on paper
Free with trial A charming 3D render of a percentage symbol (%) composed of soft, pastel-colored elements. The two circles are rendered in a delicate pink and a calming blue, while the diagonal line is a gentle mint green. The objects have a smooth, rounded texture, suggesting a playful and approachable aesthetic. The symbol is subtly lit, casting a soft shadow on a clean white background, making it ideal for designs related to finance, sales, discounts, or any concept requiring a percentage representation with a modern and friendly feel. Decrease statistics vectors Soft Pastel Percentage Symbol 3D Render. A charming 3D render of a percentage symbol (%) composed of soft, pastel-colored elements. The two circles are rendered in a delicate pink and a calming blue, while the diagonal line is a gentle mint green. The objects have a smooth, rounded texture, suggesting a playful and approachable aesthetic. The symbol is subtly lit, casting a soft shadow on a clean white background, making it ideal for designs related to finance, sales, discounts, or any concept requiring a percentage representation with a modern and friendly feel.
Free with trial Abstract financial chart with red bars and lines representing market decline, emphasizing data analysis and economics. Generative AI. Decrease statistics illustrations Abstract financial chart with red bars and lines representing market decline, emphasizing data analysis and economics
Free with trial Graph phone line icon. Neumorphic, Red gradient, 3d pin buttons. Column chart sign. Growth diagram symbol. Line icons. Neumorphic buttons with outline signs. Vector. Decrease statistics vectors Graph phone line icon. Column chart sign. Line icons. Vector. Graph phone line icon. Neumorphic, Red gradient, 3d pin buttons. Column chart sign. Growth diagram symbol. Line icons. Neumorphic buttons with outline signs. Vector
Free with trial A bar chart representing a sharp decline makes a dramatic splash in clear water. This conceptual image visualizes a financial crisis, liquidity problems, or the impactful consequences of negative data and market failure. Decrease statistics illustrations Economic Downturn Graph Splashing Down. A bar chart representing a sharp decline makes a dramatic splash in clear water. This conceptual image visualizes a financial crisis, liquidity problems, or the impactful consequences of negative data and market failure
Free with trial Abstract financial chart with red bars and lines representing market decline, emphasizing data analysis and economics. Generative AI. Decrease statistics illustrations Abstract financial chart with red bars and lines representing market decline, emphasizing data analysis and economics
Free with trial Abstract financial chart with red bars and lines representing market decline, emphasizing data analysis and economics. Generative AI. Decrease statistics illustrations Abstract financial chart with red bars and lines representing market decline, emphasizing data analysis and economics
Free with trial This vibrant, wavy graph, generated by AI, displays data progression using a color-coded system. The gradual color shift from green to red signifies a change in values, making it ideal for representing various trends or metrics. The accompanying key provides additional clarity. Decrease statistics illustrations Colorful AI-Generated Data Visualization. This vibrant, wavy graph, generated by AI, displays data progression using a color-coded system. The gradual color shift from green to red signifies a change in values, making it ideal for representing various trends or metrics. The accompanying key provides additional clarity.
Free with trial Red and Black Line Diagram Icon. Decrease statistics vectors Loss and bars icon concept. Red and Black Line Diagram Icon
Free with trial Black and Blue Line Diagram and Report Icon. Decrease statistics illustrations Loss and bars icon concept. Black and Blue Line Diagram and Report Icon
Free with trial Uptrend and downtrend arrow icon set. Vectors. Decrease statistics illustrations Uptrend and downtrend arrow icon set. Vectors
Free with trial A versatile set of business and finance icons isolated on a white background. This collection features various data visualization elements, including bar charts, line graphs, pie charts, and diagrams. The clean, vector style represents concepts like statistical analysis, market growth, financial reporting, and economic trends. These infographic elements are perfect for presentations, business reports, websites, and marketing materials to illustrate progress, performance, and data-driven insights. Decrease statistics vectors Business and Finance Chart and Graph Icon Set. A versatile set of business and finance icons isolated on a white background. This collection features various data visualization elements, including bar charts, line graphs, pie charts, and diagrams. The clean, vector style represents concepts like statistical analysis, market growth, financial reporting, and economic trends. These infographic elements are perfect for presentations, business reports, websites, and marketing materials to illustrate progress, performance, and data-driven insights.
Free with trial Reduction chart icon set in thin line outline style and linear vector sign. Decrease statistics vectors Reduction chart icon Flat simple outline set. Reduction chart icon set in thin line outline style and linear vector sign
Free with trial Graph laptop line icon. Neumorphic, Purple gradient, 3d pin buttons. Column chart sign. Growth diagram symbol. Line icons. Neumorphic buttons with outline signs. Vector. Decrease statistics vectors Graph laptop line icon. Column chart sign. Line icons. Vector. Graph laptop line icon. Neumorphic, Purple gradient, 3d pin buttons. Column chart sign. Growth diagram symbol. Line icons. Neumorphic buttons with outline signs. Vector
Free with trial Growth chart line icon. Neumorphic, Blue gradient, 3d pin buttons. Column graph sign. Market analytics symbol. Line icons. Neumorphic buttons with outline signs. Vector. Decrease statistics vectors Growth chart line icon. Column graph sign. Line icons. Vector. Growth chart line icon. Neumorphic, Blue gradient, 3d pin buttons. Column graph sign. Market analytics symbol. Line icons. Neumorphic buttons with outline signs. Vector
Free with trial This image showcases two contrasting bar charts, constructed from red and white blocks, generated by AI. One chart depicts growth, while the other illustrates decline, offering a visual representation of opposing trends. The use of color and simple shapes makes it easily understandable. Decrease statistics illustrations AI-Generated Block Charts: Growth & Decline. This image showcases two contrasting bar charts, constructed from red and white blocks, generated by AI. One chart depicts growth, while the other illustrates decline, offering a visual representation of opposing trends. The use of color and simple shapes makes it easily understandable.
Free with trial Mobile app uninstall rate affects user retention and engagement. Tracking uninstall analytics helps optimize app performance, reduce churn, improve mobile app marketing strategies vector illustration. Decrease statistics vectors Mobile app uninstall rate affects user retention and engagement. Tracking uninstall analytics helps optimize app
Free with trial Downward Trend Financial Graph Illustration. Decrease statistics vectors Downward Trend Financial Graph Illustration
Free with trial 3D icon featuring a golden bear and a descending red arrow above blue bars, symbolizing a bearish trend in financial markets. Decrease statistics vectors Bear Market Graph with Downward Trend 3D Icon. 3D icon featuring a golden bear and a descending red arrow above blue bars, symbolizing a bearish trend in financial markets