Free with trial A bright blue, three-dimensional percentage symbol rendered in glossy glass material. The symbol is floating and casting a subtle shadow on a clean white background. Its transparent quality allows light to pass through, highlighting its smooth, rounded edges and the sharp diagonal line. Decrease statistics illustrations 3D Blue Glass Percentage Symbol Floating on White Background sign discount. A bright blue, three-dimensional percentage symbol rendered in glossy glass material. The symbol is floating and casting a subtle shadow on a clean white background. Its transparent quality allows light to pass through, highlighting its smooth, rounded edges and the sharp diagonal line
Free with trial Red and Black Line Diagram Icon. Decrease statistics vectors Investment Loss and diagram icon concept. Red and Black Line Diagram Icon
Free with trial A vibrant 3D representation of a business graph and chart, showcasing data analysis and financial trends with colorful bars and a dynamic line, isolated on a clean white background. Decrease statistics illustrations 3d graph and chart icons isolated on white background. A vibrant 3D representation of a business graph and chart, showcasing data analysis and financial trends with colorful bars and a dynamic line, isolated on a clean white background
Free with trial Businessman analyzing data on large display screen,This image was created using AI. Decrease statistics illustrations Businessman analyzing data on large display screen
Free with trial Futuristic 3D Data Visualization on Glass Screen. Decrease statistics illustrations Futuristic 3D Data Visualization on Glass Screen
Free with trial A collection of financial chart icons, showcasing data analysis and business growth concepts. The image features multiple variations of a line graph and bar chart combination, presented in both grayscale and beige color schemes. These icons are ideal for illustrating financial reports, business presentations, market trends, and data visualization projects. The clean, modern design makes them suitable for a wide range of applications. Decrease statistics vectors Financial Chart Icons: Business and Data Analysis. A collection of financial chart icons, showcasing data analysis and business growth concepts. The image features multiple variations of a line graph and bar chart combination, presented in both grayscale and beige color schemes. These icons are ideal for illustrating financial reports, business presentations, market trends, and data visualization projects. The clean, modern design makes them suitable for a wide range of applications.
Free with trial Illustration of a red arrow pointing downwards across a series of red vertical bars of varying height, set against a beige background. Image. Decrease statistics illustrations Illustration of Red Downward Arrow Over Red Bar Graph. Illustration of a red arrow pointing downwards across a series of red vertical bars of varying height, set against a beige background. Image
Free with trial Colorful graph chart is showing and comparing different data results with lines and dots. Decrease statistics vectors Colorful graph chart showing different data comparing results. Colorful graph chart is showing and comparing different data results with lines and dots
Free with trial Purple gradient bar graph is showing a negative trend with a downward arrow. Decrease statistics vectors Purple gradient bar graph showing negative trend with downward arrow
Free with trial If you are looking for business illustration set, wait no more. We are excited to share these business activities illustration. The simple yet conceptual money illustration collection is must to have for designing finance, money flow, banking, business and other such design projects. Decrease statistics vectors Set of Business Activities Isometric Illustrations. If you are looking for business illustration set, wait no more. We are excited to share these business activities illustration.The simple yet conceptual money illustration collection is must to have for designing finance, money flow, banking, business and other such design projects
Free with trial Hearts arranged in a downward trend chart, symbolizing decline in love, relationships, or emotional connection. Perfect for breakup, lost love, and relationship analysis concepts. Decrease statistics vectors Hearts arranged in a downward trend chart, symbolizing decline in love, relationships, or emotional connection. Perfect for
Free with trial 3d illustration of four blue arrows pointing down representing a negative trend. Decrease statistics illustrations Blue arrows pointing down showing negative trend. 3d illustration of four blue arrows pointing down representing a negative trend
Free with trial Red bar graph with decreasing values. Generative AI. Decrease statistics illustrations Red bar graph with decreasing values
Free with trial Strategic Decisions: Integrating Business Analytics with Strategic Thinking. This visual portrays the dynamic interaction between business analytics and strategic thinking, showcasing how analytical insights drive strategic planning and decision-making. It emphasizes the synergy between data analysis and strategic foresight in achieving business goals. --chaos 10 --ar 16:9 --style raw --stylize, aesthetic wallpaper background. Decrease statistics illustrations Colorful Pie Charts and Bar Graphs on a White Paper. Strategic Decisions: Integrating Business Analytics with Strategic Thinking. This visual portrays the dynamic interaction between business analytics and strategic thinking, showcasing how analytical insights drive strategic planning and decision-making. It emphasizes the synergy between data analysis and strategic foresight in achieving business goals. --chaos 10 --ar 16:9 --style raw --stylize, aesthetic wallpaper background
Free with trial A clean, flat design illustration featuring a collection of icons related to social media engagement and data analysis. The set includes a pie chart, bar graphs showing upward trends, a line graph with a heart icon and an upward arrow, another line graph with data points, a speech bubble with the word 'LIKE' and abstract shapes, and a thumbs-up icon with a notification count. These graphics are ideal for representing concepts like growth, popularity, analytics, and user feedback in digital marketing, business reports, and web design. Decrease statistics illustrations Social Media Metrics and Data Visualization Icons. A clean, flat design illustration featuring a collection of icons related to social media engagement and data analysis. The set includes a pie chart, bar graphs showing upward trends, a line graph with a heart icon and an upward arrow, another line graph with data points, a speech bubble with the word 'LIKE' and abstract shapes, and a thumbs-up icon with a notification count. These graphics are ideal for representing concepts like growth, popularity, analytics, and user feedback in digital marketing, business reports, and web design.
Free with trial Bar chart in blue circle alongside minimal cloud shapes and dark horizontal lines. Ideal for analytics, data trends, business insight, environment, forecast, comparison, technology, simple flat. Decrease statistics illustrations Minimalist Data Visualization with Bar Chart and Cloudy Sky Elements. Bar chart in blue circle alongside minimal cloud shapes and dark horizontal lines. Ideal for analytics, data trends, business insight, environment, forecast, comparison, technology, simple flat
Free with trial Line graph is depicting the fluctuation of the dollar currency over a period of time. Decrease statistics illustrations Line graph showing dollar sign currency fluctuation over time. Line graph is depicting the fluctuation of the dollar currency over a period of time
Free with trial Line chart decreae icon linear vector graphics sign or symbol set for web app ui. Decrease statistics vectors Line chart decreae icon Flat line illustration. Line chart decreae icon linear vector graphics sign or symbol set for web app ui
Free with trial A vector illustration depicting a business downturn during the cold winter months. Decrease statistics vectors Winter Economic Decline Chart Vector Illustration. A vector illustration depicting a business downturn during the cold winter months
Free with trial A collection of small, black, spherical magnetic balls are arranged on a white surface to form a large arrow pointing downwards. The arrow is composed of multiple rows of balls, with a wider top and tapering to a point. A few individual balls are scattered near the tip of the arrow. The arrangement creates a clear directional symbol. Decrease statistics illustrations Arrow Shape Formed by Black Magnetic Balls Pointing Downward down arrow direction. A collection of small, black, spherical magnetic balls are arranged on a white surface to form a large arrow pointing downwards. The arrow is composed of multiple rows of balls, with a wider top and tapering to a point. A few individual balls are scattered near the tip of the arrow. The arrangement creates a clear directional symbol
Free with trial Abstract 3D rendering of a golden bar graph, depicting data fluctuations Represents growth and market trends. Decrease statistics illustrations Golden Data Visualization. AI Generated. Abstract 3D rendering of a golden bar graph, depicting data fluctuations Represents growth and market trends
Free with trial Colorful bar and pie charts illustrate data analysis white background. Decrease statistics illustrations Colorful bar and pie charts illustrate data analysis
Free with trial A minimalist 3D render featuring two soft, pastel-colored arrows, one light blue and one pink, intersecting over a pale purple bar. The arrangement visually suggests a percentage symbol. The objects are rendered with smooth, rounded edges and a subtle sheen, set against a clean white background. This graphic is ideal for representing concepts like discounts, sales, growth, decline, comparison, or financial metrics in a modern and appealing way. Decrease statistics vectors 3D Arrows Intersecting with Percentage Symbol Shape. A minimalist 3D render featuring two soft, pastel-colored arrows, one light blue and one pink, intersecting over a pale purple bar. The arrangement visually suggests a percentage symbol. The objects are rendered with smooth, rounded edges and a subtle sheen, set against a clean white background. This graphic is ideal for representing concepts like discounts, sales, growth, decline, comparison, or financial metrics in a modern and appealing way.
Free with trial A row of wooden figures, each with a spherical top and a rectangular or cylindrical base, are arranged in descending order of height from left to right. The figures vary in color, starting with a deep red, followed by orange, yellow, green, and then several shades of brown and natural wood. The background is a muted, textured beige. Decrease statistics illustrations Wooden figures arranged in descending height order. A row of wooden figures, each with a spherical top and a rectangular or cylindrical base, are arranged in descending order of height from left to right. The figures vary in color, starting with a deep red, followed by orange, yellow, green, and then several shades of brown and natural wood. The background is a muted, textured beige
Free with trial A close-up of a laptop displaying a stock market crash, highlighted by declining red graph lines and a glowing keyboard, symbolizing financial crisis and economic volatility - generated AI. Decrease statistics illustrations Stock market crash displayed on laptop screen with red graph lines. A close-up of a laptop displaying a stock market crash, highlighted by declining red graph lines and a glowing keyboard, symbolizing financial crisis and economic volatility - generated AI
Free with trial A glossy, transparent blue arrow curves downwards, pointing towards the bottom right of the frame. The arrow is rendered in 3D and casts a subtle shadow on the white surface it rests upon. Clear details and vibrant colors enhance visual appeal. Decrease statistics illustrations Glossy Blue Arrow Pointing Downwards on a White Background direction decline. A glossy, transparent blue arrow curves downwards, pointing towards the bottom right of the frame. The arrow is rendered in 3D and casts a subtle shadow on the white surface it rests upon. Clear details and vibrant colors enhance visual appeal
Free with trial An abstract, three-dimensional white graph line is depicted against a stark white background. The line features sharp, jagged peaks and valleys, clearly illustrating a significant downward trend or decline. The geometric form casts a subtle shadow, adding depth to the minimalist composition. This visual represents concepts of loss, negative performance, or economic downturn. Decrease statistics illustrations Abstract 3D White Graph Line Showing Downward Trend on White Background chart data. An abstract, three-dimensional white graph line is depicted against a stark white background. The line features sharp, jagged peaks and valleys, clearly illustrating a significant downward trend or decline. The geometric form casts a subtle shadow, adding depth to the minimalist composition. This visual represents concepts of loss, negative performance, or economic downturn
Free with trial 3D illustration of stacked gold coins with a red downward arrow, symbolizing financial loss, market decline, or economic downturn. Perfect for finance presentations, investment reports, economic analysis, and business-related visuals showing negative trends. Decrease statistics illustrations . 3D illustration of stacked gold coins with a red downward arrow, symbolizing financial loss, market decline, or economic downturn. Perfect for finance presentations, investment reports, economic analysis, and business-related visuals showing negative trends.
Free with trial Nine black and white icons of abacuses on a white background, each with varying curves on the frame. The beads are arranged differently among the icons, suggesting diverse numerical configurations. The abacus curves either upward or downward, providing distinct shapes across each representation. These simple illustrations emphasize the classic design of the abacus as a counting tool. Decrease statistics vectors Nine simple line graphs displayed in a grid pattern. Nine black and white icons of abacuses on a white background, each with varying curves on the frame. The beads are arranged differently among the icons, suggesting diverse numerical configurations. The abacus curves either upward or downward, providing distinct shapes across each representation. These simple illustrations emphasize the classic design of the abacus as a counting tool.
Free with trial An isometric illustration shows a computer screen displaying colorful data charts and graphs alongside related financial icons. Decrease statistics illustrations Colorful Data Analytics Displayed on Computer Screen. An isometric illustration shows a computer screen displaying colorful data charts and graphs alongside related financial icons
Free with trial Cheerful cartoon businessman reviewing positive financial data upward trending graph. Decrease statistics illustrations Happy Businessman Analyzing Financial Growth Charts. Cheerful cartoon businessman reviewing positive financial data upward trending graph.
Free with trial This simple vector icon shows a round chart with a bar graph that is decreasing. Decrease statistics illustrations Round chart icon showing decreasing bar graph for data analysis. This simple vector icon shows a round chart with a bar graph that is decreasing
Free with trial Silver bullion broken showing economic recession and market crash. Silver bullion broken with a red down arrow symbolizing financial crisis and falling markets. Decrease statistics illustrations Silver bullion broken showing economic recession and market crash. Silver bullion broken with a red down arrow symbolizing financial crisis and falling markets
Free with trial A black framed display shows a white gridded background with a prominent red arrow depicting a sharp downward trend. The arrow is thick and three-dimensional, clearly indicating a significant decline. The display sits on a light gray surface, with a blurred cityscape visible through a window in the background. The overall mood is one of negative economic or financial news. The image is clean and, generated by AI. Decrease statistics illustrations Red Downward Trending Graph on White Display Screen. A black framed display shows a white gridded background with a prominent red arrow depicting a sharp downward trend. The arrow is thick and three-dimensional, clearly indicating a significant decline. The display sits on a light gray surface, with a blurred cityscape visible through a window in the background. The overall mood is one of negative economic or financial news. The image is clean and, generated by AI.
Free with trial Colorful graph showing decreasing lines representing a financial loss. Decrease statistics vectors Isometric graph showing financial loss with arrow pointing down. Colorful graph showing decreasing lines representing a financial loss
Free with trial Four cylindrical bar charts are displayed against a light gray background. The charts represent four items labeled ITEM 11, ITEM 12, ITEM 13, and ITEM 14. Each chart displays data series with circular markers and labels. The data series are colored in shades of teal, blue, and dark blue. The charts have a 3D cylindrical appearance with a slight gradient. Horizontal grid lines with numerical labels. Decrease statistics illustrations Four cylindrical bar charts with blue and teal data. Four cylindrical bar charts are displayed against a light gray background. The charts represent four items labeled ITEM 11, ITEM 12, ITEM 13, and ITEM 14. Each chart displays data series with circular markers and labels. The data series are colored in shades of teal, blue, and dark blue. The charts have a 3D cylindrical appearance with a slight gradient. Horizontal grid lines with numerical labels
Free with trial This image showcases a striking 3D rendering featuring two sets of colorful bar graphs, one in shades of pink and the other in orange. These graphs are artfully embedded within wave-like, layered forms, creating a visually interesting contrast between the rigid geometry of the bars and the fluidity of the surrounding shapes. The graphs are positioned on separate, circular platforms, and a small, idyllic island with several evergreen trees sits between them, adding a touch of nature to the otherwise abstract composition. The overall aesthetic is minimalist and modern, suggesting a conceptual representation of financial growth within a natural context. Decrease statistics illustrations Abstract 3D Render of Financial Growth Represented by Colorful Bar Graphs Nestled in Stylized Landscapes. This image showcases a striking 3D rendering featuring two sets of colorful bar graphs, one in shades of pink and the other in orange. These graphs are artfully embedded within wave-like, layered forms, creating a visually interesting contrast between the rigid geometry of the bars and the fluidity of the surrounding shapes. The graphs are positioned on separate, circular platforms, and a small, idyllic island with several evergreen trees sits between them, adding a touch of nature to the otherwise abstract composition. The overall aesthetic is minimalist and modern, suggesting a conceptual representation of financial growth within a natural context.
Free with trial Vibrant bar graph illustrates business growth and decline with upward and downward trending lines. Perfect for presentations or reports. Decrease statistics illustrations Colorful Bar Graph Chart Showing Growth and Decline. Vibrant bar graph illustrates business growth and decline with upward and downward trending lines. Perfect for presentations or reports
Free with trial A bar chart made of wooden blocks sits on an open book in a classic library, symbolizing a decline in business performance, economic recession, or falling educational standards. Decrease statistics illustrations Economic Decline Graph on an Open Book in a Library. A bar chart made of wooden blocks sits on an open book in a classic library, symbolizing a decline in business performance, economic recession, or falling educational standards
Free with trial Man with bankruptcy concept. Young guy with banknotes and golden coins at background of fall graph. Recession and inflation. Cartoon flat vector illustration isolated on white background. Decrease statistics vectors Man with bankruptcy vector concept. Man with bankruptcy concept. Young guy with banknotes and golden coins at background of fall graph. Recession and inflation. Cartoon flat vector illustration isolated on white background
Free with trial Man with bankruptcy concept. Young guy with banknotes and golden coins at background of fall graph. Economical crisis. Poster or banner. Cartoon flat vector illustration isolated on white background. Decrease statistics vectors Man with bankruptcy vector concept. Man with bankruptcy concept. Young guy with banknotes and golden coins at background of fall graph. Economical crisis. Poster or banner. Cartoon flat vector illustration isolated on white background
Free with trial This abstract 3D rendered image showcases three prominent white candlestick-like objects, symbolizing financial growth and market trends. Positioned against a dark, gridded background, a subtle financial chart with smaller red and white candlesticks and wicks extends into the distance, reinforcing the theme of data analysis and investment. The clean, modern aesthetic makes it ideal for illustrating concepts related to stock market performance, cryptocurrency trading, economic growth, financial planning, and digital business strategies. It effectively conveys ideas of progress, success, and the dynamic nature of global markets. Decrease statistics illustrations 3D Financial Candlestick Chart Representing Market Growth. This abstract 3D rendered image showcases three prominent white candlestick-like objects, symbolizing financial growth and market trends. Positioned against a dark, gridded background, a subtle financial chart with smaller red and white candlesticks and wicks extends into the distance, reinforcing the theme of data analysis and investment. The clean, modern aesthetic makes it ideal for illustrating concepts related to stock market performance, cryptocurrency trading, economic growth, financial planning, and digital business strategies. It effectively conveys ideas of progress, success, and the dynamic nature of global markets.
Free with trial Global finance data analysis on keyboard with charts, stunning background Generative AI. Decrease statistics illustrations Global finance data analysis on keyboard with charts
Free with trial A vector illustration showing a magnifying glass focused on a bar graph and line chart indicating growth. The magnifying glass has a blue frame and red handle. The chart depicts an upward trend, suggesting positive business performance. This image is suitable for illustrating data analysis, business strategy, market research, and financial growth concepts. Decrease statistics vectors Analyzing Growth: Magnifying Glass on Business Chart. A vector illustration showing a magnifying glass focused on a bar graph and line chart indicating growth. The magnifying glass has a blue frame and red handle. The chart depicts an upward trend, suggesting positive business performance. This image is suitable for illustrating data analysis, business strategy, market research, and financial growth concepts.
Free with trial The image showcases a collection of vibrant charts and graphs presenting data visualizations on a dark background. Decrease statistics illustrations Colorful Data Visualization Charts And Graphs Display. The image showcases a collection of vibrant charts and graphs presenting data visualizations on a dark background
Free with trial Graph showing downward trend with a red arrow and blue bars. Digital interface background with a heartbeat line and hexagonal patterns, adding a modern touch to scene. Decrease statistics illustrations Graph showing downward trend with a red arrow and blue bars
Free with trial This striking image depicts a 3D rendering of a sharply declining graph, generated by AI, symbolizing a market crash or economic downturn. The red arrow dramatically plunges downwards against a blurred background of white building silhouettes, visually representing the severity of the economic decl. Decrease statistics illustrations AI-Generated Market Crash Visualization. This striking image depicts a 3D rendering of a sharply declining graph, generated by AI, symbolizing a market crash or economic downturn. The red arrow dramatically plunges downwards against a blurred background of white building silhouettes, visually representing the severity of the economic decl
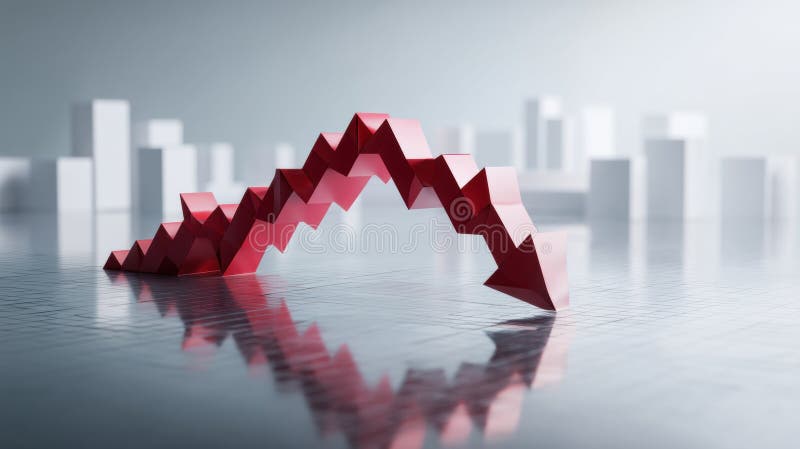
Free with trial This striking image depicts a 3D rendering of a dramatic market downturn, generated by AI. The red, origami-style arrow plunges downwards, contrasting sharply with the clean, minimalist background. The visual emphasizes the severity of the economic decline. Decrease statistics illustrations AI-Generated Market Crash Visualization. This striking image depicts a 3D rendering of a dramatic market downturn, generated by AI. The red, origami-style arrow plunges downwards, contrasting sharply with the clean, minimalist background. The visual emphasizes the severity of the economic decline.
Free with trial Red metallic bars show a downward trend against a colorful bokeh background. Perfect for illustrating financial reports or presentations. Decrease statistics illustrations Decreasing Bar Graph Chart Showing Financial Decline. Red metallic bars show a downward trend against a colorful bokeh background. Perfect for illustrating financial reports or presentations
Free with trial Glowing orange chart illustrating a downward trend, with bar graph and line graph, set against a dark blue backdrop. Decrease statistics illustrations Glowing Downward Trend Chart on Dark Blue Background. Glowing orange chart illustrating a downward trend, with bar graph and line graph, set against a dark blue backdrop
Free with trial A futuristic concept of financial trading and data analysis. A glowing holographic stock market chart, with candlesticks and graphs, is projected onto a modern office desk. The scene includes a laptop and coffee, set against a large window with a blurry night city skyline. This image represents concepts like fintech, investment, big data, economic growth, and innovative business technology. Ideal for illustrating topics on digital finance, stock exchange, forex trading, and corporate strategy in a high-tech world. Decrease statistics illustrations Futuristic Financial Trading Hologram on Office Desk. A futuristic concept of financial trading and data analysis. A glowing holographic stock market chart, with candlesticks and graphs, is projected onto a modern office desk. The scene includes a laptop and coffee, set against a large window with a blurry night city skyline. This image represents concepts like fintech, investment, big data, economic growth, and innovative business technology. Ideal for illustrating topics on digital finance, stock exchange, forex trading, and corporate strategy in a high-tech world.
Free with trial This abstract chart, generated by AI, displays a downward trend using a bold red line against a backdrop of scattered points and scribbles. The image suggests a decline or negative correlation, possibly representing economic data or a conceptual illustration. The style is reminiscent of a hand-draw. Decrease statistics illustrations AI-Generated Abstract Chart. This abstract chart, generated by AI, displays a downward trend using a bold red line against a backdrop of scattered points and scribbles. The image suggests a decline or negative correlation, possibly representing economic data or a conceptual illustration. The style is reminiscent of a hand-draw
Free with trial This simple bar graph is depicting market analysis with colorful bars. Decrease statistics vectors Colorful bar graph showing market growth and success. This simple bar graph is depicting market analysis with colorful bars
Free with trial Black and Blue Line Diagram and Report Icon. Decrease statistics illustrations Investment Loss and diagram icon concept. Black and Blue Line Diagram and Report Icon
Free with trial Presentation graph projection outline flat white icons on round color backgrounds. 6 bonus icons included. Decrease statistics vectors Presentation graph projection outline flat round icons. Presentation graph projection outline flat white icons on round color backgrounds. 6 bonus icons included
Free with trial Dreamstime for your design Red arrow down chart on wall. Stock market crash concept. Decrease statistics illustrations Red arrow down chart on wall. Stock market crash concept.
Free with trial A white line graph with black circular points ascends diagonally across a solid orange background. The line is illuminated, casting a subtle shadow. Decrease statistics illustrations White line graph with black dots on orange background. A white line graph with black circular points ascends diagonally across a solid orange background. The line is illuminated, casting a subtle shadow
Free with trial Statics arrow down Flat outline Collection in Black and white background. Decrease statistics vectors Statics arrow down flat and simple set design. Statics arrow down Flat outline Collection in Black and white background
Free with trial A hand is shown placing the final wooden block to complete a percentage symbol, symbolizing financial concepts and business decisions. Decrease statistics illustrations Hand placing wooden blocks to form a percentage symbol. A hand is shown placing the final wooden block to complete a percentage symbol, symbolizing financial concepts and business decisions
Free with trial Checklist line icon. Continuous line with 3d star. Graph chart sign. Growth diagram symbol. 3d star in speech bubble. Checklist single line ribbon. Loop curve pattern. Vector. Decrease statistics vectors Checklist line icon. Graph chart sign. Continuous line with 3d star. Vector. Checklist line icon. Continuous line with 3d star. Graph chart sign. Growth diagram symbol. 3d star in speech bubble. Checklist single line ribbon. Loop curve pattern. Vector
Free with trial A black and white icon depicting a bar chart with bars decreasing in height, indicating a significant downward trend. Decrease statistics illustrations Bar chart showing a sharp decline with downward arrow. A black and white icon depicting a bar chart with bars decreasing in height, indicating a significant downward trend
Free with trial A collection of red and green arrows, some pointing up and others down, symbolizing market fluctuations and financial performance. Decrease statistics illustrations Upward and downward arrows representing market trends. A collection of red and green arrows, some pointing up and others down, symbolizing market fluctuations and financial performance
Free with trial A bear market depression, brown bear in market. stock going down graph background. Decrease statistics illustrations Bear market depression, brown bear in market. stock going down graph background
Free with trial A bear market depression, brown bear in market. stock going down graph background. Decrease statistics illustrations Bear market depression, brown bear in market. stock going down graph background
Free with trial A bear market depression, brown bear in market. stock going down graph background. Decrease statistics illustrations Bear market depression, brown bear in market. stock going down graph background
Free with trial Three wooden blocks are arranged in a row on a reflective surface against a white background. The leftmost block has two green upward-pointing arrows cut out, revealing a green background. The middle block displays a dark blue percentage symbol. The rightmost block features a red downward-pointing arrow cut out, revealing a red background. Decrease statistics illustrations Wooden blocks with up arrows percentage and down arrow. Three wooden blocks are arranged in a row on a reflective surface against a white background. The leftmost block has two green upward-pointing arrows cut out, revealing a green background. The middle block displays a dark blue percentage symbol. The rightmost block features a red downward-pointing arrow cut out, revealing a red background
Free with trial A vibrant, modern icon depicting a financial growth chart, representing investment and market analysis. The design features ascending lines and bars, suggesting positive trends. This graphic was generated by AI for illustrative purposes. A representation of financial success. Decrease statistics illustrations Financial Growth Chart Icon - Business Investment Concept. A vibrant, modern icon depicting a financial growth chart, representing investment and market analysis. The design features ascending lines and bars, suggesting positive trends. This graphic was generated by AI for illustrative purposes. A representation of financial success.
Free with trial A 3D rendering shows a red, downward-trending graph on a tablet screen, illustrating a market decline. The image, generated by AI, vividly represents financial loss and market instability. This visualization is ideal for illustrating economic trends and analysis. Decrease statistics illustrations AI-Generated Market Decline Visualization. A 3D rendering shows a red, downward-trending graph on a tablet screen, illustrating a market decline. The image, generated by AI, vividly represents financial loss and market instability. This visualization is ideal for illustrating economic trends and analysis.
Free with trial This 3D graphic depicts a sharp market downturn, visualized with a red arrow plummeting downwards along a gridded bar chart. The image is generated by AI, offering a compelling visual representation of economic decline and financial loss. It showcases the potential for significant drops in various. Decrease statistics illustrations AI-Generated Market Decline Visualization. This 3D graphic depicts a sharp market downturn, visualized with a red arrow plummeting downwards along a gridded bar chart. The image is generated by AI, offering a compelling visual representation of economic decline and financial loss. It showcases the potential for significant drops in various
Free with trial This image showcases a vibrant 3D rendering of various financial charts, including bar graphs, pie charts, and a rising arrow, symbolizing growth and profitability. Ideal for presentations, reports, and financial articles. Decrease statistics illustrations Colorful 3D Financial Charts Showing Growth and Profit. This image showcases a vibrant 3D rendering of various financial charts, including bar graphs, pie charts, and a rising arrow, symbolizing growth and profitability. Ideal for presentations, reports, and financial articles.
Free with trial A stylized digital graph depicts fluctuating market trends using bar columns and a connected line with bright orange data points. Decrease statistics illustrations Abstract digital graph showing financial market trends. A stylized digital graph depicts fluctuating market trends using bar columns and a connected line with bright orange data points
Free with trial Dollar coin beside a bar graph showing downward trend under a cloud. Ideal for finance, economy, investment, loss, analytics, business performance, global market. Simple flat metaphor. Decrease statistics vectors Dollar Coin and Declining Bar Graph Representing Financial Loss Concept. Dollar coin beside a bar graph showing downward trend under a cloud. Ideal for finance, economy, investment, loss, analytics, business performance, global market. Simple flat metaphor
Free with trial A red background with red lines on it. The red lines are in different sizes and are arranged in a way that creates a sense of movement. The image conveys a feeling of energy and excitement. Decrease statistics vectors A red background with red lines on it
Free with trial Line chart is representing a decreasing trend in statistical data analysis. Decrease statistics vectors Statistical data analysis with line chart showing decreasing trend. Line chart is representing a decreasing trend in statistical data analysis
Free with trial Concept Abstract Art, Blue Watercolor, Financial Growth, Chart, Abstract Design Abstract Blue Watercolor Financial Growth Chart. Decrease statistics illustrations Abstract Blue Watercolor Financial Growth Chart. Concept Abstract Art, Blue Watercolor, Financial. Concept Abstract Art, Blue Watercolor, Financial Growth, Chart, Abstract Design Abstract Blue Watercolor Financial Growth Chart
Free with trial Icon of an arrow pointing down on a shopping cart, representing decreasing sales. Decrease statistics vectors Arrow pointing down on shopping cart icon showing decreasing sales. Icon of an arrow pointing down on a shopping cart, representing decreasing sales
Free with trial Line chart decreae icon linear vector graphics sign or symbol set for web app ui. Decrease statistics vectors Line chart decreae icon linear graphics set vector in black. Line chart decreae icon linear vector graphics sign or symbol set for web app ui
Free with trial A businessman in a suit draws a red downward trend line over a bar graph, illustrating cost reduction and financial decline. Decrease statistics illustrations Businessman Drawing a Downward Trend Line on a Cost Graph. A businessman in a suit draws a red downward trend line over a bar graph, illustrating cost reduction and financial decline
Free with trial 3D colorful bar chart, pie chart, rising arrow, dollar sign, and stacks of coins illustrate financial growth and success. Perfect for business, finance, and investment presentations. Decrease statistics illustrations Financial Growth Chart with Dollar Sign and Coin Stacks. 3D colorful bar chart, pie chart, rising arrow, dollar sign, and stacks of coins illustrate financial growth and success. Perfect for business, finance, and investment presentations.
Free with trial Decreasing line graph showing a negative trend, perfect for illustrating economic downturn or market decline. Decrease statistics vectors Downward Trend Graph, Financial Crisis Icon Illustration. Decreasing line graph showing a negative trend, perfect for illustrating economic downturn or market decline.