Free with trial A graphic representing financial or performance decline featuring an orange arrow pointing downwards over a wavy line, with the word LOSS displayed below. Decrease statistics illustrations Orange downward trend arrow over wavy line with loss text. A graphic representing financial or performance decline featuring an orange arrow pointing downwards over a wavy line, with the word LOSS displayed below
Free with trial Generative AI : Abstract pink crisis business and forex chart on blurry toned city wallpaper with bokeh circles Downward trend and financial downfall concept Double exposure busine. Decrease statistics illustrations Generative AI Abstract pink crisis business and forex chart on blurry toned city wallpaper with bokeh circles Down. Generative AI : Abstract pink crisis business and forex chart on blurry toned city wallpaper with bokeh circles Downward trend and financial downfall concept Double exposure busine
Free with trial Financial and economic improvement during stock market crash, stabilizing value of foreign currency, rising incomes and wages, countering inflation, preserving savings, man protects euro from arrow. Decrease statistics vectors Man protects euro from arrow
Free with trial International financial market tariff free sticker in set vector. Decrease statistics vectors International financial market tariff free sticker in set
Free with trial A vibrant pink graph line ascends diagonally against a dark background, representing upward growth. The image evokes a sense of dynamic increase. The style is reminiscent of a modern, technological aesthetic. The subtle grid pattern in the background adds depth, created to simulate a data visualizat. Decrease statistics illustrations Uptrend. A vibrant pink graph line ascends diagonally against a dark background, representing upward growth. The image evokes a sense of dynamic increase. The style is reminiscent of a modern, technological aesthetic. The subtle grid pattern in the background adds depth, created to simulate a data visualizat
Free with trial Fluctuations red graph illustration business meeting, computer analysis, trends presentation fluctuations red graph. Decrease statistics illustrations Fluctuations red graph
Free with trial A chart displaying data trends on a white background. 3D Rendering. Decrease statistics illustrations Graphical representation of data trends. 3D Rendering. A chart displaying data trends on a white background. 3D Rendering
Free with trial This image depicts a global economic downturn using a visual representation. A large, white downward-pointing arrow dominates the scene, positioned over a grayscale world map. The map is overlaid on a dark red background, which further emphasizes the negative trend. Red bar graphs, scattered across the map, visually represent the economic decline in different regions, highlighting the severity of the situation. Numerical data points on the graph add to the visual impact and sense of decline. The overall effect creates a powerful and alarming visual metaphor for a worldwide economic crisis or recession. Decrease statistics illustrations Global Economic Downturn Illustrated with World Map and Charts. This image depicts a global economic downturn using a visual representation. A large, white downward-pointing arrow dominates the scene, positioned over a grayscale world map. The map is overlaid on a dark red background, which further emphasizes the negative trend. Red bar graphs, scattered across the map, visually represent the economic decline in different regions, highlighting the severity of the situation. Numerical data points on the graph add to the visual impact and sense of decline. The overall effect creates a powerful and alarming visual metaphor for a worldwide economic crisis or recession.
Free with trial Decline food sales data illustration fruits vegetables, items year, trend analysis decline food sales data. Decrease statistics illustrations Decline food sales data
Free with trial Blue 3D Percentage Symbol With Arrow Pointing Down on Yellow Background as Blank Banner for Displaying a Marketing Ad. Vector Illustration. Decrease statistics vectors Blue 3D Percentage Symbol With Arrow Pointing Down on Yellow Background as Blank Banner for Displaying a Marketing Ad.
Free with trial This image shows a red line graph with a downward trend on a blue background. Vector illustration design using ai tool. Decrease statistics vectors Financial crisis graph. This image shows a red line graph with a downward trend on a blue background. Vector illustration design using ai tool.
Free with trial Businessman analyzing declining graph, worried about financial loss. Office setting with a plant and documents. Corporate challenges vector illustration. Decrease statistics vectors Businessman analyzing declining graph, worried about financial loss. Office setting with a plant and documents
Free with trial Risky choice of strategy or development path, leadership in prevention unforeseen circumstances, mentoring to solve complex situations, loss of funds in high-risk investments, man warns of risk. Decrease statistics vectors Man warns of risk
Free with trial Stacked gold coins next to a red downward arrow on a gray grid background, representing financial decline. 3D Rendering. Decrease statistics illustrations Stack of coins with red downward arrow on grid background. 3D Rendering. Stacked gold coins next to a red downward arrow on a gray grid background, representing financial decline. 3D Rendering
Free with trial International trade war dispute concept background vector. Decrease statistics vectors International trade war dispute concept background
Free with trial This image shows a bar chart with a downward trend line, indicating economic decline. Vector illustration design using ai tool. Decrease statistics vectors Economic recession chart. This image shows a bar chart with a downward trend line, indicating economic decline. Vector illustration design using ai tool.
Free with trial Trends blinking sales graph illustration data visualization, performance revenue, metrics dashboard trends blinking sales graph. Decrease statistics illustrations Trends blinking sales graph
Free with trial Analysis shifting line chart illustration visualization movement, axis series, dynamic fluctuation analysis shifting line chart. Decrease statistics illustrations Analysis shifting line chart
Free with trial This image shows a 3D bar graph, generated by AI, depicting a rise and subsequent fall in values. The red bars illustrate a peak, followed by a sharp decline, possibly representing a trend in data or market fluctuations. The visual is clean and easy to understand, highlighting the dramatic change i. Decrease statistics illustrations Red 3D Bar Graph. This image shows a 3D bar graph, generated by AI, depicting a rise and subsequent fall in values. The red bars illustrate a peak, followed by a sharp decline, possibly representing a trend in data or market fluctuations. The visual is clean and easy to understand, highlighting the dramatic change i
Free with trial This image shows a declining bar graph and a person reacting to a financial crisis. Vector illustration design using ai tool. Decrease statistics vectors Economic collapse is coming. This image shows a declining bar graph and a person reacting to a financial crisis. Vector illustration design using ai tool.
Free with trial Generative AI : Abstract pink crisis business and forex chart on blurry toned city wallpaper with bokeh circles Downward trend and financial downfall concept Double exposure busine. Decrease statistics illustrations Generative AI Abstract pink crisis business and forex chart on blurry toned city wallpaper with bokeh circles Down. Generative AI : Abstract pink crisis business and forex chart on blurry toned city wallpaper with bokeh circles Downward trend and financial downfall concept Double exposure busine
Free with trial Infochart, Block diagram and Algorithm. Charts and graphs line icons. Presentation linear icon set Line icons set. Vector. Decrease statistics illustrations Charts and graphs line icons. Infochart, Block diagram and Algorithm. Linear icon set. Line icons. Vector. Infochart, Block diagram and Algorithm. Charts and graphs line icons. Presentation linear icon set Line icons set. Vector
Free with trial This colorful bar graph, generated by AI, depicts a downward trend using vibrant red, green, and yellow paint. The melting paint adds a dynamic, visually engaging element to the standard bar chart format, showcasing data decline creatively. Decrease statistics illustrations Melting Bar Graph. This colorful bar graph, generated by AI, depicts a downward trend using vibrant red, green, and yellow paint. The melting paint adds a dynamic, visually engaging element to the standard bar chart format, showcasing data decline creatively.
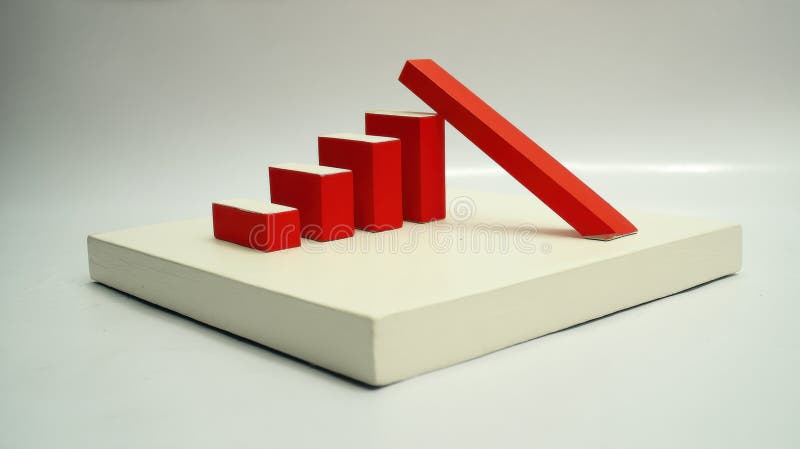
Free with trial This image shows a 3D model of a bar graph, where one bar is falling, symbolizing decline or failure. This striking visual representation was generated by AI, offering a unique perspective on downward trends and economic instability. The clean design makes it ideal for illustrating various concepts. Decrease statistics illustrations Falling Bar Graph. This image shows a 3D model of a bar graph, where one bar is falling, symbolizing decline or failure. This striking visual representation was generated by AI, offering a unique perspective on downward trends and economic instability. The clean design makes it ideal for illustrating various concepts
Free with trial Confident businessman holding a large gold arrow pointing down. Professional challenges and market downturn concept. Vector illustration. Decrease statistics vectors Businessman. Flat Vector Illustration. Confident businessman holding a large gold arrow pointing down. Professional challenges and market downturn concept. Vector illustration.
Free with trial Blue and red lines show economic decline. Vector illustration design using ai tool. Decrease statistics vectors Recession chart. Blue and red lines show economic decline. Vector illustration design using ai tool.
Free with trial Red trend arrow dropping digital tech abstract futuristic backdrop. Generative AI. Decrease statistics illustrations Red trend arrow dropping digital tech abstract futuristic backdrop
Free with trial Stacks of golden coins arranged in ascending order, representing financial growth and investment. The background features a blurred stock market graph, symbolizing market trends and investment opportunities. The image conveys concepts of wealth accumulation, financial planning, and economic prosperity. Suitable for illustrating articles, presentations, or advertisements related to finance, investment, and business. Decrease statistics illustrations Financial Growth and Investment
Free with trial Strategy for surviving economic crisis or recession, finding way out of business problems, maintaining financial position and cash during stock market crash, risky investments, man holds graph column. Decrease statistics vectors Man holds graph column
Free with trial A downward trending red arrow, generated by AI, rests on a smartphone displaying a graph, symbolizing a market decline. This visualization is a powerful representation of negative financial trends and economic downturn, ideal for illustrating news reports or financial analyses. Decrease statistics illustrations Mobile Market Crash. A downward trending red arrow, generated by AI, rests on a smartphone displaying a graph, symbolizing a market decline. This visualization is a powerful representation of negative financial trends and economic downturn, ideal for illustrating news reports or financial analyses.
Free with trial Businessman looking at a declining info graph. vector,illustration. Decrease statistics illustrations Businessman looking at a declining info graph
Free with trial Stock market graph with blue and orange lines showing fluctuations, on futuristic dark background grid Generative AI. Decrease statistics illustrations Stock market graph with blue and orange lines showing fluctuations, on futuristic dark background grid
Free with trial Stock market graph with blue and orange lines showing fluctuations, on futuristic dark background grid Generative AI. Decrease statistics illustrations Stock market graph with blue and orange lines showing fluctuations, on futuristic dark background grid
Free with trial A businessman stands with a briefcase, surrounded by declining bar charts and downward arrows. Vector art design using ai tool. Decrease statistics vectors Stock Market Down Illustration. A businessman stands with a briefcase, surrounded by declining bar charts and downward arrows. Vector art design using ai tool.
Free with trial Chdata replicating revenue chart illustration analysis growth, sales profit, trends visualization chdata replicating revenue chart. Decrease statistics illustrations Chdata replicating revenue chart
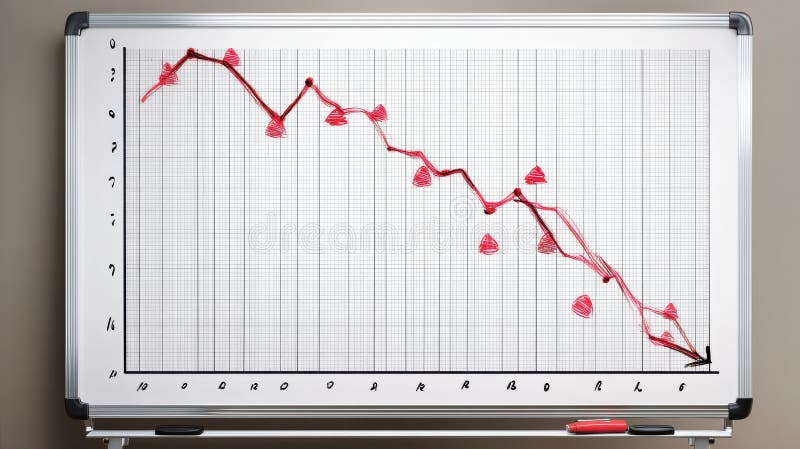
Free with trial A whiteboard displays a hand-drawn graph depicting a significant downward trend, marked by red triangles indicating decreasing values. This visual representation of a negative trend was generated by AI for illustrative purposes, possibly showcasing market decline or economic downturn. Decrease statistics illustrations Downward Trend Graph. A whiteboard displays a hand-drawn graph depicting a significant downward trend, marked by red triangles indicating decreasing values. This visual representation of a negative trend was generated by AI for illustrative purposes, possibly showcasing market decline or economic downturn.
Free with trial This AI-generated image depicts a bar graph where the bars are covered in a melting, metallic substance, suggesting a market downturn. The dripping metal symbolizes loss and decline, generated by AI for visual representation. Decrease statistics illustrations Melting Market Graph. This AI-generated image depicts a bar graph where the bars are covered in a melting, metallic substance, suggesting a market downturn. The dripping metal symbolizes loss and decline, generated by AI for visual representation.
Free with trial This image shows a declining bar graph with broken bars and a downward trend line. Vector illustration design using ai tool. Decrease statistics vectors Stock market crash. This image shows a declining bar graph with broken bars and a downward trend line. Vector illustration design using ai tool.
Free with trial Analyzing the business failure and decline. White magnifying glass analyzing a growth chart on a blue background, representing market analysis and business growth. 3D render. Decrease statistics illustrations Magnifying glass analyzing growth chart on blue background. Analyzing the business failure and decline. White magnifying glass analyzing a growth chart on a blue background, representing market analysis and business growth. 3D render
Free with trial Risky choice of strategy or development path, obstacles and difficulties in achieving goals, fierce competition in the labor market, loss of funds in high-risk investments, man falls from risk cubes. Decrease statistics vectors Man falls from risk cubes
Free with trial Analyzing causes of financial difficulties, finding survival strategy during economic crisis or market crash, team brainstorm to solve problems of declining business value, men near broken euro sign. Decrease statistics vectors Men near broken euro sign
Free with trial A person analyzing stock market charts with a pointer. Vector art design using ai tool. Decrease statistics vectors Stock Market Illustration Charts. A person analyzing stock market charts with a pointer. Vector art design using ai tool.
Free with trial A close-up of a stock market chart showing a sharp downturn. The orange line graph against a dark background with gridlines illustrates the volatility and potential risks in financial markets. The image captures the urgency and anxiety associated with market fluctuations. The "MA 1000" text is visib. Decrease statistics illustrations Stock Market Downturn. A close-up of a stock market chart showing a sharp downturn. The orange line graph against a dark background with gridlines illustrates the volatility and potential risks in financial markets. The image captures the urgency and anxiety associated with market fluctuations. The "MA 1000" text is visib
Free with trial This image shows a rolled-up graph with a red line depicting a downturn, generated by AI. It visually represents a negative trend or decline in data, potentially illustrating economic recession, market loss, or other negative statistical trends. The clean design allows for easy visualization of the. Decrease statistics illustrations Declining Graph Report. This image shows a rolled-up graph with a red line depicting a downturn, generated by AI. It visually represents a negative trend or decline in data, potentially illustrating economic recession, market loss, or other negative statistical trends. The clean design allows for easy visualization of the
Free with trial A 3D rendered illustration depicting business growth. The image showcases two upward-trending arrow charts, one in gold and the other in blue, representing positive trends, progress, and success. The charts are set against a clean, light background, emphasizing the upward movement and potential for financial gain. Suitable for illustrating economic growth, investment strategies, and business performance. Decrease statistics illustrations Growth Chart with Arrows. A 3D rendered illustration depicting business growth. The image showcases two upward-trending arrow charts, one in gold and the other in blue, representing positive trends, progress, and success. The charts are set against a clean, light background, emphasizing the upward movement and potential for financial gain. Suitable for illustrating economic growth, investment strategies, and business performance.
Free with trial A minimalist black and white icon representing a financial growth chart. It features a series of vertical bars of varying heights, symbolizing data points or periods, overlaid with a line graph connecting circular nodes. This graphic effectively conveys concepts of financial analysis, business growth, performance tracking, and data visualization. Ideal for presentations, reports, websites, and applications related to finance, economics, and business intelligence. Decrease statistics vectors Growth Analysis Finance Chart Icon. A minimalist black and white icon representing a financial growth chart. It features a series of vertical bars of varying. A minimalist black and white icon representing a financial growth chart. It features a series of vertical bars of varying heights, symbolizing data points or periods, overlaid with a line graph connecting circular nodes. This graphic effectively conveys concepts of financial analysis, business growth, performance tracking, and data visualization. Ideal for presentations, reports, websites, and applications related to finance, economics, and business intelligence.
Free with trial Data merging sales graph illustration analysis trends, revenue performance, forecast comparison data merging sales graph. Decrease statistics illustrations Data merging sales graph
Free with trial Vector illustration of a red arrow trending down. Decrease statistics vectors Red arrow downward trend. vector illustration of a red arrow trending down
Free with trial This image shows a financial report with bar graphs and numerical data, generated by AI, suggesting business performance or investment analysis. The document rests on a wooden desk, with coins blurred in the background, hinting at financial matters. Decrease statistics illustrations Financial Report Analysis. This image shows a financial report with bar graphs and numerical data, generated by AI, suggesting business performance or investment analysis. The document rests on a wooden desk, with coins blurred in the background, hinting at financial matters.
Free with trial A simple, flat design icon depicting a downward trend. The image features a red graph line descending from the top left to the bottom right, with an arrow indicating the direction. The graph is set against a clean white background, emphasizing the visual impact of the trend. This graphic is suitable for illustrating concepts such as financial decline, decreasing sales, or negative performance in business, economics, or data analysis. Decrease statistics vectors Downward Trend Graph Icon. A simple, flat design icon depicting a downward trend. The image features a red graph line descending from the top left to the bottom right, with an arrow indicating the direction. The graph is set against a clean white background, emphasizing the visual impact of the trend. This graphic is suitable for illustrating concepts such as financial decline, decreasing sales, or negative performance in business, economics, or data analysis.
Free with trial A glossy, light blue 3D rendering of a percentage symbol, isolated on a white background. The symbol is smooth and reflective, giving a modern and clean look. Ideal for various design projects, particularly those related to sales, discounts, or financial topics. Decrease statistics illustrations 3D Blue Percentage Sign. A glossy, light blue 3D rendering of a percentage symbol, isolated on a white background. The symbol is smooth and reflective, giving a modern and clean look. Ideal for various design projects, particularly those related to sales, discounts, or financial topics.
Free with trial Generative AI : Abstract pink crisis business and forex chart on blurry toned city wallpaper with bokeh circles Downward trend and financial downfall concept Double exposure busine. Decrease statistics illustrations Generative AI Abstract pink crisis business and forex chart on blurry toned city wallpaper with bokeh circles Down. Generative AI : Abstract pink crisis business and forex chart on blurry toned city wallpaper with bokeh circles Downward trend and financial downfall concept Double exposure busine
Free with trial Generative AI : Abstract pink crisis business and forex chart on blurry toned city wallpaper with bokeh circles Downward trend and financial downfall concept Double exposure busine. Decrease statistics illustrations Generative AI Abstract pink crisis business and forex chart on blurry toned city wallpaper with bokeh circles Down. Generative AI : Abstract pink crisis business and forex chart on blurry toned city wallpaper with bokeh circles Downward trend and financial downfall concept Double exposure busine
Free with trial A minimalist bar chart with a descending line graph overlay, symbolizing financial loss, performance decline, or negative data trends. Ideal for presentations, dashboards, economic reports, and warning visuals. Decrease statistics vectors Downward Trend Bar Chart Icon. A minimalist bar chart with a descending line graph overlay, symbolizing financial loss, performance decline, or negative data trends. Ideal for presentations, dashboards, economic reports, and warning visuals
Free with trial Data loading sales graph illustration analytics visualization, performance trends, metrics dashboard data loading sales graph. Decrease statistics illustrations Data loading sales graph
Free with trial A man stands in front of a bar and line graph showing a downward trend. Vector art design using ai tool. Decrease statistics vectors Stock Market Downward Illustration. A man stands in front of a bar and line graph showing a downward trend. Vector art design using ai tool.
Free with trial A vibrant green upward trending arrow signifies growth, progress, and positive development. The arrow's design is visually appealing and represents a successful trajectory. The dark background emphasizes the upward movement. Decrease statistics illustrations Green Arrow Growth Chart. A vibrant green upward trending arrow signifies growth, progress, and positive development. The arrow's design is visually appealing and represents a successful trajectory. The dark background emphasizes the upward movement.
Free with trial A 3D stock market chart displays a bearish trend, with red bars dominating the view. The visual represents downturns in market performance and investor sentiment. Decrease statistics illustrations Bearish Stock Market Graph. A 3D stock market chart displays a bearish trend, with red bars dominating the view. The visual represents downturns in market performance and investor sentiment.
Free with trial Stabilizing the economy during a stock market downturn, financial improvement, finding a survival strategy during a crisis, solving problems of declining business value, man balancing on dollar coin. Decrease statistics vectors Man balancing on dollar coin
Free with trial This image shows a detailed close-up of a stock market graph depicting a significant decline. The red color emphasizes the negative trend, illustrating potential losses or economic downturn. This visualization was generated by AI for analysis and presentation purposes. Decrease statistics illustrations Red Market Decline Graph. This image shows a detailed close-up of a stock market graph depicting a significant decline. The red color emphasizes the negative trend, illustrating potential losses or economic downturn. This visualization was generated by AI for analysis and presentation purposes.
Free with trial Red downward arrow graph isolated on transparent background. Decrease statistics illustrations Red downward arrow graph
Free with trial Risk Minimization spotlighted dark or night mode web, landing. Professionals navigate financial charts, with rising arrows denoting growth. Compass points to reduced risk. Flat vector illustration. Decrease statistics vectors Risk Minimization spotlighted. Professionals navigate financial charts. Risk Minimization spotlighted dark or night mode web, landing. Professionals navigate financial charts, with rising arrows denoting growth. Compass points to reduced risk. Flat vector illustration.
Free with trial A simple, bold red arrow trending downwards against a white background. The arrow zigzags downwards, ending with an arrowhead pointing down, resting on a horizontal red line. This image represents concepts like financial loss, economic downturn, market crash, failure, and negative trends. It's suitable for illustrating articles, presentations, or reports dealing with business, finance, and economics. Decrease statistics illustrations Red Downward Trend Arrow. A simple, bold red arrow trending downwards against a white background. The arrow zigzags downwards, ending with an arrowhead pointing down, resting on a horizontal red line. This image represents concepts like financial loss, economic downturn, market crash, failure, and negative trends. It's suitable for illustrating articles, presentations, or reports dealing with business, finance, and economics.
Free with trial Risky choice of strategy or development path, obstacles and difficulties in achieving goals, fierce competition in labor market, loss of funds in high-risk investment, a man falls down with word risk. Decrease statistics vectors Man falls down with word risk
Free with trial Decreasing bar graph in ice cube. 3d illustration. Decrease statistics illustrations Decreasing bar graph in ice cube
Free with trial A visually striking image capturing a bar chart, line graph, and pie chart meticulously drawn in the wet sand on a beach. The artwork is illuminated by the warm, golden light of a sunset, with gentle waves lapping at the shore. This represents concepts of financial growth, market analysis, and business success in a unique, natural setting. The image evokes themes of planning, progress, and the cyclical nature of markets. Decrease statistics illustrations Financial Growth Chart and Pie Chart Drawn in Sand at Sunset. A visually striking image capturing a bar chart, line graph, and pie chart meticulously drawn in the wet sand on a beach. The artwork is illuminated by the warm, golden light of a sunset, with gentle waves lapping at the shore. This represents concepts of financial growth, market analysis, and business success in a unique, natural setting. The image evokes themes of planning, progress, and the cyclical nature of markets.
Free with trial Financial and economic improvement during stock market crash, stabilizing value of foreign currency, rising incomes and wages, countering inflation, preserving savings, man protects dollar from arrow. Decrease statistics vectors Man protects dollar from arrow
Free with trial Graph Down glyph vector icon isolated. Graph Down stock vector icon for web, mobile app and ui design. Decrease statistics vectors Graph Down glyph vector icon
Free with trial A simple graphic illustration of a bar chart. The chart features four bars of varying heights, indicating growth or progress. The design is clean and minimalist, making it suitable for a wide range of applications such as presentations, reports, and infographics. The black bars stand out against the white background, providing a clear visual representation of data. Decrease statistics illustrations Bar Chart Icon. A simple graphic illustration of a bar chart. The chart features four bars of varying heights, indicating growth or progress. The design is clean and minimalist, making it suitable for a wide range of applications such as presentations, reports, and infographics. The black bars stand out against the white background, providing a clear visual representation of data.
Free with trial A visual representation of data, showcasing trends and comparisons through a green bar chart. This graphic illustrates statistical information and growth patterns effectively. Decrease statistics illustrations Bar chart data analysis on. A visual representation of data, showcasing trends and comparisons through a green bar chart. This graphic illustrates statistical information and growth patterns effectively
Free with trial Two 3D arrows, one red pointing down and one green pointing up, symbolizing contrasting financial trends or data analysis. Visual representation of market fluctuations. Decrease statistics illustrations Arrow chart up and down on. Two 3D arrows, one red pointing down and one green pointing up, symbolizing contrasting financial trends or data analysis. Visual representation of market fluctuations
Free with trial Three orange bar graphs illustrating different data patterns increasing, decreasing, and varied. Ideal for presentations or data visualization. Simple and visually appealing design. Decrease statistics illustrations Orange Bar Graph Variations. Three orange bar graphs illustrating different data patterns increasing, decreasing, and varied. Ideal for presentations or data visualization. Simple and visually appealing design.
Free with trial This 3D rendering shows a circular arrangement of red arrows pointing downwards, illustrating a negative trend. The image is generated by AI and is perfect for representing concepts like market decline, economic downturn, or loss. Decrease statistics illustrations Circular Red Downward Arrow. This 3D rendering shows a circular arrangement of red arrows pointing downwards, illustrating a negative trend. The image is generated by AI and is perfect for representing concepts like market decline, economic downturn, or loss.
Free with trial A graphic illustration featuring two distinct charts on a white background. The upper chart displays three descending lines in black, red, and green, each ending with a downward-pointing arrow. Below this, a bar chart shows three black bars of increasing height, with arrows pointing upwards from the tallest bars. A stylized black graphic element resembling diverging paths or a funnel is positioned. Decrease statistics vectors Downward and upward trending graphs with arrows chart. A graphic illustration featuring two distinct charts on a white background. The upper chart displays three descending lines in black, red, and green, each ending with a downward-pointing arrow. Below this, a bar chart shows three black bars of increasing height, with arrows pointing upwards from the tallest bars. A stylized black graphic element resembling diverging paths or a funnel is positioned
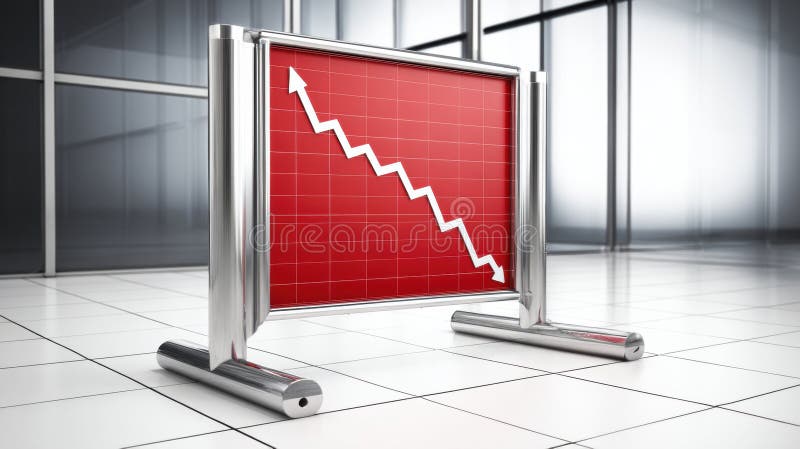
Free with trial This image shows a red graph displaying a downward trend, generated by AI. The graph is presented on a freestanding, metallic sign, suggesting a public display of economic or market data indicating a decline or downturn. The clean, modern setting adds to the professional feel, implying a serious fi. Decrease statistics illustrations AI-Generated Declining Graph. This image shows a red graph displaying a downward trend, generated by AI. The graph is presented on a freestanding, metallic sign, suggesting a public display of economic or market data indicating a decline or downturn. The clean, modern setting adds to the professional feel, implying a serious fi
Free with trial A row of colorful wooden blocks, resembling a bar graph, sits on a dark wooden surface. The blocks are various heights and colors, creating a visually appealing and potentially symbolic representation of growth or data. Decrease statistics illustrations Colorful Wooden Blocks Chart. A row of colorful wooden blocks, resembling a bar graph, sits on a dark wooden surface. The blocks are various heights and colors, creating a visually appealing and potentially symbolic representation of growth or data.
Free with trial A hand holds a piece of paper with a hand-drawn graph showing a sharp decline. The downward trend is clearly visible, indicating a negative development. This image was generated by AI and is ideal for illustrating concepts like economic downturn, market crash, or business failure. Decrease statistics illustrations Hand Holding Declining Graph. A hand holds a piece of paper with a hand-drawn graph showing a sharp decline. The downward trend is clearly visible, indicating a negative development. This image was generated by AI and is ideal for illustrating concepts like economic downturn, market crash, or business failure.
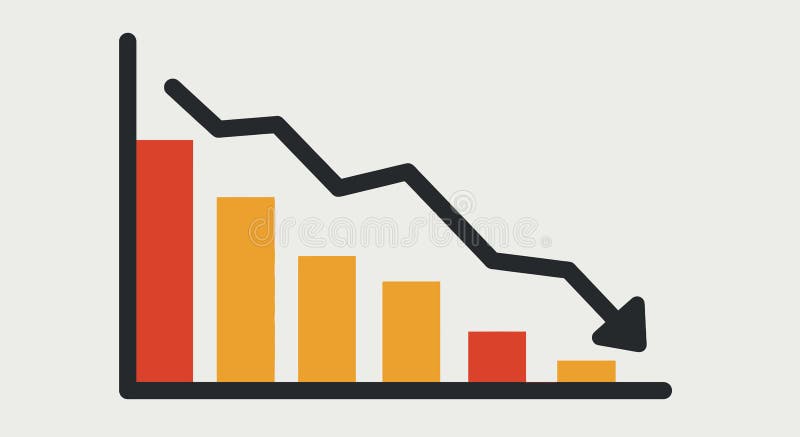
Free with trial This image showcases a colorful bar graph with a downward-pointing arrow, generated by AI, illustrating a negative trend or decline. The vibrant colors and simplistic design make the message clear and easily understood. The image is perfect for representing economic downturns, market dips, or any s. Decrease statistics illustrations Downward Trend Visualization. This image showcases a colorful bar graph with a downward-pointing arrow, generated by AI, illustrating a negative trend or decline. The vibrant colors and simplistic design make the message clear and easily understood. The image is perfect for representing economic downturns, market dips, or any s
Free with trial Bar graphs data illustration company year, color performance, categories trend bar graphs data. Decrease statistics illustrations Bar graphs data
Free with trial Revenue absorbing sales graph illustration growth metrics, visualization insights, forecast dashboard revenue absorbing sales graph. Decrease statistics illustrations Revenue absorbing sales graph