Free with trial Three miniature apartment building models are shown against a backdrop of a stock market graph illustrating real estate trends. Decrease statistics illustrations Apartment Building Models Illustrate Real Estate Market Trends. Three miniature apartment building models are shown against a backdrop of a stock market graph illustrating real estate trends
Free with trial Isolated illustration of a person with a hoodie and line graph. Perfect for business and investment concepts. Decrease statistics vectors Person with Graph in Hoodie Cartoon - Business, Growth, Investment, Trends. Isolated illustration of a person with a hoodie and line graph. Perfect for business and investment concepts.
Free with trial Bar graph and line chart showing performance decline, icons of person and movement, and a sad face symbol. Ideal for data trends, business analysis, failure, mood, feedback, decision-making. Decrease statistics illustrations Declining Trends in Data Analysis with Emotional Impact Represented by Sad Face Icon. Bar graph and line chart showing performance decline, icons of person and movement, and a sad face symbol. Ideal for data trends, business analysis, failure, mood, feedback, decision-making
Free with trial Red Line Graph Showing Growth and Fluctuation on White Grid Paper, generative Ai. Decrease statistics illustrations Red Line Graph Showing Growth and Fluctuation on White Grid Paper
Free with trial Chart with downward trend, sad face indicating negative results, user profile photo with verification checkmark. Ideal for performance, feedback, user analytics, identity, emotions, progress. Decrease statistics illustrations Declining Performance Chart with Sad Face and User Profile Verification Concept. Chart with downward trend, sad face indicating negative results, user profile photo with verification checkmark. Ideal for performance, feedback, user analytics, identity, emotions, progress
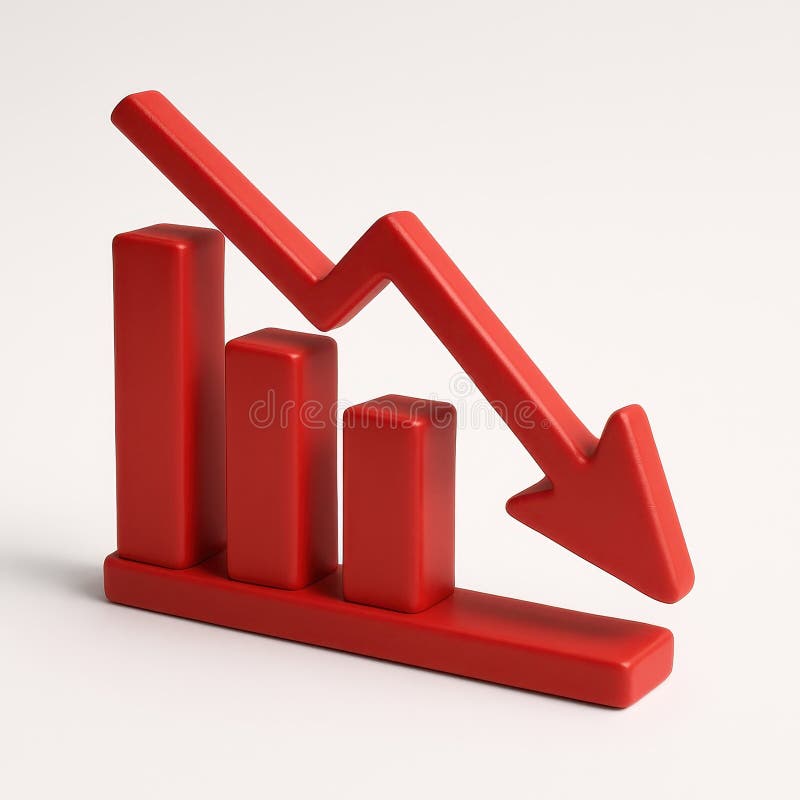
Free with trial A visual representation of negative financial performance, illustrating a declining trend in business or market data with a prominent red arrow indicating a downward movement. Decrease statistics illustrations Bar chart showing a downward trend with a red arrow. A visual representation of negative financial performance, illustrating a declining trend in business or market data with a prominent red arrow indicating a downward movement
Free with trial The business concept of both crisis and recovery. Decrease statistics illustrations Business concept of both crisis and recovery
Free with trial Stock market graph displaying downward trend with red indicators. Generative AI. Decrease statistics illustrations Stock market graph displaying downward trend with red indicators
Free with trial Nine simple black line illustrations of various charts and graphs. Decrease statistics vectors Collection of Hand Drawn Charts and Graphs for Data Visualization. Nine simple black line illustrations of various charts and graphs
Free with trial The image showcases a sophisticated data visualization dashboard presenting global information via interactive maps, charts, and graphs. Decrease statistics illustrations Global Data Visualization Dashboard Displays Complex Information. The image showcases a sophisticated data visualization dashboard presenting global information via interactive maps, charts, and graphs
Free with trial This 3D illustration shows a colorful bar graph with pastel-colored cylinders on a white circular base, representing upward business growth trends. The chart includes a line graph illustrating various data points. Decrease statistics illustrations 3D Colorful Cylindrical Bar Graph Chart Showing Business Growth. This 3D illustration shows a colorful bar graph with pastel-colored cylinders on a white circular base, representing upward business growth trends. The chart includes a line graph illustrating various data points.
Free with trial A set of twelve minimalist data visualization icons, featuring charts, graphs, and other data-related symbols. Perfect for presentations, reports, and dashboards, showcasing data analysis and growth trends. The clean design ensures readability and professional appeal. Decrease statistics illustrations Data Visualization Icons
Free with trial Downward Trend Bar Chart Showing Losses with a Declining Red Arrow. Decrease statistics vectors Downward Trend Bar Chart Showing Losses with a Declining Red Arrow
Free with trial Set of twelve colorful line icons representing various types of data visualization methods, including bar charts, line graphs, pie charts, and more. Perfect for presentations, reports, or websites. Decrease statistics illustrations Data Visualization Icons. Set of twelve colorful line icons representing various types of data visualization methods, including bar charts, line graphs, pie charts, and more. Perfect for presentations, reports, or websites.
Free with trial Abstract financial graph fluctuating over dark textured surface Images are created using AI. Decrease statistics illustrations Abstract financial graph fluctuating over dark textured surface
Free with trial Line graph icons set simple clean and smooth line and fill vector icons in black on a white background. Decrease statistics vectors Line graph icons set simple clean and smooth line and fill vector icons in black
Free with trial Candlestick chart line icon. Continuous line with share plane. Analytics graph sign. Market analytics symbol. 3d heart in speech bubble. Candlestick chart single line ribbon. Vector. Decrease statistics vectors Candlestick chart line icon. Analytics graph sign. Continuous line with plane. Vector. Candlestick chart line icon. Continuous line with share plane. Analytics graph sign. Market analytics symbol. 3d heart in speech bubble. Candlestick chart single line ribbon. Vector
Free with trial Stock market showing closeup of stock market display with green and red percentage changes and arrows. resolution use. Clear details and vibrant colors enhance visual appeal. stock market, financial data, percentage changes. Decrease statistics illustrations Closeup of stock market display with green and red percentage changes and arrows. Stock market showing closeup of stock market display with green and red. Stock market showing closeup of stock market display with green and red percentage changes and arrows. resolution use. Clear details and vibrant colors enhance visual appeal. stock market, financial data, percentage changes
Free with trial Design a simple, minimalistic red downward arrow shaped like a folded ribbon or zigzag line. The arrow should start from the top left and sharply descend in a few angular segments, ending in a clean, bold point facing down. Use flat colors (primarily red) with minimal or no shading. The overall style should be clean and modern, with no gradients, textures, or background details�just a plain white background and a bold, geometric arrow indicating decline. Decrease statistics vectors Red Down Arrow Symbolizing Economic Recession or Financial Crisis. Design a simple, minimalistic red downward arrow shaped like a folded ribbon or zigzag line. The arrow should start from the top left and sharply descend in a few angular segments, ending in a clean, bold point facing down. Use flat colors (primarily red) with minimal or no shading. The overall style should be clean and modern, with no gradients, textures, or background details�just a plain white background and a bold, geometric arrow indicating decline.
Free with trial A hand draws a downward trending graph on a whiteboard, illustrating a market decline. This image, generated by AI, is perfect for illustrating concepts like economic downturn, market analysis, or financial forecasting. The simple yet effective visual communicates the message instantly. Decrease statistics illustrations AI-Generated Market Trend. A hand draws a downward trending graph on a whiteboard, illustrating a market decline. This image, generated by AI, is perfect for illustrating concepts like economic downturn, market analysis, or financial forecasting. The simple yet effective visual communicates the message instantly.
Free with trial Abstract digital illustration depicting two contrasting glowing line graphs. A vibrant blue/cyan line trends steeply upwards with an arrow, while a bright red line trends downwards with its arrow, crossing over the blue line mid-way. Subtle dotted lines and sparkling light effects add detail against the dark, moody background. This dynamic image conveys energy and volatility, suitable for representing concepts like market fluctuations, contrasting financial trends (growth vs. decline), stock market analysis, competition, data comparison, economic divergence, risk assessment, and critical crossover points. Ideal for financial reports, articles on market volatility, illustrating competitive analysis, or business strategy presentations. Decrease statistics illustrations Contrasting red downward and blue upward glowing graph arrows crossing. Abstract digital illustration depicting two contrasting glowing line graphs. A vibrant blue/cyan line trends steeply upwards with an arrow, while a bright red line trends downwards with its arrow, crossing over the blue line mid-way. Subtle dotted lines and sparkling light effects add detail against the dark, moody background. This dynamic image conveys energy and volatility, suitable for representing concepts like market fluctuations, contrasting financial trends (growth vs. decline), stock market analysis, competition, data comparison, economic divergence, risk assessment, and critical crossover points. Ideal for financial reports, articles on market volatility, illustrating competitive analysis, or business strategy presentations.
Free with trial Financial concept image featuring a blue bar chart with a red downward arrow, illustrating decline, recession, or loss over time. Ideal for presentations, reports, infographics, economic forecasts, and business documentation. Clean, clear, and professional visual, created ai. Decrease statistics illustrations Business bar chart showing financial decline with downward arrow. Financial concept image featuring a blue bar chart with a red downward arrow, illustrating decline, recession, or loss over time. Ideal for presentations, reports, infographics, economic forecasts, and business documentation. Clean, clear, and professional visual, created ai.
Free with trial A white percentage symbol on a sand dune, paired with a floating red downward arrow against a pale sky. Image. Decrease statistics illustrations White Percentage Sign with Red Downward Arrow in Sandy Landscape. A white percentage symbol on a sand dune, paired with a floating red downward arrow against a pale sky. Image
Free with trial Business chart is displaying market data analytics with a candlestick chart, pie chart and line graph. Decrease statistics vectors Business chart displaying market data analytics with candlestick chart, pie chart and line graph
Free with trial Pie chart segments, sad face with declining graph, and a grid globe with bars suggest economic downturn. Ideal for finance, global crisis, analytics, investment, statistics, risk and simple flat. Decrease statistics vectors Financial Decline Concept with Pie Chart, Downward Graph, and Global Representation. Pie chart segments, sad face with declining graph, and a grid globe with bars suggest economic downturn. Ideal for finance, global crisis, analytics, investment, statistics, risk and simple flat
Free with trial Downward line graph with data points, sad orange face symbolizing negativity, and a robot suggesting AI involvement or automation. Ideal for business, AI, automation, data analysis, technology. Decrease statistics vectors Declining Chart with Robot and Sad Face Indicating Negative Trends and AI Interaction. Downward line graph with data points, sad orange face symbolizing negativity, and a robot suggesting AI involvement or automation. Ideal for business, AI, automation, data analysis, technology
Free with trial Hand holding a house icon with a rising graph and percentage symbols indicating interest rates. Decrease statistics illustrations Hand holding house icon with rising percentage graph and interes. Hand holding a house icon with a rising graph and percentage symbols indicating interest rates
Free with trial A vibrant 3D rendering featuring a black minus and percentage sign combination, set against a playful, irregularly shaped pink background with a bright green border. The icon is prominently displayed on a dark, textured surface, creating a modern and eye-catching visual. This graphic effectively symbolizes discounts, sales, price reductions, and special offers, making it ideal for e-commerce promotions, marketing campaigns, financial presentations, or any content related to savings and deals. Decrease statistics illustrations Vibrant 3D Minus Percentage Icon for Discount and Sale Promotions. A vibrant 3D rendering featuring a black minus and percentage sign combination, set against a playful, irregularly shaped pink background with a bright green border. The icon is prominently displayed on a dark, textured surface, creating a modern and eye-catching visual. This graphic effectively symbolizes discounts, sales, price reductions, and special offers, making it ideal for e-commerce promotions, marketing campaigns, financial presentations, or any content related to savings and deals.
Free with trial A stack of yellow coins decreasing in height with red downward arrow symbolizes global financial loss or economic decline. Generative AI. Decrease statistics illustrations Stack of yellow coins decreasing in height with red downward arrow. Generative AI. A stack of yellow coins decreasing in height with red downward arrow symbolizes global financial loss or economic decline. Generative AI
Free with trial Diagram chart line icon. Halftone dotted pattern. Gradient icon with grain shadow. Presentation graph sign. Market analytics symbol. Line diagram chart icon. Various designs. Vector. Decrease statistics vectors Diagram chart line icon. Presentation graph sign. Halftone dotted pattern. Vector. Diagram chart line icon. Halftone dotted pattern. Gradient icon with grain shadow. Presentation graph sign. Market analytics symbol. Line diagram chart icon. Various designs. Vector
Free with trial Economic recovery concept with the line charts. Decrease statistics illustrations Economic recovery concept with the line charts
Free with trial A 3D golden percentage symbol on white background, ideal for financial and business presentations. High-quality render. Decrease statistics illustrations Golden percentage symbol isolated on white background for finance. A 3D golden percentage symbol on white background, ideal for financial and business presentations. High-quality render
Free with trial This image features a vibrant 3D representation of a bar chart, composed of translucent, glowing blocks in shades of pink, yellow, and cyan. The bars are arranged in varying heights, suggesting growth or data representation. The background is a dark green digital grid with subtle light effects and floating particles, creating a futuristic and technological atmosphere. This visual is ideal for concepts related to finance, data analysis, technology, growth, and digital trends. Decrease statistics illustrations Abstract 3D Bar Chart with Neon Glow on Green Digital Background. This image features a vibrant 3D representation of a bar chart, composed of translucent, glowing blocks in shades of pink, yellow, and cyan. The bars are arranged in varying heights, suggesting growth or data representation. The background is a dark green digital grid with subtle light effects and floating particles, creating a futuristic and technological atmosphere. This visual is ideal for concepts related to finance, data analysis, technology, growth, and digital trends.
Free with trial Cityscape at sunset with overlayed red stock market graph showing decline. Decrease statistics illustrations Cityscape at sunset with overlayed red stock market graph showing
Free with trial Doodle style bar and line graph icon representing growth and analytics. Decrease statistics vectors Doodle style bar and line graph icon representing growth and analytics
Free with trial Financial crisis, economic downturn, stock market crash, recession, decreasing profits, falling revenue, business loss, investment loss, financial instability, economic decline, money loss. Decrease statistics vectors Falling Stock Market Graph Showing Financial Crisis and Recession. Financial crisis, economic downturn, stock market crash, recession, decreasing profits, falling revenue, business loss, investment loss, financial instability, economic decline, money loss.
Free with trial This cheerful 3D rendered illustration depicts a friendly cartoon businessman confidently presenting positive business growth charts and data, showcasing key performance indicators and financial success. The image is ideal for business, finance, and marketing concepts. Decrease statistics illustrations Charming 3D Cartoon Businessman Presenting Growth Charts and Data. This cheerful 3D rendered illustration depicts a friendly cartoon businessman confidently presenting positive business growth charts and data, showcasing key performance indicators and financial success. The image is ideal for business, finance, and marketing concepts.
Free with trial Bar graph depicts a downward trend in data, using various colors to illustrate the decline effectively. Decrease statistics illustrations Graph illustrating data trends showing a steady decline over time. Bar graph depicts a downward trend in data, using various colors to illustrate the decline effectively.
Free with trial A red, dotted world globe is overlaid with a declining stock market chart, symbolizing a global economic downturn. The image conveys financial crisis and market volatility. Decrease statistics illustrations Global Market Downturn: Red World Globe with Declining Stock Chart. A red, dotted world globe is overlaid with a declining stock market chart, symbolizing a global economic downturn. The image conveys financial crisis and market volatility
Free with trial A single, glossy, bright green arrow pointing downwards. The arrow has a rounded, three-dimensional appearance with highlights indicating a shiny surface. It is presented in isolation against a clean white background. Decrease statistics illustrations Glossy Green Down Arrow Symbol on White Background direction icon. A single, glossy, bright green arrow pointing downwards. The arrow has a rounded, three-dimensional appearance with highlights indicating a shiny surface. It is presented in isolation against a clean white background
Free with trial Candlestick chart line icon. Halftone dotted pattern. Gradient icon with grain shadow. Analytics graph sign. Market analytics symbol. Line candlestick chart icon. Various designs. Vector. Decrease statistics vectors Candlestick chart line icon. Analytics graph sign. Halftone dotted pattern. Vector. Candlestick chart line icon. Halftone dotted pattern. Gradient icon with grain shadow. Analytics graph sign. Market analytics symbol. Line candlestick chart icon. Various designs. Vector
Free with trial Bar graph consisting of rectangular blocks in different colors: blue, green, yellow, orange, purple, and pink, decreasing in height. Overlaying the graph is a bold, zigzagging red arrow pointing downward, representing a declining trend. The red arrow contrasts sharply with the pastel-colored bars, emphasizing a negative change or trend. Set against a white background for clarity and focus. Decrease statistics illustrations Declining Trends: A Bar Graph with a Downward Red Arrow. Generative AI. Bar graph consisting of rectangular blocks in different colors: blue, green, yellow, orange, purple, and pink, decreasing in height. Overlaying the graph is a bold, zigzagging red arrow pointing downward, representing a declining trend. The red arrow contrasts sharply with the pastel-colored bars, emphasizing a negative change or trend. Set against a white background for clarity and focus.
Free with trial Dot plot graph line icon. Halftone dotted pattern. Gradient icon with grain shadow. Presentation chart sign. Market analytics symbol. Line dot plot icon. Various designs. Vector. Decrease statistics vectors Dot plot graph line icon. Presentation chart sign. Halftone dotted pattern. Vector. Dot plot graph line icon. Halftone dotted pattern. Gradient icon with grain shadow. Presentation chart sign. Market analytics symbol. Line dot plot icon. Various designs. Vector
Free with trial Stock market chart showing a downward trend with red and green candlesticks indicating price fluctuations. A moving average line overlays the candlesticks. Volume bars at the bottom correlate with trading activity, mostly red, suggesting higher selling pressure. Vertical axis shows price levels, and horizontal axis depicts time. The chart originates from Cendlewe (Bearits). Candlestick shapes and colors represent price movements over time, with red indicating a decrease and green an increase. Decrease statistics illustrations Dynamic stock market chart shows downward trend with red and green candlesticks and volume bars. Stock market chart showing a downward trend with red and green candlesticks indicating price fluctuations. A moving average line overlays the candlesticks. Volume bars at the bottom correlate with trading activity, mostly red, suggesting higher selling pressure. Vertical axis shows price levels, and horizontal axis depicts time. The chart originates from Cendlewe (Bearits). Candlestick shapes and colors represent price movements over time, with red indicating a decrease and green an increase.
Free with trial This graphic depicts data insights through a visually appealing bar chart connected by flowing lines, symbolizing the interconnectedness of data points and the flow of information. The varying heights of the bars represent different data values, showcasing growth or trends. The design is clean and. Decrease statistics illustrations Data Insights Visualization. This graphic depicts data insights through a visually appealing bar chart connected by flowing lines, symbolizing the interconnectedness of data points and the flow of information. The varying heights of the bars represent different data values, showcasing growth or trends. The design is clean and
Free with trial Hand drawn bar chart illustration showing downward trend with arrow. Decrease statistics vectors Hand drawn bar chart illustration showing downward trend with arrow
Free with trial A digital screen displays a stark red line graph showing a significant downward trend. The graph is set against a grid background, emphasizing the sharp decline. The image conveys a sense of financial loss, economic downturn, or negative performance. Generated by AI. Decrease statistics illustrations Digital screen displaying a sharp downward trending red line graph. A digital screen displays a stark red line graph showing a significant downward trend. The graph is set against a grid background, emphasizing the sharp decline. The image conveys a sense of financial loss, economic downturn, or negative performance. Generated by AI.
Free with trial A 3D render of a fluctuating arrow pointing down. Symbolizes financial decline, stock market loss, or a negative data trend. Ideal for business infographics. Isolated. Decrease statistics illustrations 3D Arrow Down Icon for Financial Decline, Stock Market Loss, and Graph. A 3D render of a fluctuating arrow pointing down. Symbolizes financial decline, stock market loss, or a negative data trend. Ideal for business infographics. Isolated
Free with trial Large pie chart alongside heart and drooping plant with dashed line. Ideal for data analysis, loss, emotional impact, decline, sustainability, environmental issues, simple flat metaphor. Decrease statistics vectors Pie Chart with Heart Symbol and Wilting Plant Representing Decline and Emotional Impact. Large pie chart alongside heart and drooping plant with dashed line. Ideal for data analysis, loss, emotional impact, decline, sustainability, environmental issues, simple flat metaphor
Free with trial A hand holding a pen traces a red downward trending stock market chart, symbolizing a bear market or financial downturn. The background shows stock data. Decrease statistics illustrations Bear Market Analysis: Hand with Pen Tracing a Declining Stock Chart. A hand holding a pen traces a red downward trending stock market chart, symbolizing a bear market or financial downturn. The background shows stock data
Free with trial Graph line icons. Interest rate, AI generate, Inflation icons. Set of Chart presentation, Report, Increase growth graph icons. Analytics testing, Falling demand, Pie chart report. Vector. Decrease statistics vectors Graph line icons. Set of Chart presentation, Report and Increase growth graph icons. App line icons. Vector. Graph line icons. Interest rate, AI generate, Inflation icons. Set of Chart presentation, Report, Increase growth graph icons. Analytics testing, Falling demand, Pie chart report. Vector
Free with trial A striking 3D render visualizes economic decline with a vibrant red bar graph against a clean white background. This impactful image vividly represents a financial crisis and recession, showcasing a clear downward trend through its falling bars and an implied arrow. It symbolizes loss, failure, and potential bankruptcy within the business and finance sectors. Ideal for illustrating articles on the. Decrease statistics illustrations Red economic decline bar graph depicting financial downfall and negative trends on white background. A striking 3D render visualizes economic decline with a vibrant red bar graph against a clean white background. This impactful image vividly represents a financial crisis and recession, showcasing a clear downward trend through its falling bars and an implied arrow. It symbolizes loss, failure, and potential bankruptcy within the business and finance sectors. Ideal for illustrating articles on the
Free with trial A set of six black outline icons depicting magnifying glasses, graphs, a computer monitor displaying a waveform, and network connections. Decrease statistics vectors Magnifying glass and data analysis icons with graphs and monitor search. A set of six black outline icons depicting magnifying glasses, graphs, a computer monitor displaying a waveform, and network connections
Free with trial A person is using a stylus to interact with a digital display showing a graph that illustrates quality improvement alongside cost reduction. Focus on effective business strategies. Decrease statistics illustrations Quality improvement with cost reduction strategy on digital display. A person is using a stylus to interact with a digital display showing a graph that illustrates quality improvement alongside cost reduction. Focus on effective business strategies
Free with trial A glowing green bar chart with a data line and grid on a black background, representing financial performance. Decrease statistics illustrations Glowing Green Bar Chart with Data Line on photo Black graph finance. A glowing green bar chart with a data line and grid on a black background, representing financial performance
Free with trial Hand drawn downward trending bar graph with arrow indicating decline. Decrease statistics vectors Hand drawn downward trending bar graph with arrow indicating decline
Free with trial Decreasing bar chart diagram with down arrow showing negative growth. Decrease statistics vectors Decreasing bar chart diagram with down arrow showing negative growth
Free with trial Falling bar graph with a red arrow indicating decline and a rising scale. Decrease statistics vectors Falling bar graph with a red arrow indicating decline and a rising scale
Free with trial Simple bar graph showing downward trend with arrow, decline in progress. Decrease statistics vectors Simple bar graph showing downward trend with arrow, decline in progress
Free with trial Vector drawing illustration stacked coins and arrow trending down, decreasing statistical graphic concept, drawn in black and white color. Decrease statistics vectors Vector drawn illustration black and white icon coins and down arrow trend. vector drawing illustration stacked coins and arrow trending down, decreasing statistical graphic concept, drawn in black and white color
Free with trial A man in despair grips his head as a red stock market chart plunges around him, symbolizing financial loss, crisis, and economic downturn. Dark background enhances the mood. Decrease statistics illustrations Market Crash Despair: Man Grips Head Amidst Plunging Red Stock Chart. A man in despair grips his head as a red stock market chart plunges around him, symbolizing financial loss, crisis, and economic downturn. Dark background enhances the mood
Free with trial Dynamic financial graphs and data analysis display on digital screen. That the image is generated using AI. Decrease statistics illustrations Dynamic financial graphs and data analysis display on digital screen
Free with trial A large green upward arrow stands tall, surrounded by multiple red downward arrows, symbolizing contrasting trends of growth and decline. Decrease statistics illustrations Green up arrow dominates red down arrows showing growth and decline. A large green upward arrow stands tall, surrounded by multiple red downward arrows, symbolizing contrasting trends of growth and decline
Free with trial Declining bar graph illustration, business, financial, and economic data. Decrease statistics vectors Declining bar graph illustration, business, financial, and economic data
Free with trial A vibrant, 3D rendered bar chart displays ascending data, symbolizing progress and achievement. The pastel-colored bars are set against a clean white background, emphasizing their visual impact and providing a professional, modern feel. Perfect for presentations or business-related projects. Decrease statistics illustrations Colorful 3D Bar Chart Showing Growth and Success on White Background. A vibrant, 3D rendered bar chart displays ascending data, symbolizing progress and achievement. The pastel-colored bars are set against a clean white background, emphasizing their visual impact and providing a professional, modern feel. Perfect for presentations or business-related projects.
Free with trial Downward Chart Showing Decline with Decreasing Bars and Falling Arrow. Decrease statistics vectors Downward Chart Showing Decline with Decreasing Bars and Falling Arrow
Free with trial Sketchy bar graph illustration of financial decline and economic loss. Decrease statistics vectors Sketchy bar graph illustration of financial decline and economic loss
Free with trial Downward trending chart with a declining arrow in vector illustration. Decrease statistics vectors Downward trending chart with a declining arrow in vector illustration
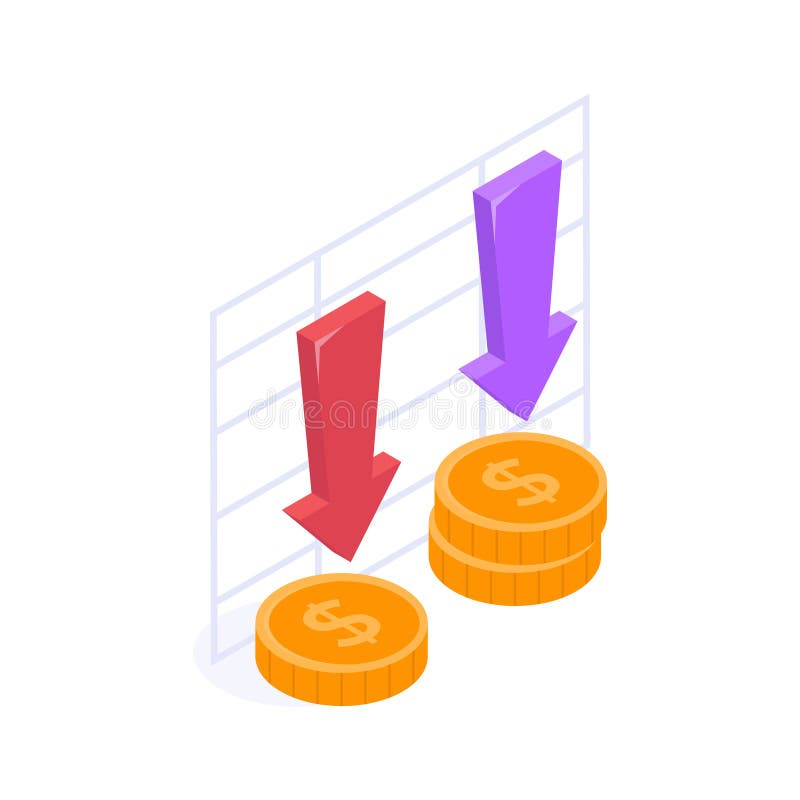
Free with trial Declining Financial Performance Depicted by Falling Arrows and Coins. Decrease statistics vectors Declining Financial Performance Depicted by Falling Arrows and Coins
Free with trial A red arrow indicates a downward trend over a colorful bar graph, isolated on a clean white background. Decrease statistics illustrations Red downward trend arrow over bar chart isolated on white background. A red arrow indicates a downward trend over a colorful bar graph, isolated on a clean white background
Free with trial Three-dimensional pie charts and cylinder graphs in orange and blue, perfect for business presentations illustrating data analysis and market trends. Decrease statistics illustrations 3D Colorful Pie Charts and Cylinder Graphs for Business Presentation. Three-dimensional pie charts and cylinder graphs in orange and blue, perfect for business presentations illustrating data analysis and market trends.
Free with trial Sad Character Observing a Declining Graph in a Minimalist Illustration j. Decrease statistics illustrations Sad Character Observing a Declining Graph in a Minimalist Illustration
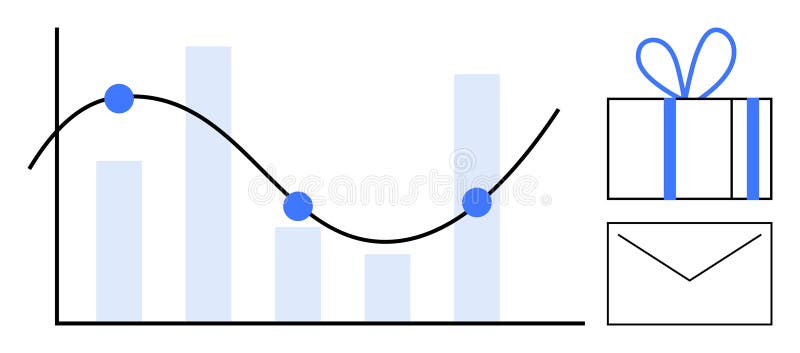
Free with trial Graph with decreasing bar chart and line graph noting key points beside a gift box and envelope. Ideal for business analysis, performance tracking, rewards programs, marketing, sales targets, client. Decrease statistics vectors Bar Graph with Line Chart, Gift Box, and Envelope Representing Business Metrics and Rewards. Graph with decreasing bar chart and line graph noting key points beside a gift box and envelope. Ideal for business analysis, performance tracking, rewards programs, marketing, sales targets, client
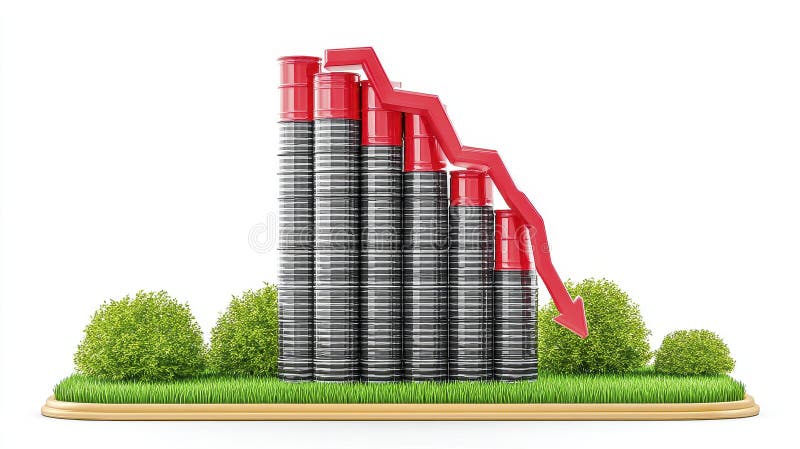
Free with trial 3D rendering of a bar graph showing a decline in production, represented by black and red cylinders on a grassy surface. The downward trend is emphasized by a red arrow AI generative. Decrease statistics illustrations Declining Production 3D Render of Bar Graph Showing a Downward Trend. 3D rendering of a bar graph showing a decline in production, represented by black and red cylinders on a grassy surface. The downward trend is emphasized by a red arrow AI generative
Free with trial Two distinct lines converge in an engaging graph, illustrating contrasting trends. The sharp gradient colors enhance the visual impact, emphasizing change and growth. Decrease statistics illustrations Dynamic Trends Revealed Through Shifting Data in Vibrant Gradient Hues. Two distinct lines converge in an engaging graph, illustrating contrasting trends. The sharp gradient colors enhance the visual impact, emphasizing change and growth
Free with trial Pie chart line icon. Neumorphic, Red gradient, 3d pin buttons. Presentation graph sign. Market analytics symbol. Line icons. Neumorphic buttons with outline signs. Vector. Decrease statistics vectors Pie chart line icon. Presentation graph sign. Line icons. Vector. Pie chart line icon. Neumorphic, Red gradient, 3d pin buttons. Presentation graph sign. Market analytics symbol. Line icons. Neumorphic buttons with outline signs. Vector
Free with trial Report document line icon. Neumorphic, Purple gradient, 3d pin buttons. Column graph sign. Growth diagram, pie chart symbol. Line icons. Neumorphic buttons with outline signs. Vector. Decrease statistics vectors Report document line icon. Column graph sign. Line icons. Vector. Report document line icon. Neumorphic, Purple gradient, 3d pin buttons. Column graph sign. Growth diagram, pie chart symbol. Line icons. Neumorphic buttons with outline signs. Vector
Free with trial Down graphic of business stats outline icon in white and black colors. down graphic of business stats flat vector icon from business collection for web, mobile apps and ui. Decrease statistics vectors Down graphic of business stats outline icon in white and black colors. down graphic of business stats flat vector icon from
Free with trial Glowing Candlestick Chart Depicting Downward Trend in Market Generative AI Illustration. Decrease statistics illustrations Glowing Candlestick Chart Depicting Downward Trend in Market
Free with trial This image showcases a vibrant infographic with 3D bar, pie, and line charts. The colorful elements are displayed on a teal platform, ideal for presentations or reports. Decrease statistics illustrations Colorful 3D Bar Chart, Pie Chart, and Line Graph Infographic on Teal Platform. This image showcases a vibrant infographic with 3D bar, pie, and line charts. The colorful elements are displayed on a teal platform, ideal for presentations or reports.