Free with trial Stacks of gold coins decrease in size with a descending red arrow, suggesting financial loss or decline, set against a dark gray background ideal for illustrating economic concepts. Illustrating decrease illustrations Golden Coins Stacked with Declining Red Arrow on Gray Surface. Stacks of gold coins decrease in size with a descending red arrow, suggesting financial loss or decline, set against a dark gray background ideal for illustrating economic concepts
Free with trial Financial Capability Month Financial chart with 3d bar graph and line plot illustrating market trends. Illustrating decrease illustrations Financial Capability Month Financial chart with 3d bar graph and line plot illustrating market trends
Free with trial Stack of coins with a red downward arrow, illustrating the effect of falling interest rates on savings, Generative AI. Illustrating decrease illustrations Stack of coins with a red downward arrow, illustrating the effect of falling interest rates on savings
Free with trial A close-up shot of a hand stacking three wooden blocks, each featuring a significant symbol. The top block displays a green upward arrow, the middle a red downward arrow, and the bottom a black percentage symbol. This visual metaphor effectively represents concepts of increase, decrease, and percentage change. Ideal for illustrating financial topics like interest rates, inflation, economic trends, profit loss, discounts, or general business performance. The clean, minimalist background offers ample copy space for text or additional graphics, making it versatile for various editorial and commercial uses. Illustrating decrease illustrations Interest Rate or Percentage Change Concept with Wooden Blocks. A close-up shot of a hand stacking three wooden blocks, each featuring a significant symbol. The top block displays a green upward arrow, the middle a red downward arrow, and the bottom a black percentage symbol. This visual metaphor effectively represents concepts of increase, decrease, and percentage change. Ideal for illustrating financial topics like interest rates, inflation, economic trends, profit loss, discounts, or general business performance. The clean, minimalist background offers ample copy space for text or additional graphics, making it versatile for various editorial and commercial uses.
Free with trial Outline vector icon of a line graph showing a downward trend in line art. Represents decrease, loss, decline, or negative performance data. Suitable for financial charts, reports, data visualization, and illustrating negative changes over time, vector design Generative AI. Illustrating decrease vectors Line Graph Downward Trend Outline, Decline Loss Chart Symbol, vector design Generative AI. Outline vector icon of a line graph showing a downward trend in line art. Represents decrease, loss, decline, or negative performance data. Suitable for financial charts, reports, data visualization, and illustrating negative changes over time, vector design Generative AI
Free with trial A bold, clean red zigzag arrow pointing downward, representing decline, decrease, drop, or negative trend. Perfect for business, finance, or data visualization projects. Illustrating decrease illustrations Red downward zigzag arrow icon illustrating decline or decrease. A bold, clean red zigzag arrow pointing downward, representing decline, decrease, drop, or. A bold, clean red zigzag arrow pointing downward, representing decline, decrease, drop, or negative trend. Perfect for business, finance, or data visualization projects
Free with trial A line graph illustrating the gradual decrease in energy consumption over several months, with lightning bolt icons transitioning to leaf icons, symbolizing a shift from high energy usage to sustainable, cost-effective practices. The x-axis represents time in months, and the y-axis shows energy consumption in kWh, clearly indicating a downward trend in energy use and associated costs. Illustrating decrease illustrations Energy Consumption Decrease Over Time Leading to Cost Reduction. A line graph illustrating the gradual decrease in energy consumption over several months, with lightning bolt icons transitioning to leaf icons, symbolizing a shift from high energy usage to sustainable, cost-effective practices. The x-axis represents time in months, and the y-axis shows energy consumption in kWh, clearly indicating a downward trend in energy use and associated costs
Free with trial Two pairs of black and white illustrating financial decline. Each pair a stylized dollar bill or receipt alongside a downward-pointing arrow. The left pair is solid black, while the right pair is. Illustrating decrease vectors Black and white representing financial decrease with dollar bill and arrows. two pairs of black and white illustrating financial decline. Each pair a stylized dollar bill or receipt alongside a downward-pointing arrow. The left pair is solid black, while the right pair is
Free with trial A grey downward curving arrow path icon, symbolizing decline, decrease, or a negative trend. Useful for financial charts, statistical graphs, and illustrating downward movements in data, vector design Generative AI. Illustrating decrease vectors Downward Curving Arrow Path for Decline, vector design Generative AI. A grey downward curving arrow path icon, symbolizing decline, decrease, or a negative trend. Useful for financial charts, statistical graphs, and illustrating downward movements in data, vector design Generative AI
Free with trial A conceptual black and white line graph depicting economic recession trends is presented on a piece of torn and crumpled paper with a worn, aged texture, featuring a hand-drawn sketch-like style with three distinct lines representing different time periods where the first line shows a sharp downward trend, the second line indicates an upward trend suggesting economic decrease, and the third line. Illustrating decrease illustrations A black and white line graph on torn crumpled paper illustrating economic recession trends with downward and upward indicators. A conceptual black and white line graph depicting economic recession trends is presented on a piece of torn and crumpled paper with a worn, aged texture, featuring a hand-drawn sketch-like style with three distinct lines representing different time periods where the first line shows a sharp downward trend, the second line indicates an upward trend suggesting economic decrease, and the third line
Free with trial Black bar graph and downward arrow icon illustrating a financial decline or negative trend. Illustrating decrease illustrations Black Bar Graph and Downward Arrow Icon Showing Decline fall decrease. Black bar graph and downward arrow icon illustrating a financial decline or negative trend
Free with trial The image shows a whiteboard with a bar chart illustrating a series of bars that decrease in height. A red downward arrow is drawn over the bars, indicating a decline or negative trend. The whiteboard is set on a simple wooden easel with a small wooden figure on top, emphasizing the visual message of a downward trajectory in data or performance metrics. Illustrating decrease illustrations Declining growth represented by a bar chart with a downward trend arrow. The image shows a whiteboard with a bar chart illustrating a series of bars that decrease in height. A red downward arrow is drawn over the bars, indicating a decline or negative trend. The whiteboard is set on a simple wooden easel with a small wooden figure on top, emphasizing the visual message of a downward trajectory in data or performance metrics
Free with trial The image displays three separate visual representations of waveforms, likely depicting sound or audio signals. The top waveform shows a dense and irregular pattern, indicating varying frequencies and amplitudes. The middle waveform appears more structured with a gradual increase and decrease in amplitude, forming a smooth, elongated shape. The bottom waveform consists of multiple overlapping,. Illustrating decrease illustrations Three distinct waveforms illustrating sound wave intensity and patterns. The image displays three separate visual representations of waveforms, likely depicting sound or audio signals. The top waveform shows a dense and irregular pattern, indicating varying frequencies and amplitudes. The middle waveform appears more structured with a gradual increase and decrease in amplitude, forming a smooth, elongated shape. The bottom waveform consists of multiple overlapping,
Free with trial Falling red arrow illustrating financial downturn on dark grid statistics decline Can be used as a banner or header image. Illustrating decrease illustrations Falling red arrow illustrating financial downturn on dark grid , statistics, decline. Falling red arrow illustrating financial downturn on dark grid statistics decline Can be used as a banner or header image
Free with trial The image depicts a downward red arrow intersecting with a green house icon and a euro symbol, symbolizing a decrease in housing prices or mortgage rates in the European economic context. The percentage sign emphasizes the financial aspect of the decline, suggesting economic trends or market downturns affecting real estate costs. Illustrating decrease illustrations Graphic illustrating a decline in housing prices and interest rates in euros. The image depicts a downward red arrow intersecting with a green house icon and a euro symbol, symbolizing a decrease in housing prices or mortgage rates in the European economic context. The percentage sign emphasizes the financial aspect of the decline, suggesting economic trends or market downturns affecting real estate costs
Free with trial The image features a golden dollar symbol surrounded by two opposing arrows, one green pointing upward and the other red pointing downward, symbolizing financial increase and decrease or economic fluctuations. Illustrating decrease illustrations Dynamic arrows illustrating financial growth and decline with dollar symbol. The image features a golden dollar symbol surrounded by two opposing arrows, one green pointing upward and the other red pointing downward, symbolizing financial increase and decrease or economic fluctuations
Free with trial The image shows a bar graph with a red line indicating a downward trend. The bars decrease in height from left to right, suggesting a significant decline in the measured data over time. Illustrating decrease illustrations A downward trend graph illustrating a significant decrease in data over time. The image shows a bar graph with a red line indicating a downward trend. The bars decrease in height from left to right, suggesting a significant decline in the measured data over time
Free with trial The image shows a bar chart with a red downward-sloping line overlay, illustrating a clear decline in values over a series of intervals. The bars progressively decrease in height from left to right, emphasizing a consistent downward trend in the data represented. Illustrating decrease illustrations Decline in performance or value represented by a downward trending bar chart. The image shows a bar chart with a red downward-sloping line overlay, illustrating a clear decline in values over a series of intervals. The bars progressively decrease in height from left to right, emphasizing a consistent downward trend in the data represented
Free with trial The image shows an easel holding a white poster with a blue bar and line chart. The chart depicts a series of vertical bars that gradually decrease in height, accompanied by a line graph that rises initially and then declines. The easel is positioned on a plain, light-colored background, emphasizing the visual data presentation on the poster. Illustrating decrease illustrations Easel displaying a bar and line chart illustrating financial or data trends. The image shows an easel holding a white poster with a blue bar and line chart. The chart depicts a series of vertical bars that gradually decrease in height, accompanied by a line graph that rises initially and then declines. The easel is positioned on a plain, light-colored background, emphasizing the visual data presentation on the poster
Free with trial The image shows a central upward-pointing red arrow with a percent sign, indicating an increase, flanked by two downward-pointing red arrows on either side, symbolizing decreases or fluctuations in percentage values. This visual metaphor is often used to represent changes in metrics, financial trends, or statistical variations. Illustrating decrease illustrations Graphic illustrating percentage increase and decrease with directional arrows. The image shows a central upward-pointing red arrow with a percent sign, indicating an increase, flanked by two downward-pointing red arrows on either side, symbolizing decreases or fluctuations in percentage values. This visual metaphor is often used to represent changes in metrics, financial trends, or statistical variations
Free with trial A detailed graph illustrating the decrease in federal reserve rate cuts, with a prominent red line indicating a downward trend and various colored bars representing different data points. Illustrating decrease illustrations Graph showing decline in federal reserve rate cuts over time with downward trend. A detailed graph illustrating the decrease in federal reserve rate cuts, with a prominent red line indicating a downward trend and various colored bars representing different data points
Free with trial The image shows a bar graph with a red line trending downward, indicating a significant decline in data points over time. The bars start tall on the left and gradually decrease in height towards the right, with the red line sharply descending, emphasizing the negative trend. Illustrating decrease illustrations A downward trend graph illustrating a significant decline in data points over time. The image shows a bar graph with a red line trending downward, indicating a significant decline in data points over time. The bars start tall on the left and gradually decrease in height towards the right, with the red line sharply descending, emphasizing the negative trend
Free with trial The image depicts a red downward trending arrow over a pile of gold coins, symbolizing a decrease in financial value or economic downturn. Illustrating decrease illustrations A downward trending arrow over a pile of gold coins illustrating financial decline. The image depicts a red downward trending arrow over a pile of gold coins, symbolizing a decrease in financial value or economic downturn
Free with trial The image depicts a bar chart with a superimposed red line showing a clear downward trend. Each bar represents a progressively smaller value, indicating a consistent decrease in data over time. The chart uses a gradient from taller to shorter bars, suggesting a significant drop in the measured quantity, which is reinforced by the downward-sloping line connecting the tops of the bars. Illustrating decrease illustrations Declining bar chart graph illustrating a downward trend in data values over time. The image depicts a bar chart with a superimposed red line showing a clear downward trend. Each bar represents a progressively smaller value, indicating a consistent decrease in data over time. The chart uses a gradient from taller to shorter bars, suggesting a significant drop in the measured quantity, which is reinforced by the downward-sloping line connecting the tops of the bars
Free with trial A pyramid composed of glowing stacked blocks in a gradient from dark blue to radiant orange at the top, set against a dark background. The apex features a bright, candle-like flame. The blocks decrease in size as they ascend, creating a dynamic, upward-moving visualization suggestive of upward mobility. Small glowing particles surround the pyramid, enhancing its luminous effect. Illustrating decrease illustrations A captivating, dynamic visualization illustrating the process of upward mobility as a radiant. A pyramid composed of glowing stacked blocks in a gradient from dark blue to radiant orange at the top, set against a dark background. The apex features a bright, candle-like flame. The blocks decrease in size as they ascend, creating a dynamic, upward-moving visualization suggestive of upward mobility. Small glowing particles surround the pyramid, enhancing its luminous effect.
Free with trial Falling red arrow illustrating financial downturn on dark grid stock market economic crisis graph Vector illustration for high-quality printing. Illustrating decrease illustrations Falling red arrow illustrating financial downturn on dark grid , stock market, economic crisis, graph. Falling red arrow illustrating financial downturn on dark grid stock market economic crisis graph Vector illustration for high-quality printing
Free with trial Falling red arrow on a financial graph illustrating economic downturn instability economy financial markets Suitable for digital platforms. Illustrating decrease illustrations Falling red arrow on a financial graph illustrating economic downturn , instability, economy, financial markets. Falling red arrow on a financial graph illustrating economic downturn instability economy financial markets Suitable for digital platforms
Free with trial A close-up of a stock market graph displayed on a screen, illustrating a substantial decrease in value, highlighted by a prominent red arrow pointing downwards, indicating a sharp decline in the market. Illustrating decrease illustrations Stock market graph showing a significant downward trend with a large red arrow indicating decline. A close-up of a stock market graph displayed on a screen, illustrating a substantial decrease in value, highlighted by a prominent red arrow pointing downwards, indicating a sharp decline in the market
Free with trial A striking image of a large red arrow pointing sharply downwards against a dark backdrop Ideal for illustrating concepts of decline decrease or negative trends in business finance or economics The dramatic lighting emphasizes the arrow's downward direction. Illustrating decrease illustrations Dramatic Red Arrow Pointing Downward on Dark Background Decline Decrease Fall Concept AI generated. A striking image of a large red arrow pointing sharply downwards against a dark backdrop Ideal for illustrating concepts of decline decrease or negative trends in business finance or economics The dramatic lighting emphasizes the arrow's downward direction
Free with trial A striking image of a single red 3D arrow pointing downwards set against a dark minimalist background Perfect for illustrating concepts of decline decrease or negative trends in business and finance The clean design is ideal for presentations and websites. Illustrating decrease illustrations Red 3D Arrow Pointing Down on Dark Background Minimalist Decline Decrease Drop Concept AI generated. A striking image of a single red 3D arrow pointing downwards set against a dark minimalist background Perfect for illustrating concepts of decline decrease or negative trends in business and finance The clean design is ideal for presentations and websites
Free with trial A close-up view of a financial candlestick chart displaying an overall upward trend. The chart features numerous blue and white candlesticks, which represent price movements over specific periods. Blue candlesticks typically indicate a price increase, while white ones suggest a decrease. Overlaying the candlesticks are two smooth lines, one green and one light blue, which are likely moving. Illustrating decrease illustrations Uptrending candlestick chart illustrating financial market growth and stock trading analysis isolated on white background. A close-up view of a financial candlestick chart displaying an overall upward trend. The chart features numerous blue and white candlesticks, which represent price movements over specific periods. Blue candlesticks typically indicate a price increase, while white ones suggest a decrease. Overlaying the candlesticks are two smooth lines, one green and one light blue, which are likely moving
Free with trial This image features a conceptual bar graph, illustrating contrasting trends of growth and decline in business performance, ideal for data analysis presentations. Illustrating decrease illustrations Growth and Decline: Conceptual Bar Graph Illustrating Positive and Negative Trends in Business Performance Data Visualization. This image features a conceptual bar graph, illustrating contrasting trends of growth and decline in business performance, ideal for data analysis presentations
Free with trial A pencil sketch illustrating the long term effects of overfishing on marine fish biodiversity. Generative AI. Illustrating decrease illustrations A pencil sketch illustrating the long term effects of overfishing on marine fish biodiversity
Free with trial Dynamic chart displaying a downward trend with red lines, illustrating financial decline or market volatility, Generative AI. Illustrating decrease illustrations Dynamic chart displaying a downward trend with red lines, illustrating financial decline or market volatility
Free with trial A series of white circles of varying sizes and brightness arranged in a straight line against a black background. The circles decrease in size and brightness from left to right, creating a gradient effect. This visual representation mimics celestial bodies like planets or stars, illustrating a transition in scale and luminosity. ai generative. Illustrating decrease illustrations Celestial Bodies in a Gradual Scale of Brightness and Size. A series of white circles of varying sizes and brightness arranged in a straight line against a black background. The circles decrease in size and brightness from left to right, creating a gradient effect. This visual representation mimics celestial bodies like planets or stars, illustrating a transition in scale and luminosity. ai generative
Free with trial Financial chart illustrating stock price trends with candlestick patterns. Vertical and horizontal axes display price and time, respectively. A prominent green upward arrow indicates profit, while a red 'Put tag suggests a potential decrease. Blue and red candlestick bars detail price movements. Curved lines highlight trend directions. Labels like Profit add contextual information. The overall theme suggests a focus on cryptocurrency or stock market analysis. Illustrating decrease illustrations Option Trading Chart AI generated. Financial chart illustrating stock price trends with candlestick patterns. Vertical and horizontal axes display price and time, respectively. A prominent green upward arrow indicates profit, while a red 'Put tag suggests a potential decrease. Blue and red candlestick bars detail price movements. Curved lines highlight trend directions. Labels like Profit add contextual information. The overall theme suggests a focus on cryptocurrency or stock market analysis.
Free with trial Candlestick chart showing a series of red and green bars representing price fluctuations over time. Each rectangular bar displays financial data, with green indicating an increase and red indicating a decrease. Thin vertical lines extend above and below the bars, illustrating price range. Numerical values such as 20. 800 and 213. 500 label specific points on the chart, judging stock or currency performance. Horizontal lines suggest moving averages, highlighting trends in the data. Illustrating decrease illustrations Candlestick chart showing a series of red and green bars representing price
Free with trial The image shows a neon-style graph illustrating a business downturn. the graph features an orange line depicting a downward trend, punctuated by blue vertical lines that may represent key milestones or events. the background is dark, emphasizing the neon glow of the graph elements. the graph suggests a decline in business performance, with the orange line representing a decrease in value or profit over time. Illustrating decrease illustrations Business downturn neon chart illustration. the image shows a neon-style graph illustrating a business downturn. the graph features an orange line depicting a downward trend, punctuated by blue vertical lines that may represent key milestones or events. the background is dark, emphasizing the neon glow of the graph elements. the graph suggests a decline in business performance, with the orange line representing a decrease in value or profit over time.
Free with trial Red 3D bar chart with descending trend line and arrow, set against a dark gradient background. The tallest bar on the left progressively declines toward the right, illustrating a decrease. The entire structure has a glossy finish, emphasizing the downward movement indicated by the arrowhead at the end of the line. The chart appears suspended centrally, providing a clear visual representation of a downward trend, often used in financial or analytical contexts to denote loss or decline. Illustrating decrease illustrations Red 3D bar chart with descending trend line and arrow, set against a dark gradient
Free with trial A red arrow with a zigzag line falls downward illustrating decrease or loss on a light blue background to represent financial or economic decline. Illustrating decrease illustrations Red Arrow Falling Zigzag Chart. A red arrow with a zigzag line falls downward illustrating decrease or loss on a light blue background to represent financial or economic decline
Free with trial This image showcases a collection of twenty distinct vector icons, each illustrating various representations of increase and decrease graphs. Illustrating decrease vectors Collection of Twenty Vector Icons Depicting Increase and Decrease Graphs. This image showcases a collection of twenty distinct vector icons, each illustrating various representations of increase and decrease graphs.
Free with trial A person's open palm supports a glowing blue graph illustrating a downward trend for cost and an upward trend for quality against a dark background. Illustrating decrease illustrations Hand holding graph showing decreasing cost and increasing quality decrease. A person's open palm supports a glowing blue graph illustrating a downward trend for cost and an upward trend for quality against a dark background
Free with trial A vector icon of a line graph showing a downward trend with a red arrow. Represents decline, loss, negative performance, or decreasing statistics. Useful for financial reports, business analytics, or illustrating unfavorable trends. Clear visual for decrease, vector design Generative AI. Illustrating decrease vectors Downward Trend Line Graph Vector Icon for Decline Loss, vector design Generative AI. A vector icon of a line graph showing a downward trend with a red arrow. Represents decline, loss, negative performance, or decreasing statistics. Useful for financial reports, business analytics, or illustrating unfavorable trends. Clear visual for decrease, vector design Generative AI
Free with trial A vector icon illustrating a downward trending line graph, symbolizing a decline, decrease, or negative performance. Ideal for financial reports, data analysis dashboards, or warning indicators. This clear and concise graphic is scalable, perfect for conveying trend information in various digital interfaces, vector design Generative AI. Illustrating decrease vectors Declining Trend Graph Icon - Downturn Analysis Symbol, vector design Generative AI. A vector icon illustrating a downward trending line graph, symbolizing a decline, decrease, or negative performance. Ideal for financial reports, data analysis dashboards, or warning indicators. This clear and concise graphic is scalable, perfect for conveying trend information in various digital interfaces, vector design Generative AI
Free with trial Five oil barrels of varying sizes are arranged in a declining order. A bold orange arrow points downward, symbolizing a decrease in oil prices, illustrating market dynamics. Illustrating decrease illustrations Art collage, Oil barrel sizes decrease, reflecting energy market trends and price fluctuations. Five oil barrels of varying sizes are arranged in a declining order. A bold orange arrow points downward, symbolizing a decrease in oil prices, illustrating market dynamics
Free with trial A person's open palm supports a glowing digital graph illustrating a decrease in cost and an increase in quality, set against a dark background. Illustrating decrease illustrations Hand holding glowing graph showing cost decreasing and quality increasing palm open. A person's open palm supports a glowing digital graph illustrating a decrease in cost and an increase in quality, set against a dark background
Free with trial Falling red arrow illustrating financial downturn on dark grid drop business decline fall Suitable for digital platforms. Illustrating decrease illustrations Falling red arrow illustrating financial downturn on dark grid , drop, business decline, fall. Falling red arrow illustrating financial downturn on dark grid drop business decline fall Suitable for digital platforms
Free with trial Artistic depiction of a fuel pump nozzle alongside stock market graph illustrating price trends, Generated by AI. Illustrating decrease illustrations Artistic depiction of a fuel pump nozzle alongside stock market graph illustrating price trends
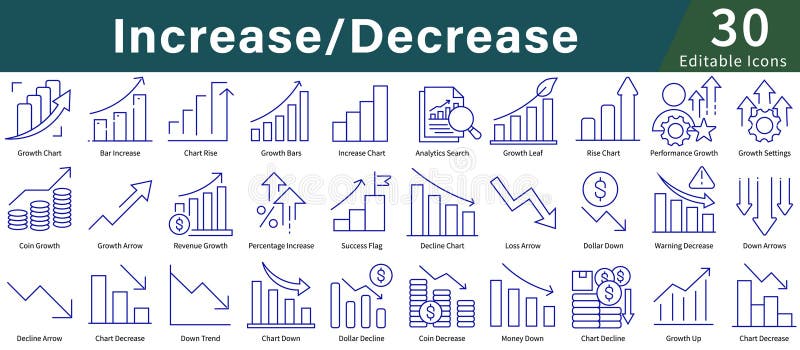
Free with trial Icons illustrating concepts of "Increase Decrease," using simple blue line art. Features include graphs and charts with upward and downward arrows, coins, dollar symbols, and percentage signs. Icons depict growth, decline, analytics, and performance tracking. Suitable for business, finance, or data analysis themes, these icons provide a visual representation of financial trends and statistics, making abstract concepts clear and easily understandable. The design is minimalistic and user-friendly, aimed at enhancing clarity in presentations and reports. Illustrating decrease vectors Increase Decrease Icon Set in Line Style with Editable Vector for Growth, Analytics, Charts, and Data Visualization. Icons illustrating concepts of "Increase Decrease," using simple blue line art. Features include graphs and charts with upward and downward arrows, coins, dollar symbols, and percentage signs. Icons depict growth, decline, analytics, and performance tracking. Suitable for business, finance, or data analysis themes, these icons provide a visual representation of financial trends and statistics, making abstract concepts clear and easily understandable. The design is minimalistic and user-friendly, aimed at enhancing clarity in presentations and reports.
Free with trial Illustrating a financial downturn with descending blocks. The image conveys a sense of economic decline, investment risk, and potential market instability. A visual representation of financial loss. Illustrating decrease illustrations Stock market decline concept showing decrease in value and investment risk with downward trend diagram. Illustrating a financial downturn with descending blocks. The image conveys a sense of economic decline, investment risk, and potential market instability. A visual representation of financial loss.
Free with trial An interest rate percentage sign with a downward trend arrow in the sky. illustrating the effects on the economy, Generated AI. Illustrating decrease illustrations An interest rate percentage sign with a downward trend arrow in the sky, illustrating the effects on the economy, Generated AI
Free with trial A set of line art icons illustrating financial growth, investment strategies, and market analysis, perfect for business presentations and reports with clean design. Illustrating decrease vectors Vector art of line art icons depicting financial growth, investment strategies, and market analysis, ideal for illustrating. A set of line art icons illustrating financial growth, investment strategies, and market analysis, perfect for business presentations and reports with clean design
Free with trial This image presents a detailed timeline infographic illustrating the archaeological dig restoration process spanning from 2004 to 2005, divided into six distinct color-coded sections that visually represent different procedural steps using blue, green, yellow, and orange hues to track the steady increase and subsequent decrease in dig records over time, featuring a bold white title reading. Illustrating decrease illustrations Archaeological dig restoration process timeline infographic showing progress from 2004 to 2005 with color-coded sections and. This image presents a detailed timeline infographic illustrating the archaeological dig restoration process spanning from 2004 to 2005, divided into six distinct color-coded sections that visually represent different procedural steps using blue, green, yellow, and orange hues to track the steady increase and subsequent decrease in dig records over time, featuring a bold white title reading
Free with trial 3D Red arrow pointing down, illustrating financial loss and recession. Gold coins arranged in decreasing stacks, symbolizing money decrease. Vector illustration. Illustrating decrease vectors 3D Red arrow and coins pointing down. 3D Red arrow pointing down, illustrating financial loss and recession. Gold coins arranged in decreasing stacks, symbolizing money decrease. Vector illustration
Free with trial A minimalist, black and white graphic representing a downward trend. A thick, bold arrow points diagonally down and to the right, symbolizing a decline. Below it, a jagged, irregular line graph mirrors this downward trajectory, depicting volatility and a general decrease. This imagery is ideal for illustrating financial losses, market downturns, negative performance, or any concept of falling or decreasing values. Illustrating decrease vectors Down Trend Arrow and Jagged Line Graph. A minimalist, black and white graphic representing a downward trend. A thick, bold arrow points diagonally down and to the right, symbolizing a decline. Below it, a jagged, irregular line graph mirrors this downward trajectory, depicting volatility and a general decrease. This imagery is ideal for illustrating financial losses, market downturns, negative performance, or any concept of falling or decreasing values.
Free with trial Gear mechanism with people icons falling beneath a large down arrow, illustrating decrease in metrics, performance decline, workflow reduction and lowered efficiency in business or system settings. Illustrating decrease vectors Gear mechanism indicating reducing downward process. Gear mechanism with people icons falling beneath a large down arrow, illustrating decrease in metrics, performance decline, workflow reduction and lowered efficiency in business or system settings
Free with trial Magnifying glass highlighting a minus symbol, illustrating the concept of zooming out, reducing size, or decreasing a value within interfaces and digital applications. Illustrating decrease illustrations Magnifying glass showing zoom out or decrease concept. Magnifying glass highlighting a minus symbol, illustrating the concept of zooming out, reducing size, or decreasing a value within interfaces and digital applications
Free with trial Bar chart with descending bars and dashed arrow illustrating decline in value or trend analysis. Ideal for business, finance, economy, performance, forecasting, data, and growth planning. Simple flat. Illustrating decrease illustrations Declining Bar Chart with Dashed Arrow Representing Decrease and Trend Analysis. Bar chart with descending bars and dashed arrow illustrating decline in value or trend analysis. Ideal for business, finance, economy, performance, forecasting, data, and growth planning. Simple flat
Free with trial Gear mechanism showing a large downward arrow surrounded by smaller blue figures, illustrating a concept of decline, decrease, or negative trend within a system or process. Illustrating decrease vectors Economic downfall concept with downward arrow in gear. Gear mechanism showing a large downward arrow surrounded by smaller blue figures, illustrating a concept of decline, decrease, or negative trend within a system or process
Free with trial A financial chart illustrating a significant downward trend. The chart features two lines, one black and one bold red, both indicating a decline over time. The red line emphasizes the sharp decrease, culminating in a prominent arrow pointing downwards. The background is a simple grid, providing a clear visual representation of the data's movement. This image is suitable for illustrating concepts like market crash, economic recession, or business failure. Illustrating decrease vectors Downward Trend Chart. A financial chart illustrating a significant downward trend. The chart features two lines, one black and one bold red, both indicating a decline over time. The red line emphasizes the sharp decrease, culminating in a prominent arrow pointing downwards. The background is a simple grid, providing a clear visual representation of the data's movement. This image is suitable for illustrating concepts like market crash, economic recession, or business failure.
Free with trial Blue downward arrows illustrating a decrease in value beside coin stacks and Bitcoin, symbolizing financial uncertainty. Ideal for finance, cryptocurrency, investment risk, market trends, economy. Illustrating decrease vectors Declining Cryptocurrency Value Represented by Falling Arrows and Bitcoin Stacks. Blue downward arrows illustrating a decrease in value beside coin stacks and Bitcoin, symbolizing financial uncertainty. Ideal for finance, cryptocurrency, investment risk, market trends, economy
Free with trial Two black arrows pointing in opposite directions form a square symbol, illustrating concepts of exchange, process, and balance in communication or business contexts. Illustrating decrease vectors Two black arrows pointing in opposite directions form a square symbol, illustrating concepts of exchange, process, and
Free with trial 3D render illustrating exchange rate fluctuations. A red arrow points downwards, representing a decrease in value, while a green arrow points upwards, indicating an increase. Currency symbols for the Euro, US Dollar, and British Pound are scattered around the arrows, emphasizing the concept of currency exchange rates. The image is set against a clean white background, making it suitable for financial news, economic reports, or educational materials. Illustrating decrease vectors Exchange Rate Fluctuations
Free with trial A bar graph with a downward trend highlighted in neon colors, illustrating a decrease in values over time. Illustrating decrease illustrations Graph showing a downward trend over time. A bar graph with a downward trend highlighted in neon colors, illustrating a decrease in values over time
Free with trial Flat graphic showing a dollar coin with arrows illustrating market fluctuation and volatility, styled as flat cartoon icon. Illustrating decrease vectors Investment Fluctuation Illustration Showing Increase and Decrease of Capital. Flat graphic showing a dollar coin with arrows illustrating market fluctuation and volatility, styled as flat cartoon icon.
Free with trial A 3D rendered bar chart illustrating a significant downward trend. Three blue, rounded bars are displayed on a clean white background with subtle grid lines. A prominent, bold red arrow sharply descends across the bars, clearly indicating a decline, decrease, or negative progression. This graphic is ideal for representing financial losses, market downturns, business challenges, economic recession, or any statistical data showing a negative trend. It conveys concepts of risk, failure, and reduction in a clear, impactful visual manner for presentations, reports, and analytical content. Illustrating decrease vectors Downward Trend Bar Chart with Red Arrow. A 3D rendered bar chart illustrating a significant downward trend. Three blue, rounded bars are displayed on a clean white background with subtle grid lines. A prominent, bold red arrow sharply descends across the bars, clearly indicating a decline, decrease, or negative progression. This graphic is ideal for representing financial losses, market downturns, business challenges, economic recession, or any statistical data showing a negative trend. It conveys concepts of risk, failure, and reduction in a clear, impactful visual manner for presentations, reports, and analytical content.
Free with trial A bold, three-dimensional red percentage symbol (%) is depicted against a clean white background. The symbol is stylized with a downward-pointing arrow integrated into its design, suggesting a decrease or reduction. This graphic is ideal for illustrating concepts related to discounts, sales, negative growth, financial losses, or declining trends in various business and economic contexts. Illustrating decrease vectors Red Percentage Symbol with Downward Arrow. A bold, three-dimensional red percentage symbol (%) is depicted against a clean white background. The symbol is stylized with a downward-pointing arrow integrated into its design, suggesting a decrease or reduction. This graphic is ideal for illustrating concepts related to discounts, sales, negative growth, financial losses, or declining trends in various business and economic contexts.
Free with trial This image presents a visual representation of fluctuating percentages a common motif in discussions about market trends economic shifts and financial performance. The composition features a series of upward and downward pointing arrows paired with percentage symbols conveying the dynamic nature of change and volatility. The red and black colors create a clear distinction between positive and. Illustrating decrease vectors Fluctuating Percentages Illustrating Market Trends and Economic Shifts in Detail. This image presents a visual representation of fluctuating percentages a common motif in discussions about market trends economic shifts and financial performance. The composition features a series of upward and downward pointing arrows paired with percentage symbols conveying the dynamic nature of change and volatility. The red and black colors create a clear distinction between positive and
Free with trial A detailed red candlestick chart illustrating a consistent downward trend over time. Illustrating decrease illustrations Red candlestick chart showing downward trend. A detailed red candlestick chart illustrating a consistent downward trend over time
Free with trial Flat graphic of a dollar coin with a red downward arrow illustrating falling prices, reduced value, financial loss and market decline, ideal for business, finance, economy and investment concepts. Illustrating decrease vectors Dollar Coin With Red Down Arrow Symbolizing Falling Price, Decrease In Value And Financial Loss. Flat graphic of a dollar coin with a red downward arrow illustrating falling prices, reduced value, financial loss and market decline, ideal for business, finance, economy and investment concepts.
Free with trial A simple and effective line graph illustrating the concept of debt reduction. The chart, on a clean white background, shows a green line trending downwards, representing a successful decrease in liabilities over time. A final red arrow emphasizes a significant or accelerated drop, symbolizing a successful financial strategy, cost-cutting, or achieving financial freedom. This vector illustration is perfect for presentations, articles, and infographics on personal or business finance, money management, and economic stability. Illustrating decrease vectors Debt Reduction Concept Graph Showing Downward Trend. A simple and effective line graph illustrating the concept of debt reduction. The chart, on a clean white background, shows a green line trending downwards, representing a successful decrease in liabilities over time. A final red arrow emphasizes a significant or accelerated drop, symbolizing a successful financial strategy, cost-cutting, or achieving financial freedom. This vector illustration is perfect for presentations, articles, and infographics on personal or business finance, money management, and economic stability.