Free with trial A 3D illustration featuring a bar chart with four ascending blue bars of varying heights, representing data growth. To the right of the chart are two white arrows, one pointing upwards and the other downwards, symbolizing increase and decrease respectively. The entire graphic is presented on a clean white background. Increase decrease graph illustrations 3D Bar Chart with Up and Down Arrows on White Background graph statistics. A 3D illustration featuring a bar chart with four ascending blue bars of varying heights, representing data growth. To the right of the chart are two white arrows, one pointing upwards and the other downwards, symbolizing increase and decrease respectively. The entire graphic is presented on a clean white background
Free with trial A set of money icons featuring up and down arrows with dollar and coin symbols, indicating financial movements for profit and price reduction. The concept of money flow, economic trends. Increase decrease graph vectors Currency Symbols with Arrows Indicating Increase and Decrease. A set of money icons featuring up and down arrows with dollar and coin symbols, indicating financial movements for profit and price reduction. The concept of money flow, economic trends
Free with trial Report line icon. Halftone dotted pattern. Gradient icon with grain shadow. Column graph, pie chart sign. Market analytics symbol. Line report icon. Various designs. Vector. Increase decrease graph vectors Report line icon. Column graph, pie chart sign. Halftone dotted pattern. Vector. Report line icon. Halftone dotted pattern. Gradient icon with grain shadow. Column graph, pie chart sign. Market analytics symbol. Line report icon. Various designs. Vector
Free with trial A person's open palm supports a glowing blue graph illustrating a downward trend for cost and an upward trend for quality against a dark background. Increase decrease graph illustrations Hand holding graph showing decreasing cost and increasing quality decrease. A person's open palm supports a glowing blue graph illustrating a downward trend for cost and an upward trend for quality against a dark background
Free with trial This visually striking graph displays two contrasting trends one line shows a sharp decrease while the other illustrates a significant increase in an engaging orange palette. Increase decrease graph illustrations Dynamic Trends of Change Illustrated Through Contrasting Lines in Orange Hues. This visually striking graph displays two contrasting trends one line shows a sharp decrease while the other illustrates a significant increase in an engaging orange palette
Free with trial A man in a blue suit holds a glowing blue bar graph showing increasing quality and decreasing cost with arrows and text. Increase decrease graph illustrations Businessman holding glowing bar graph showing cost reduction and quality increase. A man in a blue suit holds a glowing blue bar graph showing increasing quality and decreasing cost with arrows and text
Free with trial Concept of growing percentage up. Arrow up and rising graph as concept of interest rate growth, price increase, trader profit, financial success and business goal. Infographic design element. Increase decrease graph vectors Concept of growing percentage up. Arrow up and rising graph as concept of interest rate growth, price increase, trader profit
Free with trial Set line Graph chart infographic Server Data Browser window Financial growth decrease Laptop with browser Cloud technology data transfer and Secure your site HTTPS SSL icon. Vector. Increase decrease graph illustrations Set line Graph chart infographic, Server, Data, Browser window, Financial growth decrease, Laptop with browser, Cloud. Set line Graph chart infographic Server Data Browser window Financial growth decrease Laptop with browser Cloud technology data transfer and Secure your site HTTPS SSL icon. Vector.
Free with trial Set line Financial growth decrease Arrow Pie chart infographic Many ways directional arrow Pyramid infographics and Graph chart diagram icon. Vector. Increase decrease graph illustrations Set line Financial growth decrease, Arrow, Pie chart infographic, Many ways directional arrow, Pyramid infographics, and. Set line Financial growth decrease Arrow Pie chart infographic Many ways directional arrow Pyramid infographics and Graph chart diagram icon. Vector.
Free with trial Graph or block diagram shows the increase or decrease of shares, which means financial loss or gain -. Increase decrease graph illustrations Graph or block diagram shows the increase or decrease of shares, which means financial loss or gain
Free with trial Financial graph with blue and red pointers, Business strategy, Business concept, Price increase, Price decrease. Increase decrease graph vectors Financial graph with blue and red pointers, Business strategy, Business concept
Free with trial Set line Arrow Pie chart infographic Graph chart diagram Wrench and gear Pyramid infographics Financial growth decrease Flag and Factory icon. Vector. Increase decrease graph vectors Set line Arrow, Pie chart infographic, Graph, chart, diagram, Wrench and gear, Pyramid infographics, Financial growth. Set line Arrow Pie chart infographic Graph chart diagram Wrench and gear Pyramid infographics Financial growth decrease Flag and Factory icon. Vector.
Free with trial Set Target Project team base Many ways directional arrow Clock Graph chart diagram Financial growth decrease and Flag icon. Vector. Increase decrease graph illustrations Set Target, Project team base, Many ways directional arrow, Clock, Graph, chart, diagram, Financial growth decrease and. Set Target Project team base Many ways directional arrow Clock Graph chart diagram Financial growth decrease and Flag icon. Vector.
Free with trial Two contrasting icon designs feature an upward-trending line graph. On the left, a black graph on a white background on the right, a white graph on a dark background. Both depict an increasing trend with an angled arrow, representing growth or improvement. The simplicity and bold outline emphasize clarity and immediate understanding. Increase decrease graph vectors Increase Icon. Solid glyph series icon. Two contrasting icon designs feature an upward-trending line graph. On the left, a black graph on a white background on the right, a white graph on a dark background. Both depict an increasing trend with an angled arrow, representing growth or improvement. The simplicity and bold outline emphasize clarity and immediate understanding.
Free with trial 3d economic crisis bar graph chart with red arrow going down bankruptcy financial stock market crash downtrend symbol chart going down sign on green blue mint pastel color background 3D rendering. Increase decrease graph illustrations 3d economic crisis bar graph chart with red arrow going down bankruptcy financial stock market crash downtrend symbol chart going
Free with trial 3D stock chart. Invest trade market. Forex candlestick graph of economy data exchange. Digital business technology. Investment infographic render arrow buttons. Profit rate motion. Vector background. Increase decrease graph vectors 3D stock chart. Invest trade market. Forex candlestick graph of economy data exchange. Business technology. Investment infographic. 3D stock chart. Invest trade market. Forex candlestick graph of economy data exchange. Digital business technology. Investment infographic render arrow buttons. Profit rate motion. Vector background
Free with trial Abstract blue green dotted financial graph chart sparkling background. Vector minimal tech design. Increase decrease graph vectors Abstract dotted financial graph chart sparkling background. Abstract blue green dotted financial graph chart sparkling background. Vector minimal tech design
Free with trial 3D Isometric Flat Vector Illustration of Increase Interest Rates, Percent Up. Increase decrease graph vectors 3D Isometric Flat Vector Illustration of Increase Interest Rates
Free with trial Crisis finance graph down arrow business chart recession economy investment concept on red global inflation 3d background with loss financial stock price growth economic bankruptcy. Increase decrease graph illustrations Crisis finance graph down arrow business chart recession economy investment concept on red global inflation 3d background with
Free with trial Continuous one line art down graph chart icon flat style design isolated vector illustration on white background. Increase decrease graph vectors Continuous one line art down graph chart icon flat style
Free with trial Down graph chart icon in trendy flat style design isolated vector illustration on white background. Increase decrease graph vectors Down graph chart icon in trendy flat style design isolated
Free with trial A clean, minimalist icon representing an analytics graph. It features a series of vertical bars of varying heights, symbolizing data or trends. A line graph with circular data points connects the tops of some of the bars, illustrating growth, progress, or fluctuations over time. This graphic is ideal for representing business intelligence, financial data, research, or any concept related to data analysis and performance. Increase decrease graph vectors Analytics Graph Icon with Data Points. A clean, minimalist icon representing an analytics graph. It features a series of vertical bars of varying heights, symbolizing data or trends. A line graph with circular data points connects the tops of some of the bars, illustrating growth, progress, or fluctuations over time. This graphic is ideal for representing business intelligence, financial data, research, or any concept related to data analysis and performance.
Free with trial Decrease : Decrease represents a reduction in value, profit, or financial performance over a specific period. Increase decrease graph vectors Illustration of Decrease. Decrease : Decrease represents a reduction in value, profit, or financial performance over a specific period.
Free with trial A minimalist, black and white vector illustration depicting a financial graph with a clear downward trend. The graph features a jagged line representing fluctuating data, leading into a bold, thick arrow pointing downwards and to the right. This icon symbolizes decline, loss, recession, or negative performance in various contexts, such as business, economics, or stock markets. Its clean design makes it versatile for presentations, websites, and infographics. Increase decrease graph vectors Downward Trend Graph with Arrow Icon. A minimalist, black and white vector illustration depicting a financial graph with a clear downward trend. The graph features a jagged line representing fluctuating data, leading into a bold, thick arrow pointing downwards and to the right. This icon symbolizes decline, loss, recession, or negative performance in various contexts, such as business, economics, or stock markets. Its clean design makes it versatile for presentations, websites, and infographics.
Free with trial Decrease: Decrease represents a reduction in value, amount, or performance over time. Increase decrease graph illustrations Illustration of Decrease. Decrease: Decrease represents a reduction in value, amount, or performance over time.
Free with trial A gold bar graph with an arrow pointing down at the end. Increase decrease graph illustrations A gold bar graph with an arrow
Free with trial Graph line icon. Continuous line big heart. Column chart sign. Growth diagram symbol. 3d hearts in heart shaped loop. Graph chart single line ribbon. Loop curve pattern. Vector. Increase decrease graph vectors Graph line icon. Column chart sign. Continuous line big heart. Vector. Graph line icon. Continuous line big heart. Column chart sign. Growth diagram symbol. 3d hearts in heart shaped loop. Graph chart single line ribbon. Loop curve pattern. Vector
Free with trial Graph line icon. Continuous line with share plane. Column chart sign. Growth diagram symbol. 3d heart in speech bubble. Graph chart single line ribbon. Loop curve pattern. Vector. Increase decrease graph vectors Graph line icon. Column chart sign. Continuous line with plane. Vector. Graph line icon. Continuous line with share plane. Column chart sign. Growth diagram symbol. 3d heart in speech bubble. Graph chart single line ribbon. Loop curve pattern. Vector
Free with trial Graph line icon. Continuous line with share plane. Column chart sign. Ab test diagram symbol. 3d star in speech bubble. Graph chart single line ribbon. Loop curve pattern. Vector. Increase decrease graph vectors Graph line icon. Column chart sign. Continuous line with plane. Vector. Graph line icon. Continuous line with share plane. Column chart sign. Ab test diagram symbol. 3d star in speech bubble. Graph chart single line ribbon. Loop curve pattern. Vector
Free with trial Business graphic vector set. Chart line, round and candlestick graph trend glassmorphism effect. Transparent glass blur button on gradient arrows. Financial diagram statistics with percentage sign. Increase decrease graph vectors Business graphic vector set, chart line, round and candlestick graph glassmorphism effect, glass blur button on arrow. Business graphic vector set. Chart line, round and candlestick graph trend glassmorphism effect. Transparent glass blur button on gradient arrows. Financial diagram statistics with percentage sign
Free with trial Graph line icon. Halftone dotted pattern. Gradient icon with grain shadow. Column chart sign. Growth diagram symbol. Line graph chart icon. Various designs. Vector. Increase decrease graph vectors Graph line icon. Column chart sign. Halftone dotted pattern. Vector. Graph line icon. Halftone dotted pattern. Gradient icon with grain shadow. Column chart sign. Growth diagram symbol. Line graph chart icon. Various designs. Vector
Free with trial Graph line icon. Halftone dotted pattern. Gradient icon with grain shadow. Column chart sign. Growth diagram symbol. Line graph chart icon. Various designs. Vector. Increase decrease graph vectors Graph line icon. Column chart sign. Halftone dotted pattern. Vector. Graph line icon. Halftone dotted pattern. Gradient icon with grain shadow. Column chart sign. Growth diagram symbol. Line graph chart icon. Various designs. Vector
Free with trial Web report line icon. Neumorphic, Flat shadow, 3d buttons. Column graph sign. Growth diagram symbol. Line web report icon. Social media icons. Vector. Increase decrease graph illustrations Web report line icon. Column graph sign. Neumorphic buttons. Vector. Web report line icon. Neumorphic, Flat shadow, 3d buttons. Column graph sign. Growth diagram symbol. Line web report icon. Social media icons. Vector
Free with trial A versatile set of black and white vector icons depicting financial growth, decline, and market trends. Perfect for business, analytics, and finance presentations. Increase decrease graph vectors Set of increase and decrease financial data icons. A versatile set of black and white vector icons depicting financial growth, decline, and market trends. Perfect for business, analytics, and finance presentations
Free with trial Line graph illustrating data analysis and business statistics, charting financial growth, market changes, and performance metrics for visual information and infographic content. Increase decrease graph illustrations Analyzing data with line graph showing business trends. Line graph illustrating data analysis and business statistics, charting financial growth, market changes, and performance metrics for visual information and infographic content
Free with trial Graph laptop line icon. Neumorphic, Flat shadow, 3d buttons. Column chart sign. Growth diagram symbol. Line graph laptop icon. Social media icons. Vector. Increase decrease graph illustrations Graph laptop line icon. Column chart sign. Neumorphic buttons. Vector. Graph laptop line icon. Neumorphic, Flat shadow, 3d buttons. Column chart sign. Growth diagram symbol. Line graph laptop icon. Social media icons. Vector
Free with trial A diverse set of graphic icons representing financial growth, decline, and market trends with clear up and down arrows, bar charts, and coin stacks. Flat design. Increase decrease graph vectors Collection of colorful increase and decrease icons. A diverse set of graphic icons representing financial growth, decline, and market trends with clear up and down arrows, bar charts, and coin stacks. Flat design
Free with trial Calendar graph line icon. Neumorphic, Flat shadow, 3d buttons. Column chart sign. Growth diagram symbol. Line calendar graph icon. Social media icons. Vector. Increase decrease graph vectors Calendar graph line icon. Column chart sign. Neumorphic buttons. Vector. Calendar graph line icon. Neumorphic, Flat shadow, 3d buttons. Column chart sign. Growth diagram symbol. Line calendar graph icon. Social media icons. Vector
Free with trial Pie chart line icon. Neumorphic, Flat shadow, 3d buttons. Presentation graph sign. Market analytics symbol. Line pie chart icon. Social media icons. Vector. Increase decrease graph vectors Pie chart line icon. Presentation graph sign. Neumorphic buttons. Vector. Pie chart line icon. Neumorphic, Flat shadow, 3d buttons. Presentation graph sign. Market analytics symbol. Line pie chart icon. Social media icons. Vector
Free with trial Web report line icon. Halftone dotted pattern. Gradient icon with grain shadow. Column graph sign. Growth diagram symbol. Line web report icon. Various designs. Vector. Increase decrease graph illustrations Web report line icon. Column graph sign. Halftone dotted pattern. Vector. Web report line icon. Halftone dotted pattern. Gradient icon with grain shadow. Column graph sign. Growth diagram symbol. Line web report icon. Various designs. Vector
Free with trial Pie chart line icon. Neumorphic, Flat shadow, 3d buttons. Presentation graph sign. Market analytics symbol. Line pie chart icon. Social media icons. Vector. Increase decrease graph vectors Pie chart line icon. Presentation graph sign. Neumorphic buttons. Vector. Pie chart line icon. Neumorphic, Flat shadow, 3d buttons. Presentation graph sign. Market analytics symbol. Line pie chart icon. Social media icons. Vector
Free with trial Report document line icon. Neumorphic, Flat shadow, 3d buttons. Column graph sign. Growth diagram, pie chart symbol. Line report document icon. Social media icons. Vector. Increase decrease graph vectors Report document line icon. Column graph sign. Neumorphic buttons. Vector. Report document line icon. Neumorphic, Flat shadow, 3d buttons. Column graph sign. Growth diagram, pie chart symbol. Line report document icon. Social media icons. Vector
Free with trial Statistics line icon. Neumorphic, Flat shadow, 3d buttons. Column chart sign. Growth graph diagram symbol. Line graph chart icon. Social media icons. Vector. Increase decrease graph vectors Statistics line icon. Column graph chart sign. Neumorphic buttons. Vector. Statistics line icon. Neumorphic, Flat shadow, 3d buttons. Column chart sign. Growth graph diagram symbol. Line graph chart icon. Social media icons. Vector
Free with trial Report line icon. Neumorphic, Flat shadow, 3d buttons. Column graph, pie chart sign. Market analytics symbol. Line report icon. Social media icons. Vector. Increase decrease graph vectors Report line icon. Column graph, pie chart sign. Neumorphic buttons. Vector. Report line icon. Neumorphic, Flat shadow, 3d buttons. Column graph, pie chart sign. Market analytics symbol. Line report icon. Social media icons. Vector
Free with trial 3D graph going up and down with red arrows, blue bar chart icon vector, sales chart with 3D arrow down and arrow up, financial analytics symbol, EPS 10. Increase decrease graph vectors 3D graph going up and down with red arrows, blue bar chart icon vector, sales chart symbol. 3D graph going up and down with red arrows, blue bar chart icon vector, sales chart with 3D arrow down and arrow up, financial analytics symbol, EPS 10
Free with trial Growth chart line icon. Halftone dotted pattern. Gradient icon with grain shadow. Column graph sign. Market analytics symbol. Line growth chart icon. Various designs. Vector. Increase decrease graph vectors Growth chart line icon. Column graph sign. Halftone dotted pattern. Vector. Growth chart line icon. Halftone dotted pattern. Gradient icon with grain shadow. Column graph sign. Market analytics symbol. Line growth chart icon. Various designs. Vector
Free with trial Growth chart line icon. Halftone dotted pattern. Gradient icon with grain shadow. Column graph sign. Market analytics symbol. Line growth chart icon. Various designs. Vector. Increase decrease graph illustrations Growth chart line icon. Column graph sign. Halftone dotted pattern. Vector. Growth chart line icon. Halftone dotted pattern. Gradient icon with grain shadow. Column graph sign. Market analytics symbol. Line growth chart icon. Various designs. Vector
Free with trial Analytics graph line icon. Continuous line big heart. Column chart sign. Growth diagram symbol. 3d hearts in heart shaped loop. Analytics graph single line ribbon. Loop curve pattern. Vector. Increase decrease graph vectors Analytics graph line icon. Column chart sign. Continuous line big heart. Vector. Analytics graph line icon. Continuous line big heart. Column chart sign. Growth diagram symbol. 3d hearts in heart shaped loop. Analytics graph single line ribbon. Loop curve pattern. Vector
Free with trial Graph line icon. Continuous line big heart. Column chart sign. Growth diagram symbol. 3d hearts in heart shaped loop. Graph chart single line ribbon. Loop curve pattern. Vector. Increase decrease graph vectors Graph line icon. Column chart sign. Continuous line big heart. Vector. Graph line icon. Continuous line big heart. Column chart sign. Growth diagram symbol. 3d hearts in heart shaped loop. Graph chart single line ribbon. Loop curve pattern. Vector
Free with trial Diagram graph line icon. Halftone dotted pattern. Gradient icon with grain shadow. Column chart sign. Market analytics symbol. Line diagram graph icon. Various designs. Vector. Increase decrease graph vectors Diagram graph line icon. Column chart sign. Halftone dotted pattern. Vector. Diagram graph line icon. Halftone dotted pattern. Gradient icon with grain shadow. Column chart sign. Market analytics symbol. Line diagram graph icon. Various designs. Vector
Free with trial Pie chart line icon. Continuous line with share plane. Presentation graph sign. Market analytics symbol. 3d heart in speech bubble. Pie chart single line ribbon. Loop curve pattern. Vector. Increase decrease graph vectors Pie chart line icon. Presentation graph sign. Continuous line with plane. Vector. Pie chart line icon. Continuous line with share plane. Presentation graph sign. Market analytics symbol. 3d heart in speech bubble. Pie chart single line ribbon. Loop curve pattern. Vector
Free with trial Analytics graph line icon. Continuous line with share plane. Column chart sign. Growth diagram symbol. Hearts rate review in speech bubble. Analytics graph single line ribbon. Vector. Increase decrease graph illustrations Analytics graph line icon. Column chart sign. Continuous line with plane. Vector. Analytics graph line icon. Continuous line with share plane. Column chart sign. Growth diagram symbol. Hearts rate review in speech bubble. Analytics graph single line ribbon. Vector
Free with trial Presentation board line icon. Neumorphic, Flat shadow, 3d buttons. Column graph sign. Growth diagram symbol. Line presentation board icon. Social media icons. Vector. Increase decrease graph vectors Presentation board line icon. Column graph sign. Neumorphic buttons. Vector. Presentation board line icon. Neumorphic, Flat shadow, 3d buttons. Column graph sign. Growth diagram symbol. Line presentation board icon. Social media icons. Vector
Free with trial Candlestick chart line icon. Neumorphic, Flat shadow, 3d buttons. Analytics graph sign. Market analytics symbol. Line candlestick chart icon. Social media icons. Vector. Increase decrease graph vectors Candlestick chart line icon. Analytics graph sign. Neumorphic buttons. Vector. Candlestick chart line icon. Neumorphic, Flat shadow, 3d buttons. Analytics graph sign. Market analytics symbol. Line candlestick chart icon. Social media icons. Vector
Free with trial Analytics graph line icon. Halftone dotted pattern. Gradient icon with grain shadow. Column chart sign. Growth diagram symbol. Line analytics graph icon. Various designs. Vector. Increase decrease graph vectors Analytics graph line icon. Column chart sign. Halftone dotted pattern. Vector. Analytics graph line icon. Halftone dotted pattern. Gradient icon with grain shadow. Column chart sign. Growth diagram symbol. Line analytics graph icon. Various designs. Vector
Free with trial Pie chart line icon. Halftone dotted pattern. Gradient icon with grain shadow. Presentation graph sign. Market analytics symbol. Line pie chart icon. Various designs. Vector. Increase decrease graph vectors Pie chart line icon. Presentation graph sign. Halftone dotted pattern. Vector. Pie chart line icon. Halftone dotted pattern. Gradient icon with grain shadow. Presentation graph sign. Market analytics symbol. Line pie chart icon. Various designs. Vector
Free with trial Report statistics line icon. Continuous line with share plane. Column graph sign. Growth diagram symbol. Five star rate review in speech bubble. Report statistics single line ribbon. Vector. Increase decrease graph illustrations Report statistics line icon. Column graph sign. Continuous line with plane. Vector. Report statistics line icon. Continuous line with share plane. Column graph sign. Growth diagram symbol. Five star rate review in speech bubble. Report statistics single line ribbon. Vector
Free with trial Report line icon. Halftone dotted pattern. Gradient icon with grain shadow. Column graph, pie chart sign. Market analytics symbol. Line report icon. Various designs. Vector. Increase decrease graph vectors Report line icon. Column graph, pie chart sign. Halftone dotted pattern. Vector. Report line icon. Halftone dotted pattern. Gradient icon with grain shadow. Column graph, pie chart sign. Market analytics symbol. Line report icon. Various designs. Vector
Free with trial Decreasing graph line icon. Halftone dotted pattern. Gradient icon with grain shadow. Column chart sign. Market analytics symbol. Line decreasing graph icon. Various designs. Vector. Increase decrease graph vectors Decreasing graph line icon. Column chart sign. Halftone dotted pattern. Vector. Decreasing graph line icon. Halftone dotted pattern. Gradient icon with grain shadow. Column chart sign. Market analytics symbol. Line decreasing graph icon. Various designs. Vector
Free with trial Flat style illustration showcasing business financial data analysis via a magnifying glass and graph chart visualization, isolated on black. Increase decrease graph vectors Analyzing Financial Data with Magnifying Glass and Graph Chart. Flat style illustration showcasing business financial data analysis via a magnifying glass and graph chart visualization, isolated on black.
Free with trial A 3D rendering of a red downward arrow and a green upward arrow, symbolizing opposing trends or directions. The arrows are shiny and reflective, set against a clean white background. This image can be used to represent concepts like increase and decrease, growth and decline, or positive and negative trends. Increase decrease graph vectors Red Down Arrow and Green Up Arrow. A 3D rendering of a red downward arrow and a green upward arrow, symbolizing opposing trends or directions. The arrows are shiny and reflective, set against a clean white background. This image can be used to represent concepts like increase and decrease, growth and decline, or positive and negative trends.
Free with trial Presentation board line icon. Halftone dotted pattern. Gradient icon with grain shadow. Column graph sign. Growth diagram symbol. Line presentation board icon. Various designs. Vector. Increase decrease graph vectors Presentation board line icon. Column graph sign. Halftone dotted pattern. Vector. Presentation board line icon. Halftone dotted pattern. Gradient icon with grain shadow. Column graph sign. Growth diagram symbol. Line presentation board icon. Various designs. Vector
Free with trial Pie chart line icon. Halftone dotted pattern. Gradient icon with grain shadow. Presentation 3d graph sign. Market analytics symbol. Line pie chart icon. Various designs. Vector. Increase decrease graph vectors Pie chart line icon. Presentation 3d graph sign. Halftone dotted pattern. Vector. Pie chart line icon. Halftone dotted pattern. Gradient icon with grain shadow. Presentation 3d graph sign. Market analytics symbol. Line pie chart icon. Various designs. Vector
Free with trial Up and down arrows, bar graph, and fingerprint emphasize data analysis, growth, security, identity, biometrics, trends and technology. Ideal for business analytics privacy security technology. Increase decrease graph illustrations Arrows Indicating Trends With Bar Graph and Digital Fingerprint for Data and Security Concepts. Up and down arrows, bar graph, and fingerprint emphasize data analysis, growth, security, identity, biometrics, trends and technology. Ideal for business analytics privacy security technology
Free with trial Intersecting colorful lines trending up and down across a graph illustrate weekly progress from monday to sunday, capturing fluctuations in performance over time. Increase decrease graph vectors Intersecting colorful lines trending up and down across a graph illustrate weekly progress from monday to sunday
Free with trial A simple and clean line art icon of a graph, isolated on a white background. This vector illustration features a line chart with axes, showing a fluctuating trend with distinct data points. The minimalist design makes it perfect for various applications related to business, finance, and data analysis. Ideal for use in presentations, infographics, websites, mobile apps, and user interfaces to represent concepts like statistics, growth, market trends, performance reports, and financial analytics. A versatile symbol for progress and data visualization. Increase decrease graph illustrations Analytics Line Graph Vector Icon. A simple and clean line art icon of a graph, isolated on a white background. This vector illustration features a line chart with axes, showing a fluctuating trend with distinct data points. The minimalist design makes it perfect for various applications related to business, finance, and data analysis. Ideal for use in presentations, infographics, websites, mobile apps, and user interfaces to represent concepts like statistics, growth, market trends, performance reports, and financial analytics. A versatile symbol for progress and data visualization.
Free with trial Four colorful bar charts are displayed on a graph, representing trends, statistics, and timeline data, with a potential focus on business infographics elements. Increase decrease graph vectors Four colorful bar charts are displayed on a graph, representing trends, statistics, and timeline data, with a potential
Free with trial Set line Mind map infographic, Financial growth decrease and icon. Vector. Increase decrease graph illustrations Set line Mind map infographic, Financial growth decrease and icon. Vector
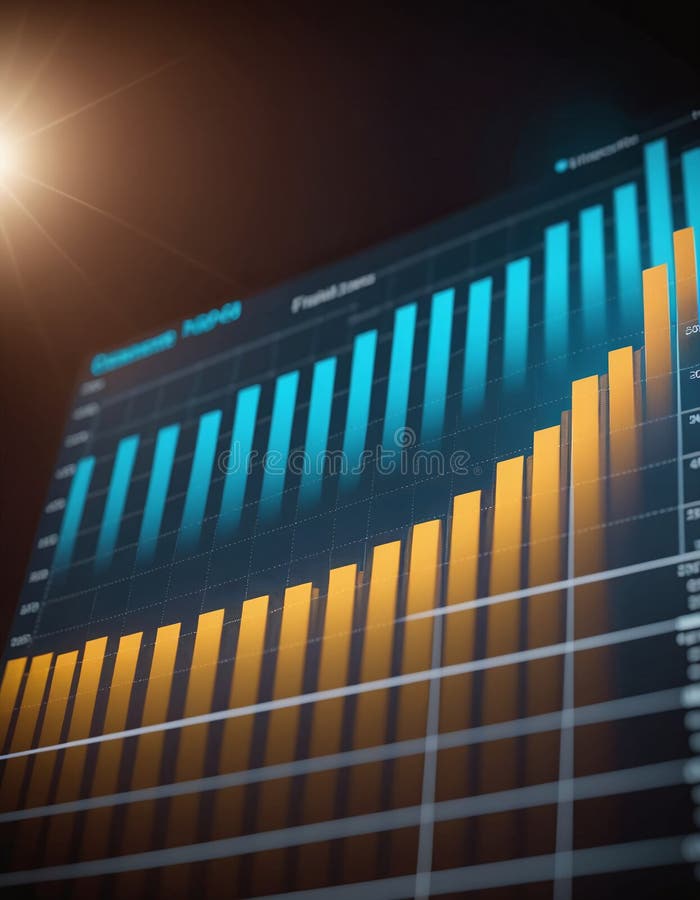
Free with trial Abstract illustration of a financial graph with glowing lines on a dark background. The graph shows two distinct curves, one starting in cool blue tones and transitioning to warm orange hues, suggesting a shift in market trends or performance. The image conveys concepts of data analysis, growth, decline, and financial forecasting. Suitable for illustrating business reports, presentations, or articles related to finance, investment, and economics. Increase decrease graph illustrations Abstract Financial Graph Illustration. Abstract illustration of a financial graph with glowing lines on a dark background. The graph shows two distinct curves, one starting in cool blue tones and transitioning to warm orange hues, suggesting a shift in market trends or performance. The image conveys concepts of data analysis, growth, decline, and financial forecasting. Suitable for illustrating business reports, presentations, or articles related to finance, investment, and economics.
Free with trial Green graph with arrows and dollar sign on white background transparent background. Green graph with arrows and dollar sign on white background. Increase decrease graph illustrations Green graph with arrows and dollar sign on white background transparent background. Green graph with arrows and dollar sign on white background
Free with trial Six simple line graphs showcase various data trends, including upward, downward, and fluctuating patterns. Each graph features key data points marked with letters. Increase decrease graph illustrations Six Line Graph Charts Data Visualization, Trends, Growth, Analysis. Six simple line graphs showcase various data trends, including upward, downward, and fluctuating patterns. Each graph features key data points marked with letters
Free with trial A vibrant pink 3D bar chart illustrates financial data with a prominent downward-trending arrow superimposed. The bars decrease in height from left to right, signifying a decline. An upward-pointing arrow is positioned at the top left, indicating a contrasting upward trend. The graphic is isolated on a white background, making it suitable for presentations on financial performance, market trends,. Increase decrease graph illustrations 3D Pink Bar Chart with Downward Trend Arrow and Upward Trend Arrow graph statistics. A vibrant pink 3D bar chart illustrates financial data with a prominent downward-trending arrow superimposed. The bars decrease in height from left to right, signifying a decline. An upward-pointing arrow is positioned at the top left, indicating a contrasting upward trend. The graphic is isolated on a white background, making it suitable for presentations on financial performance, market trends,
Free with trial A simple and clean line graph icon illustration, perfect for illustrating financial data, growth charts, and statistical analysis. Ideal for use in presentations, reports, and websites. Increase decrease graph vectors Minimalist Line Graph Icon Design for Financial Data Analysis Presentation. A simple and clean line graph icon illustration, perfect for illustrating financial data, growth charts, and statistical analysis. Ideal for use in presentations, reports, and websites.
Free with trial Building wooden bar graph with hand, representing growth and progress -. Increase decrease graph illustrations Building wooden bar graph with hand, representing growth and progress
Free with trial Abstract dotted financial graph chart sparkling background. Vector minimal tech design. Increase decrease graph vectors Abstract dotted financial graph chart sparkling background
Free with trial Flat graphic showing a dollar coin with arrows illustrating market fluctuation and volatility, styled as flat cartoon icon. Increase decrease graph vectors Investment Fluctuation Illustration Showing Increase and Decrease of Capital. Flat graphic showing a dollar coin with arrows illustrating market fluctuation and volatility, styled as flat cartoon icon.
Free with trial Minimalist style percentage illustration continuous line drawing business graph vector art. Increase decrease graph vectors Minimalist style percentage illustration continuous line drawing business graph
Free with trial Data combining line graph style illustration analysis visualization, ch series, point plot data combining line graph style. Increase decrease graph illustrations Data combining line graph style
Free with trial Set line Financial growth decrease, Data analysis, and Server on black and white. Vector. Increase decrease graph illustrations Set line Financial growth decrease, Data analysis, and Server on black and white. Vector
Free with trial Charts and Diagrams line icons. Social media: share, comment, like icons. Report, Block diagram, 3D Chart and Dot Plot graph linear icons. Trend, Pyramid and Pie chart report symbols. Vector. Increase decrease graph illustrations Charts and Diagrams line icons. Set of 3D Chart, Block diagram and Dot Plot graph icons. Social media icons. Vector. Charts and Diagrams line icons. Social media: share, comment, like icons. Report, Block diagram, 3D Chart and Dot Plot graph linear icons. Trend, Pyramid and Pie chart report symbols. Vector