Free with trial This vector illustration shows a set of black graph icons with rising and falling charts indicated by arrows showing trends in data with clear simple design and sharp edges calm. Generative AI. Increase decrease graph vectors Black graph icons set rising and falling charts with arrows vector illustration simple design. This vector illustration shows a set of black graph icons with rising and falling charts indicated by arrows showing trends in data with clear simple design and sharp edges calm. Generative AI
Free with trial A neon glowing graph with blue bars and pink zigzag arrow showing fluctuating growth on black background. Generative AI. Increase decrease graph illustrations Neon glowing graph with blue bars and pink zigzag arrow showing fluctuating growth on black background
Free with trial Colorful Bar Chart Graph Showing Growth and Performance Over Time with Upward Trend. Increase decrease graph vectors Colorful Bar Chart Graph Showing Growth and Performance Over Time with Upward Trend
Free with trial A minimalist set of hand-drawn icons featuring a dynamic arrow indicating movement or progress and a line graph displaying data trends, perfect for illustrating concepts of growth, analysis, and chang. Increase decrease graph vectors Arrow and graph icons set isolated on transparent background. A minimalist set of hand-drawn icons featuring a dynamic arrow indicating movement or progress and a line graph displaying data trends, perfect for illustrating concepts of growth, analysis, and chang
Free with trial Trading chart showing numbers increase and decrease on different globe areas. Financial market, investment, economy analyzing concept. Increase decrease graph illustrations Trading chart showing numbers increase and decrease on globe areas. Trading chart showing numbers increase and decrease on different globe areas. Financial market, investment, economy analyzing concept
Free with trial Diagram chart line icon. Continuous line with share plane. Analytics graph sign. Market analytics symbol. 3d heart in speech bubble. Analytics chart single line ribbon. Loop curve pattern. Vector. Increase decrease graph vectors Diagram chart line icon. Analytics graph sign. Continuous line with plane. Vector. Diagram chart line icon. Continuous line with share plane. Analytics graph sign. Market analytics symbol. 3d heart in speech bubble. Analytics chart single line ribbon. Loop curve pattern. Vector
Free with trial A black graph showing an upward trend with a curved arrow indicating a reversal on a white background. Increase decrease graph illustrations Upward trending graph with a curved arrow indicating a reversal on white background. A black graph showing an upward trend with a curved arrow indicating a reversal on a white background
Free with trial Green up and red down 3d arrow graph showing rising, descending trend, business result, profit or loss symbol symbol. Business arrow, goals concept. 3d world money symbols. Financial growth. Increase decrease graph illustrations Green up and red down 3d arrow graph showing rising, descending trend, business result, 3d world money symbols. Financial growth. Green up and red down 3d arrow graph showing rising, descending trend, business result, profit or loss symbol symbol. Business arrow, goals concept. 3d world money symbols. Financial growth
Free with trial Green up and red down 3d arrow graph showing rising, descending trend, business result, profit or loss symbol symbol. Business arrow, goals concept. 3d world money symbols. Financial growth. Increase decrease graph illustrations Green up and red down 3d arrow graph showing rising, descending trend, business result, 3d world money symbols. Financial growth. Green up and red down 3d arrow graph showing rising, descending trend, business result, profit or loss symbol symbol. Business arrow, goals concept. 3d world money symbols. Financial growth
Free with trial Green up and red down 3d arrow graph showing rising, descending trend, business result, profit or loss symbol symbol. Business arrow, goals concept. 3d world money symbols. Financial growth. Increase decrease graph illustrations Green up and red down 3d arrow graph showing rising, descending trend, business result, 3d world money symbols. Financial growth. Green up and red down 3d arrow graph showing rising, descending trend, business result, profit or loss symbol symbol. Business arrow, goals concept. 3d world money symbols. Financial growth
Free with trial Green up and red down 3d arrow graph showing rising, descending trend, business result, profit or loss symbol symbol. Business arrow, goals concept. 3d world money symbols. Financial growth. Increase decrease graph illustrations Green up and red down 3d arrow graph showing rising, descending trend, business result, 3d world money symbols. Financial growth. Green up and red down 3d arrow graph showing rising, descending trend, business result, profit or loss symbol symbol. Business arrow, goals concept. 3d world money symbols. Financial growth
Free with trial Green up and red down 3d arrow graph showing rising, descending trend, business result, profit or loss symbol symbol. Business arrow, goals concept. 3d world money symbols. Financial growth. Increase decrease graph illustrations Green up and red down 3d arrow graph showing rising, descending trend, business result, 3d world money symbols. Financial growth. Green up and red down 3d arrow graph showing rising, descending trend, business result, profit or loss symbol symbol. Business arrow, goals concept. 3d world money symbols. Financial growth
Free with trial Green up and red down 3d arrow graph showing rising, descending trend, business result, profit or loss symbol symbol. Business arrow, goals concept. 3d world money symbols. Financial growth. Increase decrease graph illustrations Green up and red down 3d arrow graph showing rising, descending trend, business result, 3d world money symbols. Financial growth. Green up and red down 3d arrow graph showing rising, descending trend, business result, profit or loss symbol symbol. Business arrow, goals concept. 3d world money symbols. Financial growth
Free with trial This image features a minimalist black and white bar graph icon, depicting data analysis. It includes vertical bars of varying heights along horizontal and vertical axes. Increase decrease graph vectors Simple Black and White Bar Graph Icon for Data Visualization. This image features a minimalist black and white bar graph icon, depicting data analysis. It includes vertical bars of varying heights along horizontal and vertical axes.
Free with trial A 3D bar graph made of blue blocks with three red arrows pointing in different directions. The graph shows a mix of increasing and decreasing trends. The blocks are arranged in ascending order of height on the right side, while the left side has a more random arrangement. The red arrows are superimposed over the graph, with one pointing upwards, one to the left and one downwards. The background is. Increase decrease graph illustrations A blue block graph with red arrows. A 3D bar graph made of blue blocks with three red arrows pointing in different directions. The graph shows a mix of. A 3D bar graph made of blue blocks with three red arrows pointing in different directions. The graph shows a mix of increasing and decreasing trends. The blocks are arranged in ascending order of height on the right side, while the left side has a more random arrangement. The red arrows are superimposed over the graph, with one pointing upwards, one to the left and one downwards. The background is
Free with trial Pyramid chart line icon. Halftone dotted pattern. Gradient icon with grain shadow. Analytics graph sign. Market analytics symbol. Line pyramid chart icon. Various designs. Vector. Increase decrease graph vectors Pyramid chart line icon. Analytics graph sign. Halftone dotted pattern. Vector. Pyramid chart line icon. Halftone dotted pattern. Gradient icon with grain shadow. Analytics graph sign. Market analytics symbol. Line pyramid chart icon. Various designs. Vector
Free with trial A simple line graph with an orange shaded area showing inflow and outflow dynamics with labeled axes and curves. Increase decrease graph illustrations Upward and Downward Sloping Curves Illustrating Inflow and Outflow Dynamics graph chart. A simple line graph with an orange shaded area showing inflow and outflow dynamics with labeled axes and curves
Free with trial An abstract and futuristic visualization of a financial trading chart on a dark, cosmic background. The image features a candlestick graph transitioning from a volatile red phase into a clear bullish, upward trend in blue. This dynamic concept represents stock market growth, forex trading, cryptocurrency investment, and financial success. It's an ideal background for topics related to fintech, data analysis, economic recovery, and modern investment strategies, symbolizing progress and profitability in the digital economy. Increase decrease graph illustrations Futuristic Stock Market Trading Graph Background. An abstract and futuristic visualization of a financial trading chart on a dark, cosmic background. The image features a candlestick graph transitioning from a volatile red phase into a clear bullish, upward trend in blue. This dynamic concept represents stock market growth, forex trading, cryptocurrency investment, and financial success. It's an ideal background for topics related to fintech, data analysis, economic recovery, and modern investment strategies, symbolizing progress and profitability in the digital economy.
Free with trial Black icon of a rising line graph with arrow pointing down on white background chart. Increase decrease graph illustrations Black icon of a rising line graph with arrow pointing down on white background chart
Free with trial Simple black bar graph icon with bars of varying heights on a white background Clear details and vibrant color. Increase decrease graph illustrations Simple black bar graph icon showing varying heights on a white background chart data. Simple black bar graph icon with bars of varying heights on a white background Clear details and vibrant color
Free with trial Four icons depict rising and falling percentage values with arrows and curved lines on a white background. Increase decrease graph illustrations Arrows indicating percentage increase and decrease in finance. Four icons depict rising and falling percentage values with arrows and curved lines on a white background
Free with trial Graph line icon. Neumorphic, Flat shadow, 3d buttons. Column chart sign. Growth diagram symbol. Line graph chart icon. Social media icons. Vector. Increase decrease graph vectors Graph line icon. Column chart sign. Neumorphic buttons. Vector. Graph line icon. Neumorphic, Flat shadow, 3d buttons. Column chart sign. Growth diagram symbol. Line graph chart icon. Social media icons. Vector
Free with trial Horizontal chart line icon. Halftone dotted pattern. Gradient icon with grain shadow. Column graph sign. Market analytics symbol. Line horizontal chart icon. Various designs. Vector. Increase decrease graph vectors Horizontal chart line icon. Column graph sign. Halftone dotted pattern. Vector. Horizontal chart line icon. Halftone dotted pattern. Gradient icon with grain shadow. Column graph sign. Market analytics symbol. Line horizontal chart icon. Various designs. Vector
Free with trial Showing helix graph tracking market data in dotted grid display, with bars and arrowed markers. Financial, technology, innovation, data, analytics, digital, futuristic. Increase decrease graph illustrations Showing helix graph tracking market data in dotted grid display, with bars and arrowed markers
Free with trial Business bar graph icon vector with upward and downward arrow. Trend analysis symbol with long shadow. Increase decrease graph vectors Business bar graph icon with upward and downward arrow. Trend analysis symbol with long shadow
Free with trial A vibrant green arrow points upwards indicating progress or increase, while a glossy red arrow points downwards symbolizing decline or decrease, representing directional changes. Increase decrease graph illustrations Green up arrow and red down arrow icons symbolizing directional movement and change white background. A vibrant green arrow points upwards indicating progress or increase, while a glossy red arrow points downwards symbolizing decline or decrease, representing directional changes
Free with trial A black silhouette of a financial graph with bars and jagged lines is shown on white. Increase decrease graph illustrations Black silhouette of a financial graph with bars and jagged lines on white chart business. A black silhouette of a financial graph with bars and jagged lines is shown on white
Free with trial A hand drawn line graph on crumpled graph paper depicts fluctuating market trends. Increase decrease graph illustrations Hand drawn financial graph on crumpled paper with red and blue lines. A hand drawn line graph on crumpled graph paper depicts fluctuating market trends
Free with trial Graph line icon. Halftone dotted pattern. Gradient icon with grain shadow. Column chart sign. Ab test diagram symbol. Line graph chart icon. Various designs. Vector. Increase decrease graph vectors Graph line icon. Column chart sign. Halftone dotted pattern. Vector. Graph line icon. Halftone dotted pattern. Gradient icon with grain shadow. Column chart sign. Ab test diagram symbol. Line graph chart icon. Various designs. Vector
Free with trial Blackboard with graph showing recession isolated on white background. Increase decrease graph illustrations Graph Showing Recession
Free with trial Line graph with a green line and a red dot on top. The red dot is located at the top left corner of the graph. Increase decrease graph illustrations Graph with a green line and a red dot
Free with trial A visual representation of contrasting directions using prominent green and red arrows, symbolizing growth and decline, increase and decrease, essential for data and trend analysis. Increase decrease graph illustrations Green and red arrows facing each other on isolated on white background. A visual representation of contrasting directions using prominent green and red arrows, symbolizing growth and decline, increase and decrease, essential for data and trend analysis
Free with trial An upward trending line graph showcases data points increasing, symbolizing growth and progress. The visual represents success, development, and positive statistics. Increase decrease graph vectors Positive Trend Graph, Data Points Rising Upward. An upward trending line graph showcases data points increasing, symbolizing growth and progress. The visual represents success, development, and positive statistics.
Free with trial Money growth and fall on chart graph with arrow up and down, financial business invest. Vector flat illustration. Increase decrease graph vectors Money growth and fall on chart graph with arrow up and down, financial business invest. Vector illustration
Free with trial Closeup of a hand holding vibrant blue graph, illustrating data trends and analysis ,Generative ai. Increase decrease graph illustrations Hand holding a blue graph, data analysis, trends, and performance insights closeup. Closeup of a hand holding vibrant blue graph, illustrating data trends and analysis ,Generative ai
Free with trial This image showcases a bar graph depicting rising factory production, generated by AI, superimposed on a blurred background of a bustling industrial facility. The upward trend suggests growth and efficiency in the manufacturing process, highlighting the positive impact of modern technology. Increase decrease graph illustrations Factory Production Increase. This image showcases a bar graph depicting rising factory production, generated by AI, superimposed on a blurred background of a bustling industrial facility. The upward trend suggests growth and efficiency in the manufacturing process, highlighting the positive impact of modern technology.
Free with trial A simple black and white illustration of a bar chart and a line graph showing business growth trends, isolated on a white background. Increase decrease graph vectors Business growth bar chart and line graph isolated on white background. A simple black and white illustration of a bar chart and a line graph showing business growth trends, isolated on a white background
Free with trial Colorful line graph illustrating growth and decline over time, with variously colored data points on a dark background, visualizing financial performance and trends. Increase decrease graph vectors Colorful line graph illustrating growth and decline over time, with variously colored data points on a dark background
Free with trial Growth and decline arrow graph icon. Up and down arrows symbol illustration. Increase decrease graph vectors Growth and decline arrow graph icon. Up and down arrows symbol
Free with trial Business bar graph with upward and downward arrow. Trend analysis icon vector. Increase decrease graph vectors Business bar graph with upward and downward arrow. Trend analysis icon
Free with trial Growth vector icon. Graph or diagram with arrow going up and down. Vector illustration. Increase decrease graph vectors Growth vector icon. Graph or diagram with arrow going up and down. Vector
Free with trial This graphic features two distinct 3D arrows. A vibrant green arrow points upward, symbolizing increase, progress, or positive movement. Alongside it, a bold red arrow points downward, indicating a decrease, decline, or negative trend. Increase decrease graph illustrations Green up arrow and red down arrow symbols representing growth and decline finances or data white background. This graphic features two distinct 3D arrows. A vibrant green arrow points upward, symbolizing increase, progress, or positive movement. Alongside it, a bold red arrow points downward, indicating a decrease, decline, or negative trend
Free with trial Bar graph displays a colorful representation of business growth and financial success with bars increasing in height and vibrant colors on a reflective surface indicating positive trends. Increase decrease graph illustrations Colorful bar graph showing growth and success in business and finance on a reflective surface. Bar graph displays a colorful representation of business growth and financial success with bars increasing in height and vibrant colors on a reflective surface indicating positive trends.
Free with trial Business bar graph icon with upward and downward arrow. Trend analysis symbol vector in circular outline. Increase decrease graph vectors Business bar graph icon with upward and downward arrow. Trend analysis symbol in circular outline
Free with trial Simple line graph illustrating data points and trends. Ideal for presentations, reports, and infographics related to business analysis, market research, or financial reporting. Increase decrease graph vectors Simple Line Graph, Data Visualization, Business Chart. Simple line graph illustrating data points and trends. Ideal for presentations, reports, and infographics related to business analysis, market research, or financial reporting.
Free with trial Report line icon. Continuous line with share plane. Column graph, pie chart sign. Market analytics symbol. 3d heart in speech bubble. Report single line ribbon. Loop curve pattern. Vector. Increase decrease graph vectors Report line icon. Column graph, pie chart sign. Continuous line with plane. Vector. Report line icon. Continuous line with share plane. Column graph, pie chart sign. Market analytics symbol. 3d heart in speech bubble. Report single line ribbon. Loop curve pattern. Vector
Free with trial Colorful bar graph with stacked segments illustrating growth and data analysis. Increase decrease graph vectors Colorful bar graph with stacked segments illustrating growth and data analysis
Free with trial Analytics graph line icon. Neumorphic, Flat shadow, 3d buttons. Column chart sign. Growth diagram symbol. Line analytics graph icon. Social media icons. Vector. Increase decrease graph vectors Analytics graph line icon. Column chart sign. Neumorphic buttons. Vector. Analytics graph line icon. Neumorphic, Flat shadow, 3d buttons. Column chart sign. Growth diagram symbol. Line analytics graph icon. Social media icons. Vector
Free with trial A colorful bar graph with a line graph overlayed on a blue background. it shows data trends and market analysis in a simple visual format. Increase decrease graph vectors Colorful bar graph with a line graph on a blue background. a colorful bar graph with a line graph overlayed on a blue background. it shows data trends and market analysis in a simple visual format
Free with trial This image depicts a house with a rising stock market graph overlay on a green lawn, symbolizing growth and prosperity in the real estate and financial markets. The graph shows a mix of green and red lines, indicating fluctuations in the market, but overall trending upwards. The image conveys a sense of optimism and hope for the future. Increase decrease graph illustrations A house with a rising stock market graph overlay on a green lawn
Free with trial Horizontal chart line icon. Neumorphic, Flat shadow, 3d buttons. Column graph sign. Market analytics symbol. Line horizontal chart icon. Social media icons. Vector. Increase decrease graph illustrations Horizontal chart line icon. Column graph sign. Neumorphic buttons. Vector. Horizontal chart line icon. Neumorphic, Flat shadow, 3d buttons. Column graph sign. Market analytics symbol. Line horizontal chart icon. Social media icons. Vector
Free with trial Pyramid chart line icon. Neumorphic, Flat shadow, 3d buttons. Analytics graph sign. Market analytics symbol. Line pyramid chart icon. Social media icons. Vector. Increase decrease graph vectors Pyramid chart line icon. Analytics graph sign. Neumorphic buttons. Vector. Pyramid chart line icon. Neumorphic, Flat shadow, 3d buttons. Analytics graph sign. Market analytics symbol. Line pyramid chart icon. Social media icons. Vector
Free with trial Diagram chart line icon. Neumorphic, Flat shadow, 3d buttons. Column 3d graph sign. Market analytics symbol. Line 3d chart icon. Social media icons. Vector. Increase decrease graph vectors Diagram chart line icon. Column 3d graph sign. Neumorphic buttons. Vector. Diagram chart line icon. Neumorphic, Flat shadow, 3d buttons. Column 3d graph sign. Market analytics symbol. Line 3d chart icon. Social media icons. Vector
Free with trial This image features two minimalist icons representing financial or data trends. The left icon is a white line graph with circular data points and directional arrows, set against a solid black shield shape. The right icon presents the same line graph and data points within a black outline of a shield, on a white background. Both icons depict fluctuating data, with one showing a downward trend and the other an upward trend, symbolizing market volatility, analysis, and security. Increase decrease graph illustrations Line Graph Icon with Shield Symbol - Upward and Downward Trends. This image features two minimalist icons representing financial or data trends. The left icon is a white line graph with circular data points and directional arrows, set against a solid black shield shape. The right icon presents the same line graph and data points within a black outline of a shield, on a white background. Both icons depict fluctuating data, with one showing a downward trend and the other an upward trend, symbolizing market volatility, analysis, and security.
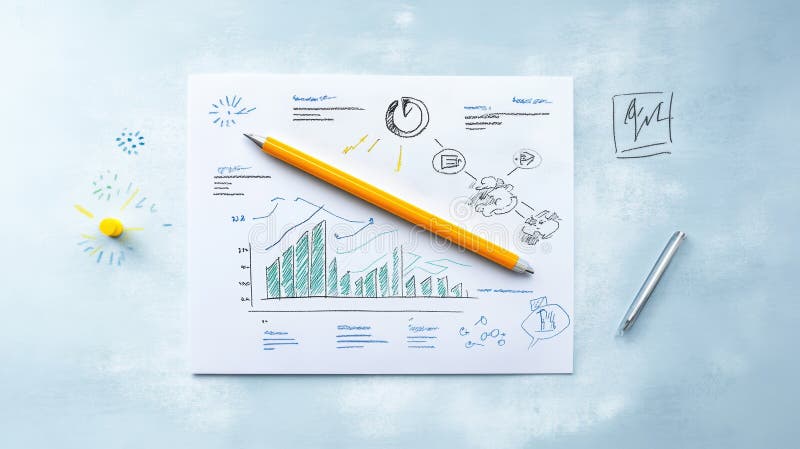
Free with trial Graph depiction on paper with a pencil ,Generative ai. Increase decrease graph illustrations Pencil and paper, a detailed illustration of graph for data analysis visualization. Graph depiction on paper with a pencil ,Generative ai
Free with trial Stacks of gold and silver coins in front of a blurred background with a financial graph and percentages. Increase decrease graph illustrations Stacks of coins and financial graph with percentages in background finance money. Stacks of gold and silver coins in front of a blurred background with a financial graph and percentages
Free with trial Decreasing graph line icon. Continuous line big heart. Column chart sign. Market analytics symbol. 3d hearts in heart shaped loop. Decreasing graph single line ribbon. Loop curve pattern. Vector. Increase decrease graph vectors Decreasing graph line icon. Column chart sign. Continuous line big heart. Vector. Decreasing graph line icon. Continuous line big heart. Column chart sign. Market analytics symbol. 3d hearts in heart shaped loop. Decreasing graph single line ribbon. Loop curve pattern. Vector
Free with trial Pie chart line icon. Neumorphic, Flat shadow, 3d buttons. Presentation 3d graph sign. Market analytics symbol. Line pie chart icon. Social media icons. Vector. Increase decrease graph vectors Pie chart line icon. Presentation 3d graph sign. Neumorphic buttons. Vector. Pie chart line icon. Neumorphic, Flat shadow, 3d buttons. Presentation 3d graph sign. Market analytics symbol. Line pie chart icon. Social media icons. Vector
Free with trial Up and down arrow on bar chart icon set. Growth and decline graph symbol illustration. Financial trend concept. Increase decrease graph vectors Up and down arrow on bar chart icon set. Growth and decline graph symbol. Financial trend concept
Free with trial This graph illustrates the fluctuation of interest rates over the last 12 months, ranging from 3. 5% to 7%. The line chart provides a visual representation of the trend, allowing for easy analysis and understanding of the data. The graph is a valuable resource for businesses, investors, and individuals looking to stay informed about the current state of the economy and make informed decisions about their financial planning and strategy. Increase decrease graph illustrations A graph showing interest rate fluctuation over the last 12 months. This graph illustrates the fluctuation of interest rates over the last 12 months, ranging from 3.5% to 7%. The line chart provides a visual representation of the trend, allowing for easy analysis and understanding of the data. The graph is a valuable resource for businesses, investors, and individuals looking to stay informed about the current state of the economy and make informed decisions about their financial planning and strategy.
Free with trial Calendar graph line icon. Halftone dotted pattern. Gradient icon with grain shadow. Column chart sign. Growth diagram symbol. Line calendar graph icon. Various designs. Vector. Increase decrease graph vectors Calendar graph line icon. Column chart sign. Halftone dotted pattern. Vector. Calendar graph line icon. Halftone dotted pattern. Gradient icon with grain shadow. Column chart sign. Growth diagram symbol. Line calendar graph icon. Various designs. Vector
Free with trial A striking 3D rendering features an abstract bar graph composed of numerous translucent blue rectangular blocks against a dark, almost black, background. The varying heights of the blocks create a dynamic visual representation of data, statistics, or growth trends. This modern and futuristic design is ideal for illustrating concepts related to business, finance, technology, analytics, market research, or digital information in presentations, reports, websites, and corporate media. Increase decrease graph illustrations Abstract 3D Blue Bar Graph Visualization. A striking 3D rendering features an abstract bar graph composed of numerous translucent blue rectangular blocks against a dark, almost black, background. The varying heights of the blocks create a dynamic visual representation of data, statistics, or growth trends. This modern and futuristic design is ideal for illustrating concepts related to business, finance, technology, analytics, market research, or digital information in presentations, reports, websites, and corporate media.
Free with trial Hand crisis business graph red 3d arrow fall financial chart investment market concept on banking crash background of down finance global economy loss stock recession. Increase decrease graph illustrations Hand crisis business graph red 3d arrow fall financial chart investment market concept on banking crash background of down finance
Free with trial Understanding bar graph charts data analysis and visualization for business and financial performance metrics. Increase decrease graph vectors Understanding bar graph charts data analysis and visualization for business
Free with trial A simple bar graph illustrating upward growth and financial success. Ideal for presentations, reports, and website use. Increase decrease graph vectors Upward Trending Bar Graph: Business Growth and Financial Success. A simple bar graph illustrating upward growth and financial success. Ideal for presentations, reports, and website use.
Free with trial A flat, cartoon-style line graph on a white grid background shows a green upward-pointing arrow representing growth and a red downward-pointing arrow indicating decline, with a red dollar sign placed atop the green arrow to symbolize financial gain, illustrating contrasting economic trends in a simplified, visually engaging manner ideal for business, finance, and investment-related content that. Increase decrease graph illustrations Upward and downward financial trend with green and red arrows on grid graph. A flat, cartoon-style line graph on a white grid background shows a green upward-pointing arrow representing growth and a red downward-pointing arrow indicating decline, with a red dollar sign placed atop the green arrow to symbolize financial gain, illustrating contrasting economic trends in a simplified, visually engaging manner ideal for business, finance, and investment-related content that
Free with trial Graph line icon. Neumorphic, Flat shadow, 3d buttons. Column chart sign. Growth diagram symbol. Line graph chart icon. Social media icons. Vector. Increase decrease graph vectors Graph line icon. Column chart sign. Neumorphic buttons. Vector. Graph line icon. Neumorphic, Flat shadow, 3d buttons. Column chart sign. Growth diagram symbol. Line graph chart icon. Social media icons. Vector
Free with trial Financial planning graph shows coins and pen. Increase decrease graph illustrations Financial planning graph shows coins and pen
Free with trial A clean, minimalist 3D render depicts a series of white arrows of varying heights arranged in a graph-like formation. The tallest arrows, on the left, are illuminated with a warm, orange glow, symbolizing growth, success, and positive trends. The arrows decrease in size towards the right, suggesting a progression or trend line. The reflective surface and bright, airy background create a modern and optimistic feel, ideal for business, finance, and technology-related concepts. Increase decrease graph illustrations Rising Arrows Graph. A clean, minimalist 3D render depicts a series of white arrows of varying heights arranged in a graph-like formation. The tallest arrows, on the left, are illuminated with a warm, orange glow, symbolizing growth, success, and positive trends. The arrows decrease in size towards the right, suggesting a progression or trend line. The reflective surface and bright, airy background create a modern and optimistic feel, ideal for business, finance, and technology-related concepts.
Free with trial A close-up shot of a printed financial report showing market fluctuations indicated by a red line graph. Increase decrease graph illustrations A financial document showing a fluctuating red line graph displayed. A close-up shot of a printed financial report showing market fluctuations indicated by a red line graph
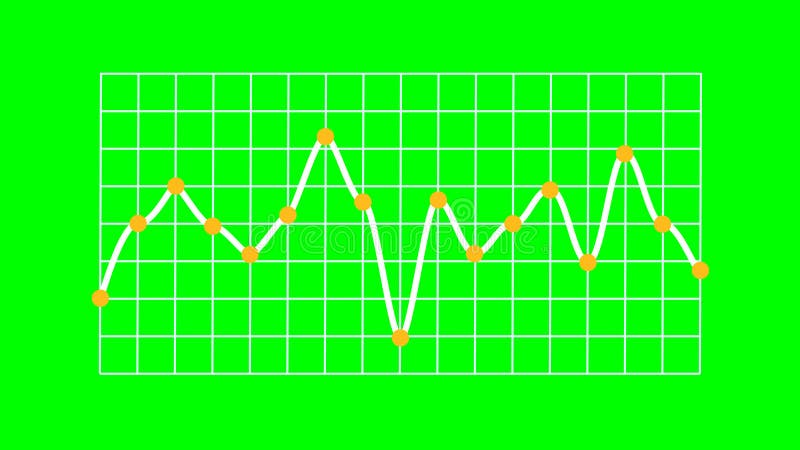
Free with trial Rendered line graph showing a single white line indicating data trends with distinct fluctuations. Yellow marker points animate vertically from the X-axis, and each plotted value features an orange circular dot. The white line runs over a structured white grid on a bright green screen background, enabling chroma keying. No axis values or units are present, emphasizing visual representation of abstract data and business trends. Increase decrease graph illustrations Business Trend Line Graph Showing Trading on Green Screen. Rendered line graph showing a single white line indicating data trends with distinct fluctuations. Yellow marker points animate vertically from the X-axis, and each plotted value features an orange circular dot. The white line runs over a structured white grid on a bright green screen background, enabling chroma keying. No axis values or units are present, emphasizing visual representation of abstract data and business trends.
Free with trial A vibrant bar graph shows an upward trend with a green arrow, indicating growth. The bars are blue, yellow, green, and red, set against a clean white background. Increase decrease graph illustrations Colorful Bar Graph with Upward Trend Line and Green Arrow Indicator on White Background. A vibrant bar graph shows an upward trend with a green arrow, indicating growth. The bars are blue, yellow, green, and red, set against a clean white background
Free with trial Graph line icon. Continuous line with share plane. Column chart sign. Growth diagram symbol. 3d heart in speech bubble. Graph chart single line ribbon. Loop curve pattern. Vector. Increase decrease graph vectors Graph line icon. Column chart sign. Continuous line with plane. Vector. Graph line icon. Continuous line with share plane. Column chart sign. Growth diagram symbol. 3d heart in speech bubble. Graph chart single line ribbon. Loop curve pattern. Vector
Free with trial Percent arrows up and down icon set. Income and cost increase and decrease arrow icons. Increase decrease graph vectors Percent arrows up and down icon set
Free with trial Financial arrows up and down icon on circle. Growth and decline graph sign symbol illustration. Increase decrease graph vectors Financial arrows up and down icon on circle. Growth and decline graph sign symbol
Free with trial A bold line graph icon displays business data with trend analysis, featuring circles marking data points and horizontal lines indicating value levels. Increase decrease graph vectors Bold Line Graph Icon: Business Data Visualization with Trend Analysis. A bold line graph icon displays business data with trend analysis, featuring circles marking data points and horizontal lines indicating value levels
Free with trial Red bar graph with decreasing values. Generative AI. Increase decrease graph illustrations Red bar graph with decreasing values
Free with trial Growth vector icon. Graph or diagram with arrow going up and down. Vector illustration. Increase decrease graph vectors Growth vector icon. Graph or diagram with arrow going up and down. Vector
Free with trial Stacks of coins on laptop with stock market graph. Increase decrease graph illustrations Stacks of coins on laptop with stock market graph
Free with trial Ai-Generated. a collection of twentyone minimalistic graph chart icons these icons illustrate different types of data trends suitable for representing business information, statistical analysis, and financial reports each icon features a unique line graph, bar chart, or diagram style. Increase decrease graph vectors Collection of minimalistic graph chart icons presenting different types of business data trends. Ai-Generated. a collection of twentyone minimalistic graph chart icons these icons illustrate different types of data trends suitable for representing business information, statistical analysis, and financial reports each icon features a unique line graph, bar chart, or diagram style