Free with trial The image displays a grid of twelve different statistical graphs and charts, each representing various data trends and distributions. The graphs include line charts, bar charts, and area charts, each showcasing unique data patterns. Some graphs show fluctuating data points, while others illustrate steady increases or decreases. The bar charts present different frequencies and distributions. Increase decrease graph illustrations Collection of various statistical graphs and charts illustrating data trends and distributions. The image displays a grid of twelve different statistical graphs and charts, each representing various data trends and distributions. The graphs include line charts, bar charts, and area charts, each showcasing unique data patterns. Some graphs show fluctuating data points, while others illustrate steady increases or decreases. The bar charts present different frequencies and distributions.
Free with trial Close-up view of computer screen with colorful graphs, charts, representing financial, economic data visualization. Stock market analysis, business statistics investment data displayed. Increase decrease graph illustrations Close-up view of computer screen with colorful graphs, charts, representing financial, economic data visualization. Stock market
Free with trial Uptrend and downtrend arrow icon with long shadow. Up and down arrows illustration on square. Increase decrease graph vectors Uptrend and downtrend arrow icon with long shadow. Up and down arrows on square
Free with trial A grid of thin line icons illustrating business growth and financial concepts, featuring charts, graphs, money symbols, and people. Increase decrease graph illustrations Business Growth and Financial Analytics Icon Collection with Charts and Money Keywords: business, growth, finance, analytics. A grid of thin line icons illustrating business growth and financial concepts, featuring charts, graphs, money symbols, and people
Free with trial Up and down arrow icon set with long shadow. Upward and downward sign symbol. Increase decrease graph vectors Up and down arrow icon set with long shadow
Free with trial A man is presenting business data on a whiteboard, using a laptop. The chart shows growth and success. He is explaining the strategy and planning to his colleagues. Increase decrease graph illustrations Man presenting business data on a whiteboard isolated on white background. A man is presenting business data on a whiteboard, using a laptop. The chart shows growth and success. He is explaining the strategy and planning to his colleagues
Free with trial Man points red arrow on bar chart for analysis professional highlights data trend with arrow on chart,Generative AI. Increase decrease graph illustrations Man points red arrow on bar chart for analysis professional highlights data trend with arrow on chart
Free with trial 3D coin background with finance chart. Financial investment, currency, successful market growth, technology report concept. Bitcoin or cryptocurrency trading, online banking digital. Increase decrease graph illustrations 3D coin background with finance chart. Financial investment, currency, successful market growth, technology report concept.
Free with trial A dynamic visual representation showcases interest rate volatility, featuring fluctuating lines, percentage symbols, and financial data analysis. The display creates a sense of market flux and economic shifts. Ideal for illustrating financial news, investment strategies, economic forecasts, and mark. Increase decrease graph illustrations Interest Rate Volatility Display Showing Financial Data Trends and Fluctuations for Market Analysis. A dynamic visual representation showcases interest rate volatility, featuring fluctuating lines, percentage symbols, and financial data analysis. The display creates a sense of market flux and economic shifts. Ideal for illustrating financial news, investment strategies, economic forecasts, and mark
Free with trial A 3D golden house model on a digital tablet with colorful graphs and charts in the background,. Increase decrease graph illustrations A 3D golden house model on a digital tablet with colorful graphs and charts in the background
Free with trial Colorful flat design depicts bull and bear market fluctuation. Rising and falling arrows symbolize investment direction with a simple yet informative design. Increase decrease graph vectors Bull and Bear Market Illustration with Price Fluctuation Indicators on Black Background. Colorful flat design depicts bull and bear market fluctuation. Rising and falling arrows symbolize investment direction with a simple yet informative design.
Free with trial This is an detailed set of clean line icons for infographic design, corporate data analysis, and finance. Increase decrease graph vectors Clean infographic symbols for corporate data analysis and financial tracking applications. This is an detailed set of clean line icons for infographic design, corporate data analysis, and finance
Free with trial This is an detailed series of analytical icons for data visualization and statistical reporting in a clean line style. Increase decrease graph vectors Comprehensive analytical data and statistics symbols for corporate business presentations. This is an detailed series of analytical icons for data visualization and statistical reporting in a clean line style
Free with trial Red glossy arrow pointing upwards isolated on white background. Direction guide. Close-up. Increase decrease graph illustrations Red glossy arrow pointing upwards isolated on white background. Direction guide
Free with trial Red glossy arrow pointing upwards isolated on white background. Direction guide. Close-up. Increase decrease graph illustrations Red glossy arrow pointing upwards isolated on white background. Direction guide
Free with trial Red glossy arrow pointing upwards isolated on white background. Direction guide. Close-up. Increase decrease graph illustrations Red glossy arrow pointing upwards isolated on white background. Direction guide
Free with trial A set of nine minimalist vector icons depicting various types of charts and graphs including bar charts, progress bars, and trend lines for data visualization and analytics. Increase decrease graph vectors Collection of simple black glyph icons representing business charts graphs and data analysis. A set of nine minimalist vector icons depicting various types of charts and graphs including bar charts, progress bars, and trend lines for data visualization and analytics
Free with trial Concept of volatile market with one stack of coins growing and another one decreasing. Increase decrease graph illustrations Money stack growing while one is decreasing showing market volatility. Concept of volatile market with one stack of coins growing and another one decreasing
Free with trial Simple up and down arrow icon on black circle. Increase decrease graph vectors Simple up and down arrow on black circle
Free with trial Theory of Production for Total Product, Average Product, Marginal Product vector. Increase decrease graph vectors Theory of Production for Total Product, Average Product, Marginal Product
Free with trial The image presents a comprehensive display of weekly trends through multiple graphs and charts. It features line graphs, bar charts, and other visual representations of data, each highlighting different aspects of trends and statistics. The use of various colors, including green, red, and blue, against a dark background with white text enhances the visual appeal and facilitates easy comprehension. This image was generated using artificial intelligence. Increase decrease graph illustrations A collection of graphs and charts showcasing various weekly trends and statistics in a visually engaging format with multiple. The image presents a comprehensive display of weekly trends through multiple graphs and charts. It features line graphs, bar charts, and other visual representations of data, each highlighting different aspects of trends and statistics. The use of various colors, including green, red, and blue, against a dark background with white text enhances the visual appeal and facilitates easy comprehension. This image was generated using artificial intelligence.
Free with trial A set of black and white icons representing different types of business and financial charts including bar graphs line graphs and pie charts. Increase decrease graph vectors Collection of various business and financial chart icons including bar graphs line graphs and pie charts. A set of black and white icons representing different types of business and financial charts including bar graphs line graphs and pie charts
Free with trial Colorful bar chart on a blue background showing data analysis and statistical growth. Generative AI. Increase decrease graph illustrations Colorful bar chart on a blue background showing data analysis and statistical growth
Free with trial Current market price and expected market price to calculate desired profit and target cost vector. Increase decrease graph vectors Current market price and expected market price to calculate desired profit and target cost
Free with trial Percent growth and decline arrow icon on black circle. Percentage up and down arrows vector concept. Increase decrease graph vectors Percent growth and decline arrow icon on black circle. Percentage up and down arrows concept
Free with trial Stack of coins with upward arrow, symbolizing growth, savings, investment, and financial success ,Generative ai. Increase decrease graph illustrations Ascending arrow on coin stack, visualizing financial growth, investment, savings, and wealth building. Stack of coins with upward arrow, symbolizing growth, savings, investment, and financial success ,Generative ai
Free with trial Up down arrow icon isolated on white background. Upward downward arrows sign symbol vector. Increase decrease graph vectors Up down arrow icon isolated on white background. Upward downward arrows sign symbol
Free with trial Green glossy arrow pointing upwards isolated on white background. Direction guide. Close-up. Increase decrease graph illustrations Green glossy arrow pointing upwards isolated on white background. Direction guide
Free with trial Green glossy arrow pointing upwards isolated on white background. Direction guide. Close-up. Increase decrease graph illustrations Green glossy arrow pointing upwards isolated on white background. Direction guide
Free with trial Green glossy arrow pointing upwards isolated on white background. Direction guide. Close-up. Increase decrease graph illustrations Green glossy arrow pointing upwards isolated on white background. Direction guide
Free with trial Green glossy arrow pointing upwards isolated on white background. Direction guide. Close-up. Increase decrease graph illustrations Green glossy arrow pointing upwards isolated on white background. Direction guide
Free with trial Green screen chart analysis, data visualization, metrics tracking, business growth ,Generative ai. Increase decrease graph illustrations Green screen chart analysis, datadriven insights for business growth and performance tracking. Green screen chart analysis, data visualization, metrics tracking, business growth ,Generative ai
Free with trial Up and down arrow icon in trendy style. Upward and downward sign symbol vector. Increase decrease graph vectors Up and down arrow icon in trendy style. Upward and downward sign symbol
Free with trial Colored miniature houses stand on real estate market analysis chart. Hand holds home loan. Housing market concept, mortgage rates rising falling. Property value increase decrease. Increase decrease graph illustrations Colored miniature houses stand on real estate market analysis chart. Hand holds home loan. Housing market concept, mortgage rates
Free with trial Vibrant abstract visualization of a trendline against a gradient background, ideal for business reports, financial analysis, and creative projects. Increase decrease graph illustrations Abstract Data Visualization of a Trendline with Blue and Pink Background for Business Use. Vibrant abstract visualization of a trendline against a gradient background, ideal for business reports, financial analysis, and creative projects
Free with trial Colorful data charts, graphs, and infographics on white background, illustrating business analytics, breathtaking wallpaper background Generative AI. Increase decrease graph illustrations Colorful data charts, graphs, and infographics on white background, illustrating business analytics
Free with trial Close-up view of city street with bar chart overlay, visualizing urban data analysis ,Generative AI. Increase decrease graph illustrations Urban data analysis, closeup view of city street with bar chart visualization closeup. Close-up view of city street with bar chart overlay, visualizing urban data analysis ,Generative AI
Free with trial Ascending green chart indicates positive financial growth in stock market investment ,Generative ai. Increase decrease graph illustrations Ascending green stock chart symbolizes positive financial growth and investment success in market. Ascending green chart indicates positive financial growth in stock market investment ,Generative ai
Free with trial Minimalist 3D of pastel geometric shapes symbolizing financial growth, investment, profit, success, and progress. Great for illustrating your unique designs or attracting customer attention. Clear area for showcasing your products, copy space, banner, marketing. This AI image graphic representation. Generative AI. Increase decrease graph illustrations Pastel Geometric Financial Growth Minimalist Marketing Minimalist 3D of pastel geometric shapes symbolizing financial growth. Minimalist 3D of pastel geometric shapes symbolizing financial growth, investment, profit, success, and progress. Great for illustrating your unique designs or attracting customer attention. Clear area for showcasing your products, copy space, banner, marketing. This AI image graphic representation. Generative AI
Free with trial Four distinct graphs and charts illustrating various data trends and patterns, each with unique colors and styles. Increase decrease graph illustrations Collection of colorful graphs and charts displaying data trends isolated on transparent background. Four distinct graphs and charts illustrating various data trends and patterns, each with unique colors and styles
Free with trial A businessman points to a digital interface displaying glowing neon icons and text related to vendor performance metrics and business growth. Increase decrease graph illustrations Businessman points to vendor performance metrics on screen. A businessman points to a digital interface displaying glowing neon icons and text related to vendor performance metrics and business growth
Free with trial This image depicts various financial concepts using graphical icons on mobile devices. It includes illustrations of rising and falling trends, balanced scales, growth, and investment themes, possibly representing market analysis, stock performance, investment growth, and financial balance. Increase decrease graph illustrations Financial trends and investment concepts illustrated with modern icons isolated on white background. This image depicts various financial concepts using graphical icons on mobile devices. It includes illustrations of rising and falling trends, balanced scales, growth, and investment themes, possibly representing market analysis, stock performance, investment growth, and financial balance
Free with trial Percent up and down icon isolated on white background. Percentage arrow growth and decline sign symbol vector. Increase decrease graph vectors Percent up and down icon isolated on white background. Percentage arrow growth and decline sign symbol
Free with trial A collection of colorful isometric bar charts and line graphs are displayed on a white background, representing data visualization and analysis. Increase decrease graph illustrations Isometric colorful bar charts and line graphs displayed on a white background for data visualization. a collection of colorful isometric bar charts and line graphs are displayed on a white background, representing data visualization and analysis
Free with trial Uptrend and downtrend arrow icon with long shadow. Up and down arrows illustration concept. Increase decrease graph vectors Uptrend and downtrend arrow icon with long shadow. Up and down arrows concept
Free with trial Stacks of coins with green up arrow and red down arrow representing stock market fluctuation and investment risk. Generative AI. Increase decrease graph illustrations Stacks of coins with green up arrow and red down arrow representing stock market fluctuation and investment risk
Free with trial Black and white icon of a dollar sign surrounded by arrows pointing up and down, representing market volatility. Increase decrease graph illustrations Dollar currency fluctuating up and down with arrows icon. Black and white icon of a dollar sign surrounded by arrows pointing up and down, representing market volatility
Free with trial Upward rightward, downward leftward, upward leftward, and downward rightward icon vector on black square. Increase decrease graph vectors Upward rightward, downward leftward, upward leftward, and downward rightward icon on black square
Free with trial A high-tech visualization of financial data, showing a glowing blue bar chart and line graphs representing stock market trends, business analytics, and economic growth. Increase decrease graph illustrations Futuristic digital stock market chart with glowing blue graphs and data analysis on a dark background. A high-tech visualization of financial data, showing a. A high-tech visualization of financial data, showing a glowing blue bar chart and line graphs representing stock market trends, business analytics, and economic growth
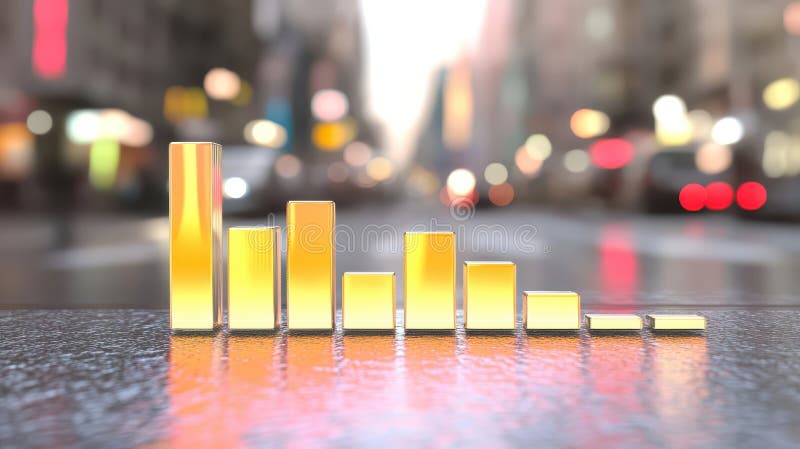
Free with trial Vibrant financial chart with colorful bars stands out against a soft focus background of city lights, embodying modern analytics and market trends. Increase decrease graph illustrations Abstract Financial Analysis with Colorful Chart Bars Overlaid on Blurred City Lights in Night Setting. Vibrant financial chart with colorful bars stands out against a soft focus background of city lights, embodying modern analytics and market trends
Free with trial Hand drawn line art percentage arrow icon set featuring downward and upward trending arrows with percentage signs for financial data representation. Increase decrease graph vectors Hand drawn line art percentage arrow icon set featuring downward and upward trending arrows with percentage signs for
Free with trial HR management set. Comprehensive employee education visuals. Diverse work culture and remote working icons. Career progression and achievement graphics. Vector illustration. Increase decrease graph vectors HR management set. Vector illustration. HR management set. Comprehensive employee education visuals. Diverse work culture and remote working icons. Career progression and achievement graphics. Vector illustration.
Free with trial This image depicts a simple yet effective graphic representation of contrasting trends, featuring a green up arrow and a red down arrow accompanied by percentage signs. The visual metaphor is commonly used in financial and economic contexts to illustrate growth and decline, making it a versatile and recognizable symbol in business and market analysis. Increase decrease graph illustrations A graphic illustration of a green up arrow and a red down arrow with percentage signs, symbolizing growth and decline. This image depicts a simple yet effective graphic representation of contrasting trends, featuring a green up arrow and a red down arrow accompanied by percentage signs. The visual metaphor is commonly used in financial and economic contexts to illustrate growth and decline, making it a versatile and recognizable symbol in business and market analysis.
Free with trial Reduction chart icon set depicting data reduction symbols, ideal for business analytics and performance visuals. Increase decrease graph vectors Reduction chart icon set depicting data reduction symbols.Vector illustration. Reduction chart icon set depicting data reduction symbols, ideal for business analytics and performance visuals
Free with trial Green bars and an upward arrow signify profit, contrasted by red bars and a downward arrow representing loss on a white background. Increase decrease graph illustrations Visual comparison of profit and loss using green ascending and red descending bar charts and arrows on a white. Green bars and an upward arrow signify profit, contrasted by red bars and a downward arrow representing loss on a white background
Free with trial A comprehensive data analysis icon set, ideal for illustrating data processing, teamwork dynamics, chart analysis, and various analytical tools, all on a white backdrop. Increase decrease graph vectors Vector art of data analysis icon set, featuring data processing, teamwork, charts, and various analytical tools and. A comprehensive data analysis icon set, ideal for illustrating data processing, teamwork dynamics, chart analysis, and various analytical tools, all on a white backdrop
Free with trial 3d man analyzing bar chart, a visual representation of growth, business performance, and investment strategy ,Generative ai. Increase decrease graph illustrations 3d man analyzing bar chart, a visual representation of growth, business performance, and investment strategy
Free with trial A businessman in suit pushing a percent sign for your needs. Concept for online bank or your finance company. Special offer, sale, gift. Vector illustration. Increase decrease graph vectors A businessman in suit pushing a percent sign for your needs. Concept for online bank or your finance company. Special
Free with trial Line art business graphs set featuring financial growth and decline with dollar signs for economic performance. Increase decrease graph vectors Line art business graphs set featuring financial growth and decline with dollar signs for economic performance
Free with trial Up and down arrow icon set on circle line. Upward and downward direction. Increase decrease graph vectors Up and down arrow icon set on circle line
Free with trial A set of modern icons depicting financial concepts such as mortgage rates, loan interest fluctuations, and investment growth, using charts and percentage symbols. Increase decrease graph vectors Financial icons illustrating mortgage rates, loan interest, and investment growth with charts and percentage symbols. A set of modern icons depicting financial concepts such as mortgage rates, loan interest fluctuations, and investment growth, using charts and percentage symbols
Free with trial Four distinct 3D graphs illustrating different data trends and representations, featuring upward and downward movements. Increase decrease graph illustrations Collection of 3d graphs showing various trends and data representations isolated on transparent background. Four distinct 3D graphs illustrating different data trends and representations, featuring upward and downward movements
Free with trial Hand drawn line art illustration of financial analysis depicting growth and market trends for business strategy. Increase decrease graph vectors Hand drawn line art illustration of financial analysis depicting growth and market trends for business strategy
Free with trial Stylized vector graphic featuring an upward arrow and percentage sign, connected by lines, demonstrating rising performance and decreasing rates against a dark background. Increase decrease graph vectors Rising Performance and Decreasing Costs: Stylized Arrow and Percentage Icons Illustrating Financial Trends. Stylized vector graphic featuring an upward arrow and percentage sign, connected by lines, demonstrating rising performance and decreasing rates against a dark background.
Free with trial Black and white icon of a statistical chart representing unemployed people applying for an open job position. Increase decrease graph vectors Statistical chart showing unemployed people applying for job. Black and white icon of a statistical chart representing unemployed people applying for an open job position
Free with trial Stylized graphics depict market trends with up and down arrows. Flat design with simple shapes for business and financial presentations. Increase decrease graph vectors Stylized infographics illustrating growth and decline with upward and downward arrows on black background. Stylized graphics depict market trends with up and down arrows. Flat design with simple shapes for business and financial presentations.
Free with trial Bold illustration of financial market trends depicting monetary growth and decline for business and investment concepts. Increase decrease graph vectors Bold illustration of financial market trends depicting monetary growth and decline for business and investment concepts
Free with trial A set of business and data analysis icons, perfect for presentations, reports, and dashboards. These icons cover various aspects of data management and reporting. Increase decrease graph vectors Vector art of collection of business and data analysis icons, representing various aspects of data management and reporting. A set of business and data analysis icons, perfect for presentations, reports, and dashboards. These icons cover various aspects of data management and reporting
Free with trial Business man with floating icon show uptrend of business. Increase decrease graph illustrations Business man with floating icon show uptrend of business
Free with trial This image showcases data analysis and cloud computing icons, including graphs, security, funnel, magnifying glass, error, and data processing, all in one visual. Increase decrease graph vectors Vector art of data analysis and cloud computing icons, featuring graphs, security, funnel, magnifying glass, error, and data. This image showcases data analysis and cloud computing icons, including graphs, security, funnel, magnifying glass, error, and data processing, all in one visual
Free with trial Dollar sign up and down arrow icon logo sign vector outline in black and white color. Increase decrease graph vectors Dollar sign up and down arrow icon logo sign vector outline
Free with trial A hand with the index finger extended and a glowing blue light on the fingertip surrounded by various blue percentage symbols and arrows on a white background. Increase decrease graph illustrations A hand with a glowing blue light and percentage symbols floating around isolated on transparent background, isolated on white. a hand with the index finger extended and a glowing blue light on the fingertip surrounded by various blue percentage symbols and arrows on a white background
Free with trial Change in Market equilibrium when demand, supply and price changes vector. Increase decrease graph vectors Change in Market equilibrium when demand, supply and price changes
Free with trial Black and white line icons depicting various business finance and technology concepts including currency symbols credit cards security shields and more on white background , seamless texture. Increase decrease graph vectors Collection of various business finance and technology icons such as currency symbols credit cards and security shie. Black and white line icons depicting various business finance and technology concepts including currency symbols credit cards security shields and more on white background , seamless texture
Free with trial Black and white line icons on a white background depicting various business finance and technology concepts , creative perspective. Increase decrease graph vectors Collection of business finance and technology icons including symbols for analysis marketing security and communica. Black and white line icons on a white background depicting various business finance and technology concepts , creative perspective
Free with trial Dollar sign up and down arrow icon Vector symbol or sign set collection in black and white outline. Increase decrease graph vectors Dollar sign up and down arrow icon mark in filled style. Dollar sign up and down arrow icon Vector symbol or sign set collection in black and white outline
Free with trial Heartbeat line morphs into falling red arrow on dark grid, showing sudden economic flatline. Vector illustration. Concept of downturn, crisis mode, emergency slowdown, collapse, instability. Increase decrease graph illustrations Heartbeat line morphs into falling red arrow on dark grid, showing sudden economic flatline. Vector illustration.
Free with trial Black and white collection of business and finance icons including marketing and productivity symbols on a white background , artistic vibe. Increase decrease graph vectors Collection of business and finance icons including marketing and productivity symbols various signs and objects fo. Black and white collection of business and finance icons including marketing and productivity symbols on a white background , artistic vibe
Free with trial Opportunity cost to compare the return of best foregone option and the chosen option vector. Increase decrease graph vectors Opportunity cost to compare the return of best foregone option and the chosen option
Free with trial A 3D rendered yellow Bitcoin coin with the iconic 'B' symbol is centrally placed. To its left, a green circle with an upward arrow signifies growth, while to its right, a red circle with a downward arrow represents decline. These elements are presented on a clean white background, illustrating cryptocurrency market trends. Increase decrease graph illustrations 3D Rendered Bitcoin Symbol with Up and Down Arrows Indicating Cryptocurrency Market Trends on a White Background. A 3D rendered yellow Bitcoin coin with the iconic 'B' symbol is centrally placed. To its left, a green circle with an upward arrow signifies growth, while to its right, a red circle with a downward arrow represents decline. These elements are presented on a clean white background, illustrating cryptocurrency market trends