Free with trial A clean, minimalist 3D render of a blue bar chart with a blue trend line connecting circular data points. The bars vary in height, illustrating growth and fluctuations. The background is a bright, clean white, emphasizing the chart's elements. This graphic is ideal for representing financial data, business growth, market trends, statistics, and performance analysis in a modern and professional style. Increase decrease graph illustrations 3D Blue Bar Chart with Trend Line. A clean, minimalist 3D render of a blue bar chart with a blue trend line connecting circular data points. The bars vary in height, illustrating growth and fluctuations. The background is a bright, clean white, emphasizing the chart's elements. This graphic is ideal for representing financial data, business growth, market trends, statistics, and performance analysis in a modern and professional style.
Free with trial Diagram icons set in outline stroke design for web. Pack line pictograms with growth bar chart, pie data, datum, marketing, analyzing finance, flow, infographic, statistic, other. Vector illustration. Increase decrease graph vectors Diagram icons set in outline stroke design for web. Pack line pictograms with growth bar chart, pie data, datum
Free with trial A clean and simple vector illustration of a bar chart isolated on a white background. This minimalist graphic features three vertical bars in varying shades of blue, representing data, statistics, or progress. Ideal for business reports, financial presentations, infographics, websites, and educational materials. The flat design symbolizes concepts like growth, analysis, market research, and performance comparison, offering a modern and clear way to visualize information. Ample copy space is available. Increase decrease graph illustrations Simple Blue Bar Chart Vector Icon for Business Data. A clean and simple vector illustration of a bar chart isolated on a white background. This minimalist graphic features three vertical bars in varying shades of blue, representing data, statistics, or progress. Ideal for business reports, financial presentations, infographics, websites, and educational materials. The flat design symbolizes concepts like growth, analysis, market research, and performance comparison, offering a modern and clear way to visualize information. Ample copy space is available.
Free with trial This image showcases six vibrant icons representing various data visualization methods, including pie charts, bar graphs, and gauges. These colorful and engaging visuals are perfect for presentations or reports and were generated by AI. They offer a quick and easy way to represent data in a clear a. Increase decrease graph illustrations Colorful Data Visualization Icons. This image showcases six vibrant icons representing various data visualization methods, including pie charts, bar graphs, and gauges. These colorful and engaging visuals are perfect for presentations or reports and were generated by AI. They offer a quick and easy way to represent data in a clear a
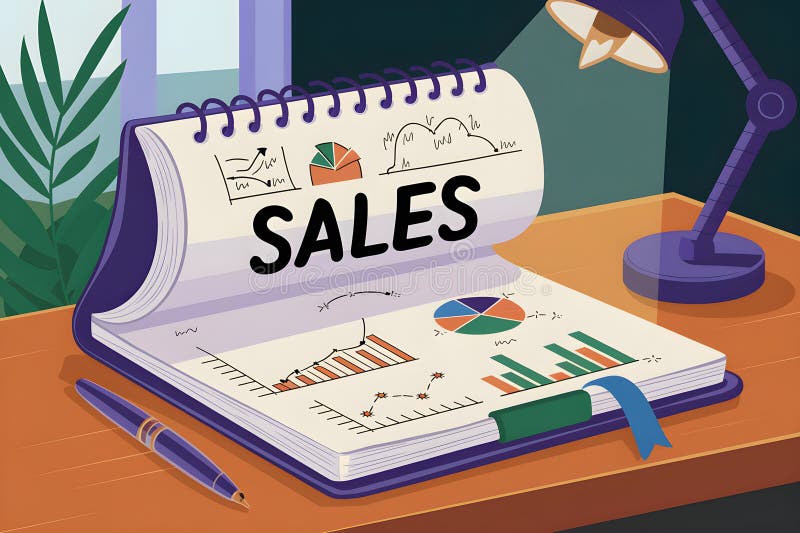
Free with trial Open notebook displaying sales data with charts, graphs, and the word sales highlighted, illuminated by a desk lamp, symbolizing business analysis and strategy. Increase decrease graph illustrations Sales report with charts and graphs illuminated by desk lamp. Open notebook displaying sales data with charts, graphs, and the word sales highlighted, illuminated by a desk lamp, symbolizing business analysis and strategy
Free with trial This 3D rendering shows a stylized stock market chart, generated by AI, displayed on a sleek, blue metallic stand. The vibrant blue color and modern design make it visually appealing and ideal for representing technological advancements in finance. Increase decrease graph illustrations AI-Generated Stock Market Display. This 3D rendering shows a stylized stock market chart, generated by AI, displayed on a sleek, blue metallic stand. The vibrant blue color and modern design make it visually appealing and ideal for representing technological advancements in finance.
Free with trial Upward and downward zigzag arrow line icon vector with long shadow. Increase decrease graph vectors Upward and downward zigzag arrow line icon with long shadow
Free with trial Create a set of 16 vector icons related to finance and business. The style should be simple line art with a minimalist approach. Use a color palette of red and off-white/beige. The icons should include: shopping cart with upward arrow, various bar graphs (increasing and decreasing), piggy bank with coin, upward trending arrows, coins stack with upward arrow, dollar sign with gear, dollar sign in gear, calculator, bank building (classical style), torn dollar bill, credit card, cash money, and currency exchange (dollar and euro). Ensure clean lines and consistent spacing between icons. Increase decrease graph vectors Finance Icons: Vector Line Art Set. Create a set of 16 vector icons related to finance and business. The style should be simple line art with a minimalist approach. Use a color palette of red and off-white/beige. The icons should include: shopping cart with upward arrow, various bar graphs (increasing and decreasing), piggy bank with coin, upward trending arrows, coins stack with upward arrow, dollar sign with gear, dollar sign in gear, calculator, bank building (classical style), torn dollar bill, credit card, cash money, and currency exchange (dollar and euro). Ensure clean lines and consistent spacing between icons.
Free with trial Wooden blocks with arrow up and down with percentage icon. Business planning for target achievement. Measure of performance for a specific objective. 3d render. Increase decrease graph illustrations Wooden blocks with arrow up and down with percentage icon
Free with trial Glass down arrow sign with the word Down. Increase decrease graph illustrations Glass down arrow sign with the word Down.
Free with trial Conceptual image illustrating digital property management. A miniature house sits in a shopping cart, symbolizing the purchase or management of real estate. A tablet displays property management apps and data, while a holographic interface shows charts and information. This image conveys the use of technology in modern real estate and property management. Increase decrease graph illustrations Digital Property Management Concept. Conceptual image illustrating digital property management. A miniature house sits in a shopping cart, symbolizing the purchase or management of real estate. A tablet displays property management apps and data, while a holographic interface shows charts and information. This image conveys the use of technology in modern real estate and property management.
Free with trial This vibrant illustration depicts financial growth, showcasing a dramatic upward trend after an initial decline. The 3D bar chart and upward arrow, generated by AI, symbolize overcoming challenges and achieving significant financial success. The gold coin further emphasizes the positive outcome. Increase decrease graph illustrations AI-Generated Financial Growth Chart. This vibrant illustration depicts financial growth, showcasing a dramatic upward trend after an initial decline. The 3D bar chart and upward arrow, generated by AI, symbolize overcoming challenges and achieving significant financial success. The gold coin further emphasizes the positive outcome.
Free with trial Golden coins stack and up arrow. Flat vector icon isolated on white. Economy, finance, money symbol. Currency pictogram. Vector illustration. Increase decrease graph vectors Golden coin sign dollar vector growth vector. golden coins stack and up arrow. Flat vector icon isolated on white. Economy, finance, money symbol. Currency pictogram. Vector illustration
Free with trial Up and down arrow icon vector on black square. Upward and downward concept. Increase decrease graph vectors Up and down arrow icon on black square. Upward and downward concept
Free with trial Collection of red infographic elements including charts, graphs, diagrams and icons. Perfect for presentations, reports, and data visualization. Clean, modern design. Increase decrease graph illustrations Red Infographic Elements
Free with trial Up and down arrow icon set on square background. Upward and downward with long shadow. Increase decrease graph vectors Up and down arrow icon set on square background
Free with trial Simple up and down arrow line icon vector on black circle. Increase decrease graph vectors Simple up and down arrow line icon on black circle
Free with trial Upward and downward zigzag arrow line icon vector on square background. Increase decrease graph vectors Upward and downward zigzag arrow line icon on square background
Free with trial Upward and downward zigzag arrow line icon vector on circle background. Increase decrease graph vectors Upward and downward zigzag arrow line icon on circle background
Free with trial Up and down direction arrow icon illustration in black square. Increase decrease graph vectors Up and down direction arrow icon in black square. Up and down direction arrow icon illustration in black square
Free with trial Uptrend and downtrend arrow icon set. Vectors. Increase decrease graph illustrations Uptrend and downtrend arrow icon set. Vectors
Free with trial Chart showcasing progress. The last bar stands out as a green arrow, symbolising positive growth. Accompanied by cash, it's a powerful representation of financial success. Increase decrease graph vectors Financial Growth Chart with Positive Momentum. Chart showcasing progress. The last bar stands out as a green arrow, symbolising positive growth. Accompanied by cash, it's a powerful representation of financial success...
Free with trial Arrows going Up and Down, green and red arrows. Concept of sales bar chart symbol icon with arrow moving down and sales. Increase decrease graph illustrations Arrows going Up and Down, green and red arrows. Concept of sales bar chart symbol icon with arrow moving down and sales
Free with trial A close-up shot of a hand interacting with a digital stock market chart. The chart displays candlestick patterns and percentage changes, representing fluctuating market values. The image conveys concepts of financial analysis, investment strategy, and data-driven decision making in the stock market. Suitable for illustrating articles or presentations related to finance, trading, and economic trends. Increase decrease graph illustrations Analyzing Stock Market Trends. A close-up shot of a hand interacting with a digital stock market chart. The chart displays candlestick patterns and percentage changes, representing fluctuating market values. The image conveys concepts of financial analysis, investment strategy, and data-driven decision making in the stock market. Suitable for illustrating articles or presentations related to finance, trading, and economic trends.
Free with trial This image showcases two contrasting bar charts, constructed from red and white blocks, generated by AI. One chart depicts growth, while the other illustrates decline, offering a visual representation of opposing trends. The use of color and simple shapes makes it easily understandable. Increase decrease graph illustrations AI-Generated Block Charts: Growth & Decline. This image showcases two contrasting bar charts, constructed from red and white blocks, generated by AI. One chart depicts growth, while the other illustrates decline, offering a visual representation of opposing trends. The use of color and simple shapes makes it easily understandable.
Free with trial Multiple line charts showing data trends over months on a grid background. Concept of data analysis and financial growth. 3D Rendering. Increase decrease graph illustrations Multiple line charts showing data trends over months on grid background. 3D Rendering. Multiple line charts showing data trends over months on a grid background. Concept of data analysis and financial growth. 3D Rendering
Free with trial A vibrant 3D bar chart featuring multiple colorful columns, including red, blue, green, yellow, and purple, set against a clean white background. The bars vary in height, representing different data points or categories, and are displayed on a reflective surface, adding depth to the visualization. Grid lines provide a clear scale for interpretation. This modern graphic is ideal for illustrating statistics, business growth, financial performance, market analysis, and educational concepts in presentations, reports, and digital media. Increase decrease graph illustrations Colorful 3D Bar Chart on White Background. A vibrant 3D bar chart featuring multiple colorful columns, including red, blue, green, yellow, and purple, set against a clean white background. The bars vary in height, representing different data points or categories, and are displayed on a reflective surface, adding depth to the visualization. Grid lines provide a clear scale for interpretation. This modern graphic is ideal for illustrating statistics, business growth, financial performance, market analysis, and educational concepts in presentations, reports, and digital media.
Free with trial Reduction chart icon vector logo set collection for web app ui. Increase decrease graph vectors Reduction chart icon Thin line illustration set. Reduction chart icon vector logo set collection for web app ui
Free with trial 3D illustration of gold bars with a red arrow sloping down, symbolizing financial decrease, and scattered golden coins. Increase decrease graph illustrations Gold bars with red arrow and scattered coins. 3D illustration of gold bars with a red arrow sloping down, symbolizing financial decrease, and scattered golden coins
Free with trial Wooden blocks with arrow up and down on Balance scale of percentage icon. Business planning for target achievement. Measure of performance for a specific objective. 3d render. Increase decrease graph illustrations Wooden blocks with arrow up and down on Balance scale of percentage icon
Free with trial This image presents a set of four icons depicting different types of bar charts with upward and downward trends. These icons are commonly used to visually represent growth, decline, progress, and regression in various contexts, such as business, finance, and data analysis. Increase decrease graph vectors Collection of Growth and Decline Chart Icons. This image presents a set of four icons depicting different types of bar charts with upward and downward trends. These icons are commonly used to visually represent growth, decline, progress, and regression in various contexts, such as business, finance, and data analysis.
Free with trial Bankruptcy and inflation business, man in depression. Vector of crisis finance bankruptcy, business economy inflation illustration. Increase decrease graph illustrations Bankruptcy and inflation business, man in depression
Free with trial A stock chart shows a red arrow trending upwards with a sharp decline represented by a red bar, juxtaposed with green bars, illustrating market fluctuations for financial analysis. Increase decrease graph illustrations Stock Chart with Red Arrow and Green Bars. A stock chart shows a red arrow trending upwards with a sharp decline represented by a red bar, juxtaposed with green bars, illustrating market fluctuations for financial analysis
Free with trial Up and down direction arrow icon set on circle line. Upward and downward concept. Increase decrease graph vectors Up and down direction arrow icon set on circle line
Free with trial Statistic Up icon outline collection or set in black and white. Increase decrease graph vectors Statistic Up icon Line Art Logo set. Statistic Up icon outline collection or set in black and white
Free with trial Close-up of various financial charts and graphs displayed on a dark screen, with blue and orange color schemes. Image. Increase decrease graph illustrations Financial Data Charts and Graphs on Screen. Close-up of various financial charts and graphs displayed on a dark screen, with blue and orange color schemes. Image
Free with trial A pair of hands gently cradles four small, wooden house models against a backdrop of financial charts and graphs. The image evokes concepts of real estate investment, market analysis, and the security of owning property. The wooden houses symbolize homes and the charts represent market trends, making it suitable for illustrating financial articles, investment advice, or real estate services. Increase decrease graph illustrations Real Estate Market Analysis and Investment. A pair of hands gently cradles four small, wooden house models against a backdrop of financial charts and graphs. The image evokes concepts of real estate investment, market analysis, and the security of owning property. The wooden houses symbolize homes and the charts represent market trends, making it suitable for illustrating financial articles, investment advice, or real estate services.
Free with trial Economic Loss icon outline collection or set in black and white. Increase decrease graph vectors Economic Loss icon Line Art Logo set. Economic Loss icon outline collection or set in black and white
Free with trial 3D rendering of a dynamic presentation stand showcasing financial data. Colorful, geometric shapes and infographics present market statistics, including percentages, dollar amounts, and bar graphs. Stacks of coins and various data elements are displayed on a dark blue platform with orange accents. Suitable for illustrating financial reports, market analysis, investment strategies, or business presentations. Increase decrease graph illustrations Modern Financial Data Visualization Display. 3D rendering of a dynamic presentation stand showcasing financial data. Colorful, geometric shapes and infographics present market statistics, including percentages, dollar amounts, and bar graphs. Stacks of coins and various data elements are displayed on a dark blue platform with orange accents. Suitable for illustrating financial reports, market analysis, investment strategies, or business presentations.
Free with trial A vibrant, glossy red 3D percentage symbol stands prominently on a clean white background, casting a subtle shadow. This eye-catching graphic is perfect for conveying concepts of discounts, sales, interest rates, financial growth, or statistical data. Its bold, modern design makes it ideal for marketing campaigns, business presentations, retail promotions, economic reports, or any project requiring a clear and impactful representation of percentages, savings, or performance metrics. Increase decrease graph illustrations Red 3D Percentage Symbol on White Background. A vibrant, glossy red 3D percentage symbol stands prominently on a clean white background, casting a subtle shadow. This eye-catching graphic is perfect for conveying concepts of discounts, sales, interest rates, financial growth, or statistical data. Its bold, modern design makes it ideal for marketing campaigns, business presentations, retail promotions, economic reports, or any project requiring a clear and impactful representation of percentages, savings, or performance metrics.
Free with trial Dollar arrow up and down icon vector. USD growth and decline concept. Increase decrease graph vectors Dollar arrow up and down icon. USD growth and decline concept
Free with trial A clean, minimalist bar chart illustration set against a solid green background. The chart features three white vertical bars of different heights, representing data points or progress over time. A simple white grid and axes are visible, indicating a clear visual representation of statistics. This versatile graphic is ideal for conveying concepts of business growth, financial analysis, market trends, statistical reporting, or educational content in a modern, easy-to-understand format. Perfect for presentations, infographics, websites, and applications. Increase decrease graph vectors Minimalist Bar Chart Icon on Green Background. A clean, minimalist bar chart illustration set against a solid green background. The chart features three white vertical bars of different heights, representing data points or progress over time. A simple white grid and axes are visible, indicating a clear visual representation of statistics. This versatile graphic is ideal for conveying concepts of business growth, financial analysis, market trends, statistical reporting, or educational content in a modern, easy-to-understand format. Perfect for presentations, infographics, websites, and applications.
Free with trial A minimalist line drawing of a bar chart, representing data, statistics and growth. Simple, bold and clean graphic icon. Increase decrease graph vectors Simple Line Chart Bar Statistic Graphic Icon. A minimalist line drawing of a bar chart, representing data, statistics and growth. Simple, bold and clean graphic icon.
Free with trial A comprehensive collection of black and white icons representing various financial and business charts, including bar, line, and pie graphs, for data visualization. Increase decrease graph vectors Assortment of financial and business chart icons. A comprehensive collection of black and white icons representing various financial and business charts. A comprehensive collection of black and white icons representing various financial and business charts, including bar, line, and pie graphs, for data visualization
Free with trial Business data visualization with various charts white background. Increase decrease graph illustrations Business data visualization with various charts
Free with trial Illustration of an ascending red arrow and a descending blue arrow. Simple curved arrow icon. Increase decrease graph vectors Illustration of an ascending red arrow and a descending blue arrow.
Free with trial Stacks of gold coins, financial growth, investment generative ai image. Increase decrease graph illustrations Stacks of gold coins, financial growth, investment
Free with trial Line art vector icon of the exchange rate of bitcoin cryptocurrency increasing as the value of the dollar decreases. Increase decrease graph vectors Bitcoin cryptocurrency rising as dollar currency is falling. Line art vector icon of the exchange rate of bitcoin cryptocurrency increasing as the value of the dollar decreases
Free with trial A vibrant and modern illustration showcasing various data visualization elements. The image features a collection of charts, graphs, and diagrams, including line graphs, bar graphs, pie charts, and circular diagrams, all rendered in a colorful and abstract style. The design incorporates gradients and geometric shapes, suggesting growth, analysis, and business concepts. Ideal for presentations, reports, websites, and marketing materials related to finance, economics, and data analysis. Increase decrease graph illustrations Abstract Data Visualization and Business Charts. A vibrant and modern illustration showcasing various data visualization elements. The image features a collection of charts, graphs, and diagrams, including line graphs, bar graphs, pie charts, and circular diagrams, all rendered in a colorful and abstract style. The design incorporates gradients and geometric shapes, suggesting growth, analysis, and business concepts. Ideal for presentations, reports, websites, and marketing materials related to finance, economics, and data analysis.
Free with trial A stack of coins with a green arrow pointing down. The coins are stacked on top of each other, with the bottom coin being the largest. Concept of decline or decrease, as the arrow points downward. Increase decrease graph illustrations A stack of coins with a green arrow pointing down
Free with trial A vibrant collection of hand-drawn business charts and graphs, rendered in shades of blue with a sketch-like aesthetic. The set includes various types of visualizations like bar charts, line graphs, pie charts, and donut charts, representing data, growth, and analysis. This versatile illustration is perfect for presentations, reports, infographics, and any project requiring a visual representation of financial or statistical information with a creative, hand-crafted feel. Increase decrease graph illustrations Hand-Drawn Business Charts and Graphs Collection. A vibrant collection of hand-drawn business charts and graphs, rendered in shades of blue with a sketch-like aesthetic. The set includes various types of visualizations like bar charts, line graphs, pie charts, and donut charts, representing data, growth, and analysis. This versatile illustration is perfect for presentations, reports, infographics, and any project requiring a visual representation of financial or statistical information with a creative, hand-crafted feel.
Free with trial Hand holding coin with arrows symbolizing increasing and decreasing value. Suitable for financial growth concepts in presentations, articles, and ads. Increase decrease graph vectors Hand holding coin with arrows symbolizing increasing and decreasing value
Free with trial Business growth presentation with charts and graphs showing progress, statistics, and performance. The image showcases key financial indicators in a clear, concise format. Increase decrease graph vectors Financial Data Analysis Report on Screen Display. Business growth presentation with charts and graphs showing progress, statistics, and performance. The image showcases key financial indicators in a clear, concise format.
Free with trial Arrow percent icon in line style. Up and down percentage outline sign symbol illustration. Increase decrease graph vectors Arrow percent icon in line style. Up and down percentage outline sign symbol
Free with trial Strategic Decisions: Integrating Business Analytics with Strategic Thinking. This visual portrays the dynamic interaction between business analytics and strategic thinking, showcasing how analytical insights drive strategic planning and decision-making. It emphasizes the synergy between data analysis and strategic foresight in achieving business goals. --chaos 10 --ar 16:9 --style raw --stylize, aesthetic wallpaper background. Increase decrease graph illustrations Colorful Pie Charts and Bar Graphs on a White Paper. Strategic Decisions: Integrating Business Analytics with Strategic Thinking. This visual portrays the dynamic interaction between business analytics and strategic thinking, showcasing how analytical insights drive strategic planning and decision-making. It emphasizes the synergy between data analysis and strategic foresight in achieving business goals. --chaos 10 --ar 16:9 --style raw --stylize, aesthetic wallpaper background
Free with trial Dollar up and down icon in outline style. USD arrow sign symbol vector. Increase decrease graph vectors Dollar up and down icon in outline style. USD arrow sign symbol
Free with trial Three line graphs, data visualization, chart comparison. Increase decrease graph vectors Three line graphs, data visualization, chart comparison
Free with trial Line art vector icon of stacks of coins with some arrows pointing up and some pointing down, representing market volatility. Increase decrease graph vectors Money increasing and decreasing showing market volatility icon. Line art vector icon of stacks of coins with some arrows pointing up and some pointing down, representing market volatility
Free with trial Colorful bar and pie charts illustrate data analysis white background. Increase decrease graph illustrations Colorful bar and pie charts illustrate data analysis
Free with trial Nine black and white icons of abacuses on a white background, each with varying curves on the frame. The beads are arranged differently among the icons, suggesting diverse numerical configurations. The abacus curves either upward or downward, providing distinct shapes across each representation. These simple illustrations emphasize the classic design of the abacus as a counting tool. Increase decrease graph vectors Nine simple line graphs displayed in a grid pattern. Nine black and white icons of abacuses on a white background, each with varying curves on the frame. The beads are arranged differently among the icons, suggesting diverse numerical configurations. The abacus curves either upward or downward, providing distinct shapes across each representation. These simple illustrations emphasize the classic design of the abacus as a counting tool.
Free with trial Opportunity cost to compare the return of best foregone option and the chosen option vector. Increase decrease graph vectors Opportunity cost to compare the return of best foregone option and the chosen option
Free with trial Four cylindrical bar charts are displayed against a light gray background. The charts represent four items labeled ITEM 11, ITEM 12, ITEM 13, and ITEM 14. Each chart displays data series with circular markers and labels. The data series are colored in shades of teal, blue, and dark blue. The charts have a 3D cylindrical appearance with a slight gradient. Horizontal grid lines with numerical labels. Increase decrease graph illustrations Four cylindrical bar charts with blue and teal data. Four cylindrical bar charts are displayed against a light gray background. The charts represent four items labeled ITEM 11, ITEM 12, ITEM 13, and ITEM 14. Each chart displays data series with circular markers and labels. The data series are colored in shades of teal, blue, and dark blue. The charts have a 3D cylindrical appearance with a slight gradient. Horizontal grid lines with numerical labels
Free with trial Up and down curved arrow chart icon. Business trend bar symbol illustration. Increase decrease graph vectors Up and down curved arrow chart icon. Business trend bar symbol
Free with trial This abstract 3D rendered image showcases three prominent white candlestick-like objects, symbolizing financial growth and market trends. Positioned against a dark, gridded background, a subtle financial chart with smaller red and white candlesticks and wicks extends into the distance, reinforcing the theme of data analysis and investment. The clean, modern aesthetic makes it ideal for illustrating concepts related to stock market performance, cryptocurrency trading, economic growth, financial planning, and digital business strategies. It effectively conveys ideas of progress, success, and the dynamic nature of global markets. Increase decrease graph illustrations 3D Financial Candlestick Chart Representing Market Growth. This abstract 3D rendered image showcases three prominent white candlestick-like objects, symbolizing financial growth and market trends. Positioned against a dark, gridded background, a subtle financial chart with smaller red and white candlesticks and wicks extends into the distance, reinforcing the theme of data analysis and investment. The clean, modern aesthetic makes it ideal for illustrating concepts related to stock market performance, cryptocurrency trading, economic growth, financial planning, and digital business strategies. It effectively conveys ideas of progress, success, and the dynamic nature of global markets.
Free with trial Global finance data analysis on keyboard with charts, stunning background Generative AI. Increase decrease graph illustrations Global finance data analysis on keyboard with charts
Free with trial Blue Stacked Arrow Up Down on White, Direction ,Growth , This photo was created using generative AI. Increase decrease graph illustrations Blue Stacked Arrow Up Down on White, Direction ,Growth
Free with trial Up and down arrow icon on black square. Upward and downward sign symbol vector. Increase decrease graph vectors Up and down arrow icon on black square. Upward and downward sign symbol
Free with trial Up and down direction arrow icon with long shadow. Upload and download concept. Increase decrease graph vectors Up and down direction arrow icon with long shadow
Free with trial A futuristic concept of financial trading and data analysis. A glowing holographic stock market chart, with candlesticks and graphs, is projected onto a modern office desk. The scene includes a laptop and coffee, set against a large window with a blurry night city skyline. This image represents concepts like fintech, investment, big data, economic growth, and innovative business technology. Ideal for illustrating topics on digital finance, stock exchange, forex trading, and corporate strategy in a high-tech world. Increase decrease graph illustrations Futuristic Financial Trading Hologram on Office Desk. A futuristic concept of financial trading and data analysis. A glowing holographic stock market chart, with candlesticks and graphs, is projected onto a modern office desk. The scene includes a laptop and coffee, set against a large window with a blurry night city skyline. This image represents concepts like fintech, investment, big data, economic growth, and innovative business technology. Ideal for illustrating topics on digital finance, stock exchange, forex trading, and corporate strategy in a high-tech world.
Free with trial Dollar arrow up and down outline icon vector isolated on white background. Increase decrease graph vectors Dollar arrow up and down outline icon isolated on white background
Free with trial Creative Up and Down Arrow Set with Percentage for Business and Finance and Pictogram Element Vector Illustration Isolated on Transparent Background. Increase decrease graph vectors Up and Down Arrow with Percent Set Icon Clipart Vector Illustration. Creative Up and Down Arrow Set with Percentage for Business and Finance and Pictogram Element Vector Illustration Isolated on Transparent Background
Free with trial A collection of red and green arrows, some pointing up and others down, symbolizing market fluctuations and financial performance. Increase decrease graph illustrations Upward and downward arrows representing market trends. A collection of red and green arrows, some pointing up and others down, symbolizing market fluctuations and financial performance
Free with trial Three wooden blocks are arranged in a row on a reflective surface against a white background. The leftmost block has two green upward-pointing arrows cut out, revealing a green background. The middle block displays a dark blue percentage symbol. The rightmost block features a red downward-pointing arrow cut out, revealing a red background. Increase decrease graph illustrations Wooden blocks with up arrows percentage and down arrow. Three wooden blocks are arranged in a row on a reflective surface against a white background. The leftmost block has two green upward-pointing arrows cut out, revealing a green background. The middle block displays a dark blue percentage symbol. The rightmost block features a red downward-pointing arrow cut out, revealing a red background
Free with trial A vibrant, modern icon depicting a financial growth chart, representing investment and market analysis. The design features ascending lines and bars, suggesting positive trends. This graphic was generated by AI for illustrative purposes. A representation of financial success. Increase decrease graph illustrations Financial Growth Chart Icon - Business Investment Concept. A vibrant, modern icon depicting a financial growth chart, representing investment and market analysis. The design features ascending lines and bars, suggesting positive trends. This graphic was generated by AI for illustrative purposes. A representation of financial success.
Free with trial This image showcases a vibrant 3D rendering of various financial charts, including bar graphs, pie charts, and a rising arrow, symbolizing growth and profitability. Ideal for presentations, reports, and financial articles. Increase decrease graph illustrations Colorful 3D Financial Charts Showing Growth and Profit. This image showcases a vibrant 3D rendering of various financial charts, including bar graphs, pie charts, and a rising arrow, symbolizing growth and profitability. Ideal for presentations, reports, and financial articles.
Free with trial Concept Abstract Art, Blue Watercolor, Financial Growth, Chart, Abstract Design Abstract Blue Watercolor Financial Growth Chart. Increase decrease graph illustrations Abstract Blue Watercolor Financial Growth Chart. Concept Abstract Art, Blue Watercolor, Financial. Concept Abstract Art, Blue Watercolor, Financial Growth, Chart, Abstract Design Abstract Blue Watercolor Financial Growth Chart
Free with trial Hand raising a sign that says Leftward Direction drawn using engraving technique. Increase decrease graph vectors Hand raising a sign that says Leftward Direction Colored. Hand raising a sign that says Leftward Direction drawn using engraving technique
Free with trial Simple up and down arrow on black circle. Upward and downward sign symbol vector. Increase decrease graph vectors Simple up and down arrow on black circle. Upward and downward sign symbol
Free with trial Image is generated with the use of an AI. Increase decrease graph illustrations Investment and level of risk concept. Coins of dollar and no ris. image is generated with the use of an AI
Free with trial Archive market leadership icon logo sign vector outline in black and white color. Increase decrease graph vectors Market Leadership and Strategy Icon Inspired by Chess Tactics. Archive market leadership icon logo sign vector outline in black and white color