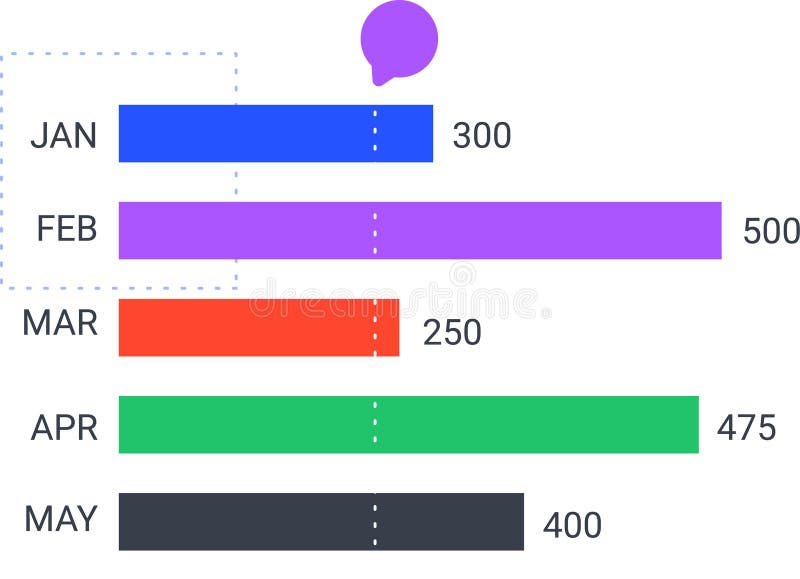
Free with trial Colorful horizontal bar chart is displaying monthly statistics from january to may, indicating trends and performance with a speech bubble above. Increase decrease graph vectors Colorful horizontal bar chart is displaying monthly statistics from january to may, indicating trends and performance
Free with trial Analyzing the business failure and decline. White magnifying glass analyzing a growth chart on a blue background, representing market analysis and business growth. 3D render. Increase decrease graph illustrations Magnifying glass analyzing growth chart on blue background. Analyzing the business failure and decline. White magnifying glass analyzing a growth chart on a blue background, representing market analysis and business growth. 3D render
Free with trial This image shows a financial report with bar graphs and numerical data, generated by AI, suggesting business performance or investment analysis. The document rests on a wooden desk, with coins blurred in the background, hinting at financial matters. Increase decrease graph illustrations Financial Report Analysis. This image shows a financial report with bar graphs and numerical data, generated by AI, suggesting business performance or investment analysis. The document rests on a wooden desk, with coins blurred in the background, hinting at financial matters.
Free with trial Up and down arrow icon set. Upward and downward illustration concept. Increase decrease graph vectors Up and down arrow icon set. Upward and downward concept. Up and down arrow icon set. Upward and downward illustration concept
Free with trial Set line Many ways directional arrow Arrow Shopping bag with Sale Hierarchy organogram chart Delivery tracking Light bulb and Target icon. Vector. Increase decrease graph vectors Set line Many ways directional arrow, Arrow, Shopping bag with Sale, Hierarchy organogram chart, Delivery tracking. Set line Many ways directional arrow Arrow Shopping bag with Sale Hierarchy organogram chart Delivery tracking Light bulb and Target icon. Vector.
Free with trial Productivity , diagram bar with gear icon symbol. Vector illustration. Increase decrease graph vectors Productivity , diagram bar with gear icon. Vector illustration
Free with trial Laptop screen displays stock market analysis. Financial data shows investment trends. Person may trader analyst. Investment stock market analysis. Dynamic market graphs. Modern tech. Increase decrease graph illustrations Laptop screen displays stock market analysis. Financial data shows investment trends. Person may trader analyst. Investment
Free with trial This abstract artwork illustrates financial market dynamics with intricate lines and colors, representing stock price movements and trading patterns artistically. Increase decrease graph illustrations Abstract financial market analysis with intricate lines depicting stock price movements and trading patterns in shades of black,. This abstract artwork. This abstract artwork illustrates financial market dynamics with intricate lines and colors, representing stock price movements and trading patterns artistically
Free with trial Colorful horizontal bar chart is displaying monthly statistics from january to may, indicating trends and performance with a speech bubble above. Increase decrease graph vectors Colorful horizontal bar chart is displaying monthly statistics from january to may, indicating trends and performance
Free with trial Featuring four vibrant business charts illustrating increasing, decreasing, fluctuating, and peaking trends, perfect for enhancing presentations and reports with clear visual data analysis. Increase decrease graph illustrations Featuring four vibrant business charts illustrating increasing, decreasing, fluctuating, and peaking trends, perfect for
Free with trial 3d Up and Down sign with red arrows vector collection. Design vector illustration concept of sales bar chart symbol icon set with arrow moving down and sales bar chart with arrow moving up. Increase decrease graph vectors 3d Up and Down sign with red arrows vector collection. Design vector illustration concept of sales bar chart symbol icon set
Free with trial Up and Down sign with blue and red arrows vector illustration. Concept of sales bar chart symbol icon with arrow moving down and sales bar chart with arrow moving up. Increase decrease graph vectors Up and Down sign with blue and red arrows vector illustration. Concept of sales bar chart symbol
Free with trial Upward and downward arrow icon set in generic design. Up and down direction sign symbol concept. Increase decrease graph vectors Upward and downward arrow icon set in generic design. Up and down direction sign symbol
Free with trial Reduce energy usage, in line design. Reduce, energy, usage, conservation, efficiency, sustainable, power on white background vector. Reduce energy usage editable stroke icon. Increase decrease graph vectors Reduce energy usage, in line design. Reduce, energy, usage, conservation, efficiency, sustainable, power on white
Free with trial An illustration of Businessman jumping from small to the big barrel oil. Investment, wealth management. Commodities price for trading and investment, Crude oil. Increase decrease graph vectors Businessman jumping from small to the big barrel oil
Free with trial Upward and downward arrows with a percentage symbol. An illustration of arrows pointing up and down, often used to represent changes, fluctuations, or progress, along with a percentage symbol. Increase decrease graph vectors Upward and Downward Arrows with Percentage, Financial Growth and Decline Concept. Upward and downward arrows with a percentage symbol. An illustration of arrows pointing up and down, often used to represent changes, fluctuations, or progress, along with a percentage symbol.
Free with trial Upward and downward arrows with a percentage symbol. An illustration of arrows pointing up and down, often used to represent changes, fluctuations, or progress, along with a percentage symbol. Increase decrease graph vectors Upward and Downward Arrows with Percentage, Financial Growth and Decline Concept. Upward and downward arrows with a percentage symbol. An illustration of arrows pointing up and down, often used to represent changes, fluctuations, or progress, along with a percentage symbol.
Free with trial Upward and downward arrows with a percentage symbol. An illustration of arrows pointing up and down, often used to represent changes, fluctuations, or progress, along with a percentage symbol. Increase decrease graph vectors Upward and Downward Arrows with Percentage, Financial Growth and Decline Concept. Upward and downward arrows with a percentage symbol. An illustration of arrows pointing up and down, often used to represent changes, fluctuations, or progress, along with a percentage symbol.
Free with trial Icon of a splash of poured liquid on the surface. Icon of flowing drop, wave, splash, splash of nature isolated on white background. Dripping liquid. Water spill. A drop of rain and a drop of sweat. Increase decrease graph vectors A large splash of spilled liquid on the surface. Icon of a splash of poured liquid on the surface. Icon of flowing drop, wave, splash, splash of nature isolated on white background. Dripping liquid. Water spill. A drop of rain and a drop of sweat
Free with trial Up and down arrow icon set in generic design. Upward and downward sign symbol illustration. Increase decrease graph vectors Up and down arrow icon set in generic design. Upward and downward sign symbol
Free with trial Stock Market icon vector image. Suitable for mobile application web application and print media. Increase decrease graph illustrations Stock Market icon vector image.
Free with trial Image displaying stock market chart, rising or falling trends Generative AI. Increase decrease graph illustrations Image displaying stock market chart, rising or falling trends
Free with trial Reduction chart icon. eps. Increase decrease graph vectors Chart Icon Demonstrating Reduction in Data, Business Decline, and Statistical Analysis. Reduction chart icon.eps
Free with trial Up and down direction arrow icon set on black circle. Increase decrease graph vectors Up and down direction arrow icon on black circle
Free with trial Up and down arrow icon on square background. Upward and downward sign symbol illustration with long shadow. Increase decrease graph vectors Up and down arrow icon on square background. Upward and downward sign symbol with long shadow
Free with trial Stock market chart arrows in red and green are seen as graphic elements and are seen in a 3-d illustration. Arrows indicate the upward and downward gains and losses on the Dow. Increase decrease graph illustrations Stock market chart arrows in red and green are seen as graphic elements and are seen in a 3-d illustration
Free with trial Analysis of website traffic using magnifying glass on laptop. Detailed data, graphs reviewed for blog ranking. Online marketing, business performance monitoring key. Research. Increase decrease graph illustrations Analysis of website traffic using magnifying glass on laptop. Detailed data, graphs reviewed for blog ranking. Online marketing
Free with trial Upward and downward arrow icon set in generic style. Up and down direction sign symbol illustration. Increase decrease graph vectors Upward and downward arrow icon set in generic style. Up and down direction sign symbol
Free with trial Interest growth icon Vector symbol or sign set collection in black and white outline. Increase decrease graph vectors Economic Growth Icon Illustrating Financial Prosperity, Investment Returns, and Profit Expansion. Interest growth icon Vector symbol or sign set collection in black and white outline
Free with trial A stack of wooden blocks with a red arrow pointing upwards. The blocks are arranged in a pyramid shape, with the top block being the largest. Concept of growth and progress generated by AI. Increase decrease graph vectors A stack of wooden blocks with a red arrow pointing upwards generated by AI. A stack of wooden blocks with a red arrow pointing upwards. The blocks are arranged in a pyramid shape, with the top block being the largest. Concept of growth and progress generated by AI
Free with trial 3D Isometric Flat Vector Illustration of Business Chart, Data and Statistic. Increase decrease graph vectors 3D Isometric Flat Vector Illustration of Business Chart
Free with trial The sales target schedule displays flat trends alongside varying performance metrics in a colorful chart Sales target schedule is trending flat. Increase decrease graph vectors The sales target schedule displays flat trends alongside varying performance metrics in a colorful chart Sales target schedule is
Free with trial Up and Down sign with green and red arrows vector illustration. Concept of sales bar chart symbol icon with arrow moving down and sales bar chart with arrow moving up. Increase decrease graph vectors Up and Down sign with green and red arrows vector illustration. Concept of sales bar chart symbol icon with arrows. Up and Down sign with green and red arrows vector illustration. Concept of sales bar chart symbol icon with arrow moving down and sales bar chart with arrow moving up.
Free with trial A stack of wooden blocks with a red arrow pointing downward. The blocks are numbered from 1 to 7 generated by AI. Increase decrease graph vectors A stack of wooden blocks with a red arrow pointing downward generated by AI. A stack of wooden blocks with a red arrow pointing downward. The blocks are numbered from 1 to 7 generated by AI
Free with trial A wooden arrow pointing upwards is on top of a stack of wooden blocks. Concept of growth and progress, as the arrow represents upward movement generated by AI. Increase decrease graph vectors A wooden arrow pointing upwards is on top of a stack of wooden blocks generated by AI. A wooden arrow pointing upwards is on top of a stack of wooden blocks. Concept of growth and progress, as the arrow represents upward movement generated by AI
Free with trial Upward and downward arrow icon set. Up and down direction sign symbol illustration. Increase decrease graph vectors Upward and downward arrow icon set. Up and down direction sign symbol
Free with trial 3D Isometric Flat Vector Illustration of Challenge Overcoming, Confident Investor Jumps From Red Arrow To Green For Growth Opportunity. Increase decrease graph vectors 3D Isometric Flat Vector Illustration of Challenge Overcoming
Free with trial A wooden block tower with a red arrow pointing upwards. The blocks are stacked in a pyramid shape generated by AI. Increase decrease graph vectors A wooden block tower with a red arrow pointing upwards generated by AI. A wooden block tower with a red arrow pointing upwards. The blocks are stacked in a pyramid shape generated by AI
Free with trial Clean animated bar chart visualizing rising and falling market trends with green bars representing growth, profit, and positive performance, and red bars indicating decline, loss, and negative movement. Symbolizes financial volatility, stock market cycles, economic fluctuations, investment performance, and business analytics. Ideal for illustrating bullish and bearish phases, economic indicators, trading activity, and financial data visualization. Increase decrease graph illustrations Financial Market Trend Animation Showing Upturn and Downturn Phases. Clean animated bar chart visualizing rising and falling market trends with green bars representing growth, profit, and positive performance, and red bars indicating decline, loss, and negative movement. Symbolizes financial volatility, stock market cycles, economic fluctuations, investment performance, and business analytics. Ideal for illustrating bullish and bearish phases, economic indicators, trading activity, and financial data visualization.
Free with trial 3D Isometric Flat Vector Illustration of Cost Cutting And Efficiency, Price Management. Increase decrease graph vectors 3D Isometric Flat Vector Illustration of Cost Cutting And Efficiency
Free with trial A wooden block tower with a red arrow pointing upwards and the numbers 1, 2, 3, 4, 5, 6, 7, 8, 9, 10 generated by AI. Increase decrease graph vectors A wooden block tower with a red arrow pointing upwards and the numbers 1, 2, 3 generated by AI. A wooden block tower with a red arrow pointing upwards and the numbers 1, 2, 3, 4, 5, 6, 7, 8, 9, 10 generated by AI
Free with trial Problem of bankruptcy for girl lost savings due to financial crisis, sitting near falling economic chart. Girl is bankruptcy fighter after being fired from job and losing investments. Increase decrease graph vectors Problem of bankruptcy for girl lost savings due to financial crisis, sitting near falling chart. Problem of bankruptcy for girl lost savings due to financial crisis, sitting near falling economic chart. Girl is bankruptcy fighter after being fired from job and losing investments.
Free with trial A stack of wooden blocks with a wooden arrow pointing upwards. The blocks are arranged in a pyramid shape, with the top block being the smallest and the bottom block being the largest generated by AI. Increase decrease graph vectors A stack of wooden blocks with a wooden arrow pointing upwards generated by AI. A stack of wooden blocks with a wooden arrow pointing upwards. The blocks are arranged in a pyramid shape, with the top block being the smallest and the bottom block being the largest generated by AI
Free with trial Calculator, coin, dollar sign, green arrows, up, down. Increase decrease graph vectors Calculator, coin, dollar sign
Free with trial Discount card line icons set. Marketing and advertising on Internet. Promotions and special offer, loyalty program. Gift and cashback. Cartoon flat vector illustrations isolated on white background. Increase decrease graph vectors Discount card line icons set
Free with trial A chart displaying data trends on a white background. 3D Rendering. Increase decrease graph illustrations Graphical representation of data trends. 3D Rendering. A chart displaying data trends on a white background. 3D Rendering
Free with trial Decline food sales data illustration fruits vegetables, items year, trend analysis decline food sales data. Increase decrease graph illustrations Decline food sales data
Free with trial Business Decline - Recession - Icon 10 File. Increase decrease graph illustrations Business Decline - Recession - Icon
Free with trial Analysis shifting line chart illustration visualization movement, axis series, dynamic fluctuation analysis shifting line chart. Increase decrease graph illustrations Analysis shifting line chart
Free with trial Infochart, Block diagram and Algorithm. Charts and graphs line icons. Presentation linear icon set Line icons set. Vector. Increase decrease graph illustrations Charts and graphs line icons. Infochart, Block diagram and Algorithm. Linear icon set. Line icons. Vector. Infochart, Block diagram and Algorithm. Charts and graphs line icons. Presentation linear icon set Line icons set. Vector
Free with trial Up and down arrow line icon vector in simple style. Increase decrease graph vectors Up and down arrow line icon in simple style
Free with trial Company graphs data illustration time valleys, volatility market, background trend company graphs data. Increase decrease graph illustrations Company graphs data
Free with trial 3D Isometric Flat Vector Illustration of Cost Reduction , Business Finance Crisis. Increase decrease graph vectors 3D Isometric Flat Vector Illustration of Cost Reduction
Free with trial Cost optimization concept. Idea of financial and marketing strategy. Cost and income balance. Spending and cost reduction, while maximizing business value. flat vector modern illustration. Increase decrease graph vectors Cost optimization concept. Idea of financial and marketing strategy. Cost and income balance.
Free with trial Up and down arrow line icon set on black circle. Upward and downward concept. Increase decrease graph vectors Up and down arrow line icon set on black circle
Free with trial A person analyzing stock market charts with a pointer. Vector art design using ai tool. Increase decrease graph vectors Stock Market Illustration Charts. A person analyzing stock market charts with a pointer. Vector art design using ai tool.
Free with trial Uptrend and downtrend arrow vector icon. Increase decrease graph illustrations Uptrend and downtrend arrow vector icon
Free with trial A 3D rendered illustration depicting business growth. The image showcases two upward-trending arrow charts, one in gold and the other in blue, representing positive trends, progress, and success. The charts are set against a clean, light background, emphasizing the upward movement and potential for financial gain. Suitable for illustrating economic growth, investment strategies, and business performance. Increase decrease graph illustrations Growth Chart with Arrows. A 3D rendered illustration depicting business growth. The image showcases two upward-trending arrow charts, one in gold and the other in blue, representing positive trends, progress, and success. The charts are set against a clean, light background, emphasizing the upward movement and potential for financial gain. Suitable for illustrating economic growth, investment strategies, and business performance.
Free with trial High-Quality Vector Icons. Increase decrease graph vectors Rise icon vector, filled. High-Quality Vector Icons
Free with trial A vibrant green upward trending arrow signifies growth, progress, and positive development. The arrow's design is visually appealing and represents a successful trajectory. The dark background emphasizes the upward movement. Increase decrease graph illustrations Green Arrow Growth Chart. A vibrant green upward trending arrow signifies growth, progress, and positive development. The arrow's design is visually appealing and represents a successful trajectory. The dark background emphasizes the upward movement.
Free with trial Up, down, left, and right arrow icon vector in generic style. Increase decrease graph vectors Up, down, left, and right arrow icon in generic style
Free with trial Up down arrow line icon vector on black square. Increase decrease graph vectors Up down arrow line icon on black square. Up down arrow line icon vector on black square
Free with trial A simple graphic illustration of a bar chart. The chart features four bars of varying heights, indicating growth or progress. The design is clean and minimalist, making it suitable for a wide range of applications such as presentations, reports, and infographics. The black bars stand out against the white background, providing a clear visual representation of data. Increase decrease graph illustrations Bar Chart Icon. A simple graphic illustration of a bar chart. The chart features four bars of varying heights, indicating growth or progress. The design is clean and minimalist, making it suitable for a wide range of applications such as presentations, reports, and infographics. The black bars stand out against the white background, providing a clear visual representation of data.
Free with trial A visual representation of data, showcasing trends and comparisons through a green bar chart. This graphic illustrates statistical information and growth patterns effectively. Increase decrease graph illustrations Bar chart data analysis on. A visual representation of data, showcasing trends and comparisons through a green bar chart. This graphic illustrates statistical information and growth patterns effectively
Free with trial Hand of businessman point to the screen show financial market chart graphic. Stock market concept. By generative Ai. Increase decrease graph illustrations Hand of businessman point to the screen show financial market chart graphic. By generative Ai. Hand of businessman point to the screen show financial market chart graphic. Stock market concept. By generative Ai
Free with trial A graphic illustration featuring two distinct charts on a white background. The upper chart displays three descending lines in black, red, and green, each ending with a downward-pointing arrow. Below this, a bar chart shows three black bars of increasing height, with arrows pointing upwards from the tallest bars. A stylized black graphic element resembling diverging paths or a funnel is positioned. Increase decrease graph vectors Downward and upward trending graphs with arrows chart. A graphic illustration featuring two distinct charts on a white background. The upper chart displays three descending lines in black, red, and green, each ending with a downward-pointing arrow. Below this, a bar chart shows three black bars of increasing height, with arrows pointing upwards from the tallest bars. A stylized black graphic element resembling diverging paths or a funnel is positioned
Free with trial Profit growth icon logo sign vector outline in black and white color. Increase decrease graph vectors Profit growth icon logo set vector. profit growth icon logo sign vector outline in black and white color
Free with trial Image of a stock market chart with a red and blue candlestick pattern, plotted on a dark grid, suggesting financial trends and investment analysis. Image is generated using AI. Increase decrease graph illustrations Stock Market Chart on a Grid. Image of a stock market chart with a red and blue candlestick pattern, plotted on a dark grid, suggesting financial trends and investment analysis. Image is generated using AI
Free with trial Arrow up and down vector. Increase decrease graph vectors Arrow up and down icon vector. Arrow up and down vector
Free with trial A collection of solid icons depicting coin stacks and growth charts, presented isolated on a clean white background. Increase decrease graph vectors Rising coin wealth solid icons. A collection of solid icons depicting coin stacks and growth charts, presented isolated on a clean white background
Free with trial This image showcases a dynamic data visualization, generated by AI, depicting a flowing wave pattern over a gridded background. The abstract design uses cool blue tones and suggests growth, movement, or change in data trends. The wave's form is both aesthetically pleasing and symbolic of complex in. Increase decrease graph illustrations Abstract Data Wave. This image showcases a dynamic data visualization, generated by AI, depicting a flowing wave pattern over a gridded background. The abstract design uses cool blue tones and suggests growth, movement, or change in data trends. The wave's form is both aesthetically pleasing and symbolic of complex in
Free with trial Flipping of wooden blocks with arrow up and down. Business planning for target achievement. Measure of performance for a specific objective. 3d render. Increase decrease graph illustrations Flipping of wooden blocks with arrow up and down
Free with trial Flipping of wooden blocks with arrow up and down. Business planning for target achievement. Measure of performance for a specific objective. 3d render. Increase decrease graph illustrations Flipping of wooden blocks with arrow up and down
Free with trial Up vs down balance on economic scale. Balance on scale. Business Concept. Vector stock illustration. Increase decrease graph vectors Up vs down balance on economic scale
Free with trial Close-up of a smartphone displaying a stock trading application. The screen shows real-time stock charts, including candlestick charts and line graphs, with green and red indicators representing price increases and decreases. The app also features portfolio summaries and details for various stocks, such as AAPL, GOOG, and MSFT. The image represents investment, finance, and the use of technology in stock market analysis. Increase decrease graph illustrations Stock Trading App on Smartphone. Close-up of a smartphone displaying a stock trading application. The screen shows real-time stock charts, including candlestick charts and line graphs, with green and red indicators representing price increases and decreases. The app also features portfolio summaries and details for various stocks, such as AAPL, GOOG, and MSFT. The image represents investment, finance, and the use of technology in stock market analysis.
Free with trial A 3D bar chart illustrating financial data with green bars indicating growth and red bars indicating decline, presented in a clean visual format for analysis. Increase decrease graph illustrations Bar chart growth and decline on. A 3D bar chart illustrating financial data with green bars indicating growth and red bars indicating decline, presented in a clean visual format for analysis
Free with trial Simple lineart icon of an eye looking at a bar chart, representing market analysis. Increase decrease graph vectors Human eye monitoring business bar chart icon. Simple lineart icon of an eye looking at a bar chart, representing market analysis
Free with trial A minimalist, flat design illustration of a bar chart featuring three vertical bars of varying heights. The bars are colored in orange, teal, and a lighter orange, set against a clean white background. This graphic represents data visualization, trends, and comparisons, suitable for business reports, educational materials, or web design elements. Increase decrease graph illustrations Simple Bar Chart with Three Bars. A minimalist, flat design illustration of a bar chart featuring three vertical bars of varying heights. The bars are colored in orange, teal, and a lighter orange, set against a clean white background. This graphic represents data visualization, trends, and comparisons, suitable for business reports, educational materials, or web design elements.
Free with trial Production Down Icon sing symbol. Increase decrease graph vectors Production Down Icon
Free with trial A businessman in a suit interacts with a digital interface illustrating the relationship between quality and cost. The image features a visual representation of increasing quality and decreasing cost, with checkmarks indicating positive outcomes. This concept is ideal for illustrating business strategies, efficiency, and financial planning. The scene includes a clipboard with charts, adding a professional context. Increase decrease graph illustrations Quality vs. Cost: Business Concept. A businessman in a suit interacts with a digital interface illustrating the relationship between quality and cost. The image features a visual representation of increasing quality and decreasing cost, with checkmarks indicating positive outcomes. This concept is ideal for illustrating business strategies, efficiency, and financial planning. The scene includes a clipboard with charts, adding a professional context.