Free with trial Growth and decline chart. Market trend analysis. Vector illustration. EPS 10. Stock image. Increase decrease graph vectors Growth and decline chart. Market trend analysis. Vector illustration. EPS 10.
Free with trial Percent arrow up and down icon vector on black circle. Growth and decline percentage arrows sign symbol. Increase decrease graph vectors Percent arrow up and down icon on black circle. Growth and decline percentage arrows sign symbol
Free with trial Colorful bar chart on a blue background illustrating data trends ,Generative ai. Increase decrease graph illustrations Vibrant bar chart on blue background, visualizing data trends and insights colorful. Colorful bar chart on a blue background illustrating data trends ,Generative ai
Free with trial Upward and downward arrow icon set on black circle. Up and down direction sign symbol illustration. Increase decrease graph vectors Upward and downward arrow icon set on black circle. Up and down direction sign symbol
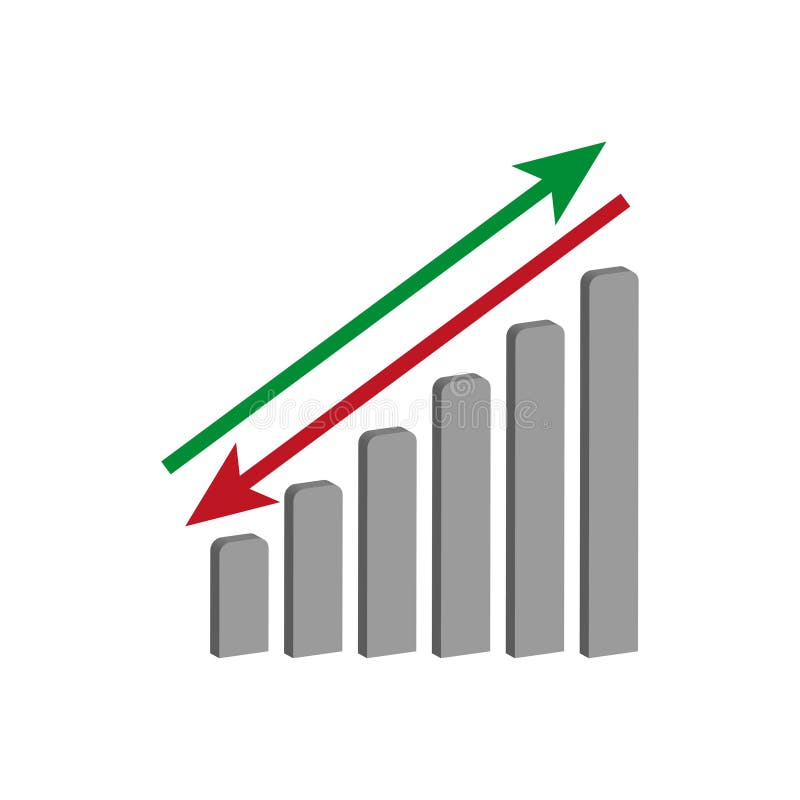
Free with trial A 3D bar chart with red and green bars representing financial data trends, isolated on white background. Increase decrease graph illustrations 3d bar chart showing financial data trends isolated on white background. A 3D bar chart with red and green bars representing financial data trends, isolated on white background
Free with trial Interest growth icon Black line art vector in black and white outline set collection sign. Increase decrease graph vectors Financial Icon Illustrating Growth, Investment Success, and Economic Prosperity. Interest growth icon Black line art vector in black and white outline set collection sign
Free with trial Simple up and down arrow line icon on black circle. Upward and downward sign symbol vector in rounded corner. Increase decrease graph vectors Simple up and down arrow line icon on black circle. Upward and downward sign symbol in rounded corner
Free with trial Real estate market crash and housing crisis in Spain concept with glowing house and arrows going down. Increase decrease graph illustrations Real estate market crash and housing crisis in Spain concept with glowing house and arrows going down
Free with trial Detailed 3D rendering of colorful bar charts, pie charts, line graphs, and calculator showcasing financial data analysis and business growth. Increase decrease graph illustrations Colorful 3D Business Charts, Graphs, and Calculator for Financial Success. Detailed 3D rendering of colorful bar charts, pie charts, line graphs, and calculator showcasing financial data analysis and business growth.
Free with trial A close-up shot of a laptop screen displaying a business analytics dashboard. The screen showcases various charts and graphs, including bar graphs, line graphs, and pie charts, illustrating data related to revenue, sales performance, customer growth, and market share. The data visualizations are presented in a clean, modern design with a dark background, highlighting the key performance indicators (KPIs) and trends. This image is suitable for illustrating concepts of data analysis, business intelligence, financial reporting, and technology. Increase decrease graph illustrations Business Analytics Dashboard on Laptop Screen. A close-up shot of a laptop screen displaying a business analytics dashboard. The screen showcases various charts and graphs, including bar graphs, line graphs, and pie charts, illustrating data related to revenue, sales performance, customer growth, and market share. The data visualizations are presented in a clean, modern design with a dark background, highlighting the key performance indicators (KPIs) and trends. This image is suitable for illustrating concepts of data analysis, business intelligence, financial reporting, and technology.
Free with trial Two lines illustrate a contrasting trend, one declining and the other rising, blending harmoniously in shades of orange, evoking a sense of change. Increase decrease graph illustrations Dynamic Trends Showcased Through Contrasting Lines in Warm Hues of Orange. Two lines illustrate a contrasting trend, one declining and the other rising, blending harmoniously in shades of orange, evoking a sense of change
Free with trial Up and down arrow icon set on black circle. Upward and downward illustration. Increase decrease graph vectors Up and down arrow icon set on black circle
Free with trial A collection of modern, minimalist icons related to business, finance, and data analysis. The icons feature upward and downward trends, graphs, arrows, checkmarks, targets, and warning signs. The color scheme is primarily black and green, creating a clean and professional look. Ideal for presentations, websites, infographics, and marketing materials. Increase decrease graph vectors Set of Business and Finance Icons. A collection of modern, minimalist icons related to business, finance, and data analysis. The icons feature upward and downward trends, graphs, arrows, checkmarks, targets, and warning signs. The color scheme is primarily black and green, creating a clean and professional look. Ideal for presentations, websites, infographics, and marketing materials.
Free with trial A set of black glyph icons representing business, finance, and economic concepts on a white background. Increase decrease graph vectors Collection of black business and finance icons on a white background design. a set of black glyph icons representing business, finance, and economic concepts on a white background
Free with trial Incorporating advanced technology to visually illustrate stock market patterns and conduct data analysis. Increase decrease graph illustrations Take advantage of cuttingedge technology trends for advanced analysis of the market. Incorporating advanced technology to visually illustrate stock market patterns and conduct data analysis
Free with trial Upward rightward, downward leftward, upward leftward, and downward rightward icon vector on black circle. Increase decrease graph vectors Upward rightward, downward leftward, upward leftward, and downward rightward icon on black circle
Free with trial Abstract vector illustration of colorful bar graphs for business analysis and trends. Increase decrease graph vectors Multiple colorful bar charts abstractly representing data and statistics. Abstract vector illustration of colorful bar graphs for business analysis and trends.
Free with trial Simple bar chart graphic with rising and falling columns of varying heights. Increase decrease graph vectors Simple bar chart graphic with rising and falling columns of varying heights
Free with trial This 3D rendering shows vibrant bar and pie charts illustrating business growth, data analysis, and statistical visualization. Perfect for presentations, reports, or marketing materials. Increase decrease graph illustrations Colorful 3D Bar and Pie Charts Representing Business Growth and Data Analysis. This 3D rendering shows vibrant bar and pie charts illustrating business growth, data analysis, and statistical visualization. Perfect for presentations, reports, or marketing materials.
Free with trial A set of simple outline icons related to financial and investment themes, featuring dollar signs and clean, minimalistic designs. Increase decrease graph vectors Simple Outline Financial and Investment Icons Symbol Set with Dollar Sign. A set of simple outline icons related to financial and investment themes, featuring dollar signs and clean, minimalistic designs.
Free with trial Hand interacts with glowing line graphs and percentage symbols. Increase decrease graph illustrations Hand interacts with glowing line graphs and percentage symbols
Free with trial Hand interacts with glowing line graphs and percentage symbols. Increase decrease graph illustrations Hand interacts with glowing line graphs and percentage symbols
Free with trial Dollar arrow down and up outline icon on black circle. USD currency arrows decline and growth sign symbol vector. Increase decrease graph vectors Dollar arrow down and up outline icon on black circle. USD currency arrows decline and growth sign symbol
Free with trial Percent growth and decline icon in rounded corner. Percentage arrow up and down sign symbol vector. Increase decrease graph vectors Percent growth and decline icon in rounded corner. Percentage arrow up and down sign symbol
Free with trial Line chart illustrating an upward trend, featuring candlestick patterns and glowing dots against a dark background. The arrangement indicates a positive movement in data, reflecting investment and financial growth. Blue and orange tones highlight data points and lines, providing a visual contrast that enhances readability. The abstract style conveys a modern financial theme, emphasizing success and progress in stock markets. Increase decrease graph illustrations Dynamic stock market chart showing upward trend for investment and financial growth success concept. Line chart illustrating an upward trend, featuring candlestick patterns and glowing dots against a dark background. The arrangement indicates a positive movement in data, reflecting investment and financial growth. Blue and orange tones highlight data points and lines, providing a visual contrast that enhances readability. The abstract style conveys a modern financial theme, emphasizing success and progress in stock markets.
Free with trial Percent arrow up and down outline icon vector on black circle. Percentage growth and decline arrows sign symbol. Increase decrease graph vectors Percent arrow up and down outline icon on black circle. Percentage growth and decline arrows sign symbol
Free with trial Dollar up and down arrow icon vector. USD growth and decline sign symbol. Increase decrease graph vectors Dollar up and down arrow icon. USD growth and decline sign symbol
Free with trial Teal bar chart illustration for data visualization and statistical analysis. Increase decrease graph vectors Teal bar chart illustration for data visualization and statistical analysis
Free with trial Vector icons showing business growth and decline trends with arrows and magnifying glass for detailed analysis, representing financial and market data in a clear style. Professional and informative. Generative AI. Increase decrease graph vectors Business growth and decline infographic icons with arrows and magnifying glass for analysis. Vector icons showing business growth and decline trends with arrows. Vector icons showing business growth and decline trends with arrows and magnifying glass for detailed analysis, representing financial and market data in a clear style. Professional and informative. Generative AI
Free with trial Uptrend and downtrend arrow line icon in generic style. Rising and falling arrows illustration concept. Increase decrease graph vectors Uptrend and downtrend arrow line icon in generic style. Rising and falling arrows concept
Free with trial Colorful isometric bar chart showing business data and growth with bars of different height, colored blue, yellow and green. Isolated on a transparent background, perfect for business presentations or infographics. Increase decrease graph vectors Colorful business chart illustration on transparent background AI Generated. Colorful isometric bar chart showing business data and growth with bars of different height, colored blue, yellow and green. Isolated on a transparent background, perfect for business presentations or infographics.
Free with trial A grid of 16 black and white icons representing financial growth, currency, and directional arrows, isolated on a transparent background. Increase decrease graph vectors Collection of financial and growth icons isolated on transparent background. A grid of 16 black and white icons representing financial growth, currency, and directional arrows, isolated on a transparent background
Free with trial Area chart illustrating trends in Sareorplojicam and S�snpavai across years. Shows variations over time. Increase decrease graph illustrations . Area chart illustrating trends in Sareorplojicam and S�snpavai across years. Shows variations over time
Free with trial Up and down direction arrow icon on black circle. Upward and downward illustration concept. Increase decrease graph vectors Up and down direction arrow icon on black circle. Upward and downward concept
Free with trial Red arrow icon. up, down, right and left sign arrow icon. directional navigation symbol. upload sign. download symbol design. Increase decrease graph vectors Red arrow icon. up, down, right and left sign arrow icon. directional navigation symbol. upload sign. download symbol
Free with trial Uptrend and downtrend business chart icon. Economic growth and decline symbol with green up and red down arrow vector. Increase decrease graph vectors Uptrend and downtrend business chart icon. Economic growth and decline symbol with green up and red down arrow
Free with trial Stock market chart displaying investment trends with red and blue candlesticks on a dark background. The chart features a timeline labeled by months at the top and numbers at the bottom, illustrating dynamic financial data. Candlesticks show market fluctuations, with red indicating a decrease and blue an increase in value. A faint blue line overlays the candles, representing the moving average. The scene is likely within a financial or trading setting, emphasizing the analysis of market activity. Increase decrease graph illustrations Dynamic stock market chart with vibrant red and blue candles showing investment trends and financial data. Stock market chart displaying investment trends with red and blue candlesticks on a dark background. The chart features a timeline labeled by months at the top and numbers at the bottom, illustrating dynamic financial data. Candlesticks show market fluctuations, with red indicating a decrease and blue an increase in value. A faint blue line overlays the candles, representing the moving average. The scene is likely within a financial or trading setting, emphasizing the analysis of market activity.
Free with trial Candlestick chart with buy and sell signals over digital world map and city skyline on dark background, symbolizing global market and forex trading. Increase decrease graph illustrations Global financial chart with buy and sell indicators over world map and cityscape background, illustrating stock market and forex. Candlestick chart with buy and sell signals over digital world map and city skyline on dark background, symbolizing global market and forex trading
Free with trial Hand drawn bar chart illustration showing data statistics and business growth. Increase decrease graph vectors Hand drawn bar chart illustration showing data statistics and business growth
Free with trial Concept of high interest rates and heavy loan payments, economic recession, risk of debt burden. Vector illustration. Increase decrease graph vectors Concept of high interest rates and heavy loan payments, economic recession, risk of debt burden.
Free with trial This 3D render shows a calculator with a colorful bar chart made of cubes illustrating growth and success in business and finance. Perfect for presentations and infographics. Increase decrease graph illustrations Colorful 3D Calculator with Growing Bar Chart Cubes for Business and Finance. This 3D render shows a calculator with a colorful bar chart made of cubes illustrating growth and success in business and finance. Perfect for presentations and infographics.
Free with trial Two distinct lines illustrate contrasting trends, one rising and the other falling. The gradient colors blend harmoniously, enhancing the visual impact. Increase decrease graph illustrations Analysis of Fluctuating Trends in a Colorful Gradient Landscape Representation. Two distinct lines illustrate contrasting trends, one rising and the other falling. The gradient colors blend harmoniously, enhancing the visual impact
Free with trial Circular buttons labeled "BUY" and "SELL" sit on a surface with a glowing stock market chart in the background. The chart features fluctuating orange lines on a dark grid, illustrating price movements and market volatility. The buttons are shiny and metallic, with embossed text, suggesting a dynamic financial environment. The composition emphasizes themes of trading and investment in the stock market. Increase decrease graph illustrations Buy and sell buttons with stock market chart in background, financial concept. Circular buttons labeled "BUY" and "SELL" sit on a surface with a glowing stock market chart in the background. The chart features fluctuating orange lines on a dark grid, illustrating price movements and market volatility. The buttons are shiny and metallic, with embossed text, suggesting a dynamic financial environment. The composition emphasizes themes of trading and investment in the stock market.
Free with trial Revenue Decline line icon. Universal creative premium symbol. Vector sign icon logo template. Vector illustration. Increase decrease graph vectors Revenue Decline line icon. Universal creative premium symbol. Vector sign icon logo template. Vector illustration
Free with trial Loan line icons. Social media: share, comment, like icons. Set of Interest rate, Investment and Percentage diagram linear icons. Car leasing, analytics plan, Credit card percent and loan rate. Vector. Increase decrease graph vectors Loan line icons. Set of Investment, Interest rate and Percentage diagram icons. Social media icons. Vector. Loan line icons. Social media: share, comment, like icons. Set of Interest rate, Investment and Percentage diagram linear icons. Car leasing, analytics plan, Credit card percent and loan rate. Vector
Free with trial Hand drawn bar chart sketch with ascending and descending data patterns. Increase decrease graph vectors Hand drawn bar chart sketch with ascending and descending data patterns, AI Generative. Hand drawn bar chart sketch with ascending and descending data patterns.
Free with trial Money movement icon. Dollar coin arrows. Financial flow Vector. Market trend symbol. EPS 10. Increase decrease graph vectors Money movement icon. Dollar coin arrows. Financial flow Vector. Market trend symbol.
Free with trial Modern abstract blue bars illustrating business statistics, trends, and analytics. Increase decrease graph vectors Digital data analysis bars in blue hues, conceptualizing statistics and trends. Modern abstract blue bars illustrating business statistics, trends, and analytics.
Free with trial Yellow glossy arrow pointing right. Isolated on white background. Direction guide. Close-up. Increase decrease graph illustrations Yellow glossy arrow pointing right. Isolated on white background. Direction guide
Free with trial Black metal barrels on stacks of US 100 dollar bills on a blue background. Increase decrease graph illustrations Illustration of the concept of crude oil prices and revenue of the petroleum refinery industry. Black metal barrels on stacks of US 100 dollar bills on a blue background
Free with trial Cost reduction with tiny people concept. Cost reduction management. Businessman cutting cost. set flat vector modern illustration. Increase decrease graph vectors Cost reduction with tiny people concept. Cost reduction management. Businessman cutting cost.
Free with trial Cost reduction with tiny people concept. Cost reduction management. Businessman cutting cost. set flat vector modern illustration. Increase decrease graph vectors Cost reduction with tiny people concept. Cost reduction management. Businessman cutting cost.
Free with trial Up and Down sign with green and red arrows set vector illustration. Set of a Concept of sales bar chart symbol icon with arrow moving down and sales bar chart with arrow moving up. Increase decrease graph vectors Up and Down sign with green and red arrows set vector illustration. Set of a Concept of sales bar chart symbol icon with arrows. Up and Down sign with green and red arrows set vector illustration. Set of a Concept of sales bar chart symbol icon with arrow moving down and sales bar chart with arrow moving up.
Free with trial A versatile collection of nine black outline icons on a white background, representing key concepts in business, communication, and user management. Icons include user profiles, groups, growth and decline charts, user search, audio, ratings, target goals, and microphone recording. Ideal for UI UX design, presentations, web applications, and marketing materials, offering a modern and minimalist aesthetic for various digital and print projects. Increase decrease graph vectors Business and Communication Line Icons Set. A versatile collection of nine black outline icons on a white background, representing key concepts in business, communication, and user management. Icons include user profiles, groups, growth and decline charts, user search, audio, ratings, target goals, and microphone recording. Ideal for UI UX design, presentations, web applications, and marketing materials, offering a modern and minimalist aesthetic for various digital and print projects.
Free with trial Digital globe with rising and falling stock market trends, represented by red and blue lines, symbolizing global financial fluctuations and economic uncertainty in a high-tech, futuristic style. Increase decrease graph illustrations Global Market Fluctuations: A Digital Earth with Rising and Falling Stock Trends. Digital globe with rising and falling stock market trends, represented by red and blue lines, symbolizing global financial fluctuations and economic uncertainty in a high-tech, futuristic style
Free with trial Set of Investment, Interest rate and Percentage diagram linear icons. Design shape elements. Loan line icons. Car leasing, analytics plan, Credit card percent and loan rate. Vector. Increase decrease graph vectors Loan line icons. Set of Investment, Interest rate and Percentage diagram icons. Design elements. Vector. Set of Investment, Interest rate and Percentage diagram linear icons. Design shape elements. Loan line icons. Car leasing, analytics plan, Credit card percent and loan rate. Vector
Free with trial Up and down arrow icon on black circle. Upward and downward sign symbol vector. Increase decrease graph vectors Up and down arrow icon on black circle. Upward and downward sign symbol
Free with trial Candlestick chart on a dark blue background illustrating stock market trends. Light blue and white candlesticks represent price fluctuations, with wicks indicating high and low values. The chart shows an upward trend, suggesting potential financial growth or investment opportunities. Candlestick charts are commonly used in financial analysis to depict market movements, assisting in forecasting stock behaviors for strategic decision-making. Increase decrease graph illustrations Rising stock market analysis chart for smart investment decisions and financial growth in modern business. Candlestick chart on a dark blue background illustrating stock market trends. Light blue and white candlesticks represent price fluctuations, with wicks indicating high and low values. The chart shows an upward trend, suggesting potential financial growth or investment opportunities. Candlestick charts are commonly used in financial analysis to depict market movements, assisting in forecasting stock behaviors for strategic decision-making.
Free with trial Car Loan icon Flat set in black and white color outline vector. Increase decrease graph vectors Car Loan Icon for Auto Financing, Vehicle Purchase, and Financial Services Illustrations. Car Loan icon Flat set in black and white color outline vector
Free with trial A close-up, shallow depth of field shot of a digital stock market ticker board. The screen displays rows of stock symbols and their corresponding prices in bright red and green LED lights against a dark background. Some numbers are in green, indicating gains, while others are in red, signifying losses or negative trends. The bokeh effect from out-of-focus lights adds a dynamic and professional feel, perfect for illustrating financial concepts. Increase decrease graph illustrations Stock Market Ticker Display with Red and Green Numbers. A close-up, shallow depth of field shot of a digital stock market ticker board. The screen displays rows of stock symbols and their corresponding prices in bright red and green LED lights against a dark background. Some numbers are in green, indicating gains, while others are in red, signifying losses or negative trends. The bokeh effect from out-of-focus lights adds a dynamic and professional feel, perfect for illustrating financial concepts.
Free with trial Person displays wooden block featuring a chart, emphasizing data visualization ,Generative ai. Increase decrease graph illustrations Wooden block chart display, data visualization for business analysis and strategic planning. Person displays wooden block featuring a chart, emphasizing data visualization ,Generative ai
Free with trial Up and down arrow icon in rounded corner. Upward and downward sign symbol vector. Increase decrease graph vectors Up and down arrow icon in rounded corner. Upward and downward sign symbol
Free with trial A red arrow is pointing upward, with wooden blocks stacked below it. Concept of progress and growth, as the arrow rises and the blocks below it grow in size generated by AI. Increase decrease graph vectors A red arrow is pointing upward, with wooden blocks stacked below it generated by AI. A red arrow is pointing upward, with wooden blocks stacked below it. Concept of progress and growth, as the arrow rises and the blocks below it grow in size generated by AI
Free with trial A pair of striking red arrows, one indicating upward movement and the other downward, presented in a clean 3D render on a white background, symbolizing change and direction. Increase decrease graph illustrations Two red arrows, one pointing up and one pointing down, isolated on white background. A pair of striking red arrows, one indicating upward movement and the other downward, presented in a clean 3D render on a white background, symbolizing change and direction
Free with trial Up and down arrow icon in rounded corner. Upward and downward sign symbol vector. Increase decrease graph vectors Up and down arrow icon in rounded corner. Upward and downward sign symbol
Free with trial Uptrend and downtrend arrow icon on black circle. Rising and falling arrows illustration concept. Increase decrease graph vectors Uptrend and downtrend arrow icon on black circle. Rising and falling arrows concept
Free with trial Percent arrow up and down outline icon vector. Percentage growth and decline arrows sign symbol. Increase decrease graph vectors Percent arrow up and down outline icon. Percentage growth and decline arrows sign symbol
Free with trial Arrow percent icon on black circle. Up and down percentage sign symbol vector. Increase decrease graph vectors Arrow percent icon on black circle. Up and down percentage sign symbol
Free with trial This image captures the concept of business growth and the importance of cost reduction The image features a person working on a laptop and a tablet with digital arrows indicating profit increasing and cost decreasing It emphasizes the need to balance both factors to achieve overall success in business. Increase decrease graph illustrations Business growth and cost reduction concept with technology application illustration. This image captures the concept of business growth and the importance of cost reduction The image features a person working on a laptop and a tablet with digital arrows indicating profit increasing and cost decreasing It emphasizes the need to balance both factors to achieve overall success in business
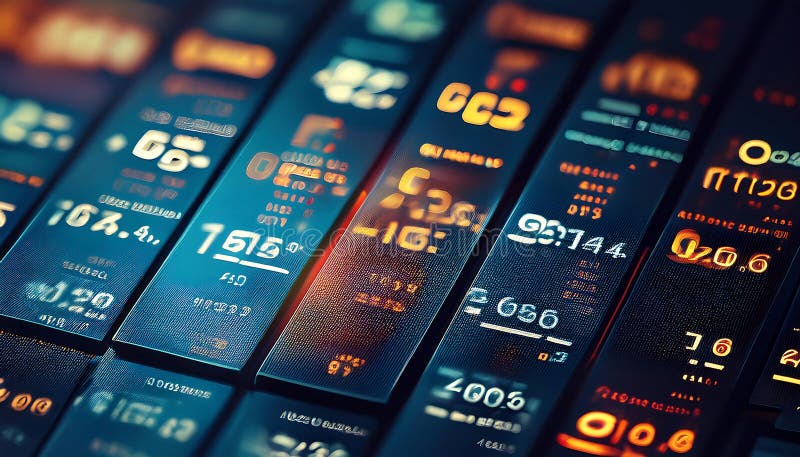
Free with trial Meta tags with sample numbers for stock market. Increase decrease graph illustrations Meta tags with sample numbers for stock market
Free with trial Meta tags with sample numbers for stock market. Increase decrease graph illustrations Meta tags with sample numbers for stock market
Free with trial Meta tags with sample numbers for stock market. Increase decrease graph illustrations Meta tags with sample numbers for stock market
Free with trial Meta tags with sample numbers for stock market. Increase decrease graph illustrations Meta tags with sample numbers for stock market
Free with trial Colorful bar chart on a blue background showing data analysis and statistical growth. Generative AI. Increase decrease graph illustrations Colorful bar chart on a blue background showing data analysis and statistical growth
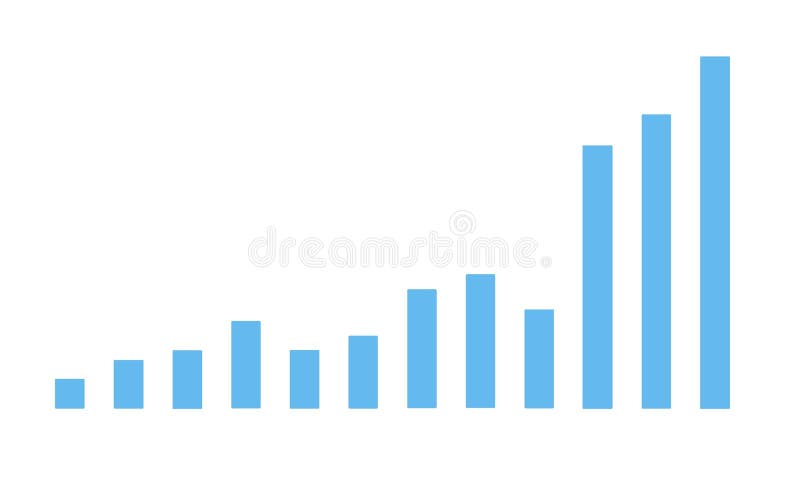
Free with trial Simple Blue Analytics Diagram Bar Chart Showing Variable Data Trends on White Background � Simple Abstract Business and Analytics Infographic Illustration. Increase decrease graph illustrations Simple Blue Analytics Diagram Bar Chart Showing Variable Data Trends on White Background
Free with trial Happy and sad businessman from rising and falling chart. Business success and failure infographic. Man sitting at computer table. Office manager. Startup project growth. Stock exchange. Vector concept. Increase decrease graph vectors Happy and sad businessman from rising and falling chart. Business success and failure infographic. Man sitting at computer table
Free with trial Up and down arrow direction icon set in generic style. Upward and downward sign symbol illustration. Increase decrease graph vectors Up and down arrow direction icon set in generic style. Upward and downward sign symbol
Free with trial Rising thick red arrow filling grid lines in design studio, with blue pink charts, dotted bars. Financial, analytics, data, visualization, digital, technology, infographic. Increase decrease graph illustrations Rising thick red arrow filling grid lines in design studio, with blue pink charts, dotted bars
Free with trial Digital financial ticker display is showing real‑time market data with arrows in flat design. Finance, technology, analytics, data, stock, investment, digital. Increase decrease graph illustrations Digital financial ticker display is showing real?time market data with arrows in flat design. Digital financial ticker display is showing real‑time market data with arrows in flat design. Finance, technology, analytics, data, stock, investment, digital
Free with trial 3D Pie chart icon. Circle divided into parts statistical diagram vector illustration. 3D render. Increase decrease graph vectors 3D Pie chart icon circle divided into parts statistical diagram vector illustration. 3D render.