Free with trial Elevate your marketing efforts with this eye-catching 10% discount sale banner. Perfect for online and offline promotions, this left-aligned design boasts a clean, modern aesthetic. Vibrant colors and impactful typography create a visually engaging experience, grabbing attention and encouraging immediate action. The generous copy space allows for easy customization with your unique brand. Increase decrease graph illustrations Drive Sales with a Modern 10 Discount Sale Banner Minimalist Design for Maximum Impact. Elevate your marketing efforts with this eye-catching 10% discount sale banner. Perfect for online and offline promotions, this left-aligned design boasts a clean, modern aesthetic. Vibrant colors and impactful typography create a visually engaging experience, grabbing attention and encouraging immediate action. The generous copy space allows for easy customization with your unique brand
Free with trial Percentage sign icon, related to accounting, ideal for financial, tax, or business-related designs. Increase decrease graph vectors Professional Percentage Sign Icon for Accounting Purposes. Percentage sign icon, related to accounting, ideal for financial, tax, or business-related designs.
Free with trial Red cube with arrow up. Business and market growth concept. Close-up. Increase decrease graph illustrations Red cube with arrow up. Business and market growth concept
Free with trial Abstract colorful bar charts display statistical data and financial trend analysis. Increase decrease graph vectors Colorful abstract bar charts representing data analysis and statistical visualization. Abstract colorful bar charts display statistical data and financial trend analysis.
Free with trial 3D infographics analyze trade deficits? impact on imports, exports, and economy. Increase decrease graph illustrations Analyzing economic effects of trade deficits with 3D infographics on imports and exports. 3D infographics analyze trade deficits? impact on imports, exports, and economy
Free with trial A 3D pie chart with three colored segments (pink, blue, and teal) is shown against a solid purple background. A yellow circle with a white upward arrow is positioned to the left of the chart, and a pink circle with a white downward arrow is to the right. Increase decrease graph illustrations 3D Pie Chart With Up and Down Arrows Indicating Growth and Decline on a Purple Background. A 3D pie chart with three colored segments (pink, blue, and teal) is shown against a solid purple background. A yellow circle with a white upward arrow is positioned to the left of the chart, and a pink circle with a white downward arrow is to the right
Free with trial Up and down sign arrow icon set. Directional Navigation Symbol. Upward, downward arrows in isolated on white background. Increase decrease graph vectors Up and down sign arrow icon set. Directional Navigation Symbol. Upward, downward arrows in isolated on white background
Free with trial Close-up view of a computer monitor displaying a vibrant bar chart, indicating data analysis and progress tracking ,Generative ai. Increase decrease graph illustrations Computer monitor displaying a colorful bar chart for data analysis and progress tracking. Close-up view of a computer monitor displaying a vibrant bar chart, indicating data analysis and progress tracking ,Generative ai
Free with trial A striking visual representation of two contrasting trends, one rising and the other falling, depicted through elegant gradient colors in sharp focus. Increase decrease graph illustrations Dynamic Contrast of Trends Illustrated Through a Gradient Wave in a Vibrant Display of Colors. A striking visual representation of two contrasting trends, one rising and the other falling, depicted through elegant gradient colors in sharp focus
Free with trial A financial candlestick chart illustrates a positive market trend, with green and red candles indicating price movements and a smooth green line representing a moving average. Increase decrease graph illustrations Financial stock market candlestick chart showing upward trend with moving average line. A financial candlestick chart illustrates a positive market trend, with green and red candles indicating price movements and a smooth green line representing a moving average
Free with trial Red stock market investment decline chart. Downward arrow. Negative growth concept, business development, declining profits. Analytical financial chart. Trend. Changes in exchange rates, interest rates. Increase decrease graph vectors Red stock market investment decline chart. Downward arrow. Negative growth concept, business development, declining profits.
Free with trial Up and down arrow icon set in generic style. Upward and downward sign symbol illustration. Increase decrease graph vectors Up and down arrow icon set in generic style. Upward and downward sign symbol
Free with trial Red bar chart displays performance metrics on a table ,Generative ai. Increase decrease graph illustrations Red bar chart illustrating performance metrics on a table, data analysis and visualization. Red bar chart displays performance metrics on a table ,Generative ai
Free with trial Illustrated Percentage Sign with Radial Lines for Sales, Discounts, and Financial Concepts. Increase decrease graph vectors Illustrated Percentage Sign with Radial Lines for Sales, Discounts, and Financial Concepts
Free with trial Colorful growth chart with red and teal bars showing upward and downward arrows on a light background representing data trends progress decline business performance and financial analytics visual. Increase decrease graph illustrations Colorful growth chart with red and teal bars and upward and downward arrows on light background. colorful growth chart with red and teal bars showing upward and downward arrows on a light background representing data trends progress decline business performance and financial analytics visual
Free with trial This illustration depicts upward and downward trending arrows on a grid, symbolizing market fluctuations, business trends, and financial performance analysis. Increase decrease graph vectors Illustration of upward and downward trending arrows on a grid isolated on white background. This illustration depicts upward and downward trending arrows on a grid, symbolizing market fluctuations, business trends, and financial performance analysis
Free with trial Percent growth and decline arrow icon vector. Up and down percentage arrows sign symbol. Increase decrease graph vectors Percent growth and decline arrow icon. Up and down percentage arrows sign symbol
Free with trial Growth decline graphs, market trends. Business performance symbols. Vector illustration. EPS 10. Stock image. Increase decrease graph vectors Growth decline graphs, market trends. Business performance symbols. Vector illustration. EPS 10.
Free with trial This graphic illustrates various colorful bars and shapes representing data trends and statistics in a bold, abstract style. Increase decrease graph illustrations Colorful abstract data visualization with bars, lines, and circles depicting trends and statistics. This graphic illustrates various colorful bars and shapes representing data trends and statistics in a bold, abstract style.
Free with trial Up and down percent arrow icon vector. Percentage growth and decline arrows sign symbol. Increase decrease graph vectors Up and down percent arrow icon. Percentage growth and decline arrows sign symbol
Free with trial Percent arrow up and down icon vector. Growth and decline percentage arrows sign symbol. Increase decrease graph vectors Percent arrow up and down icon. Growth and decline percentage arrows sign symbol
Free with trial Abstract Black White Up Down Arrows Growth Chart Business Infographic Design. Generative AI. Increase decrease graph illustrations Abstract Black White Up Down Arrows Growth Chart Business Infographic Design
Free with trial A 3D rendered image of a businessman presenting financial data on a large screen, showing various charts and graphs. Increase decrease graph illustrations Businessman Presenting Financial Charts and Graphs. A 3D rendered image of a businessman presenting financial data on a large screen, showing various charts and graphs.
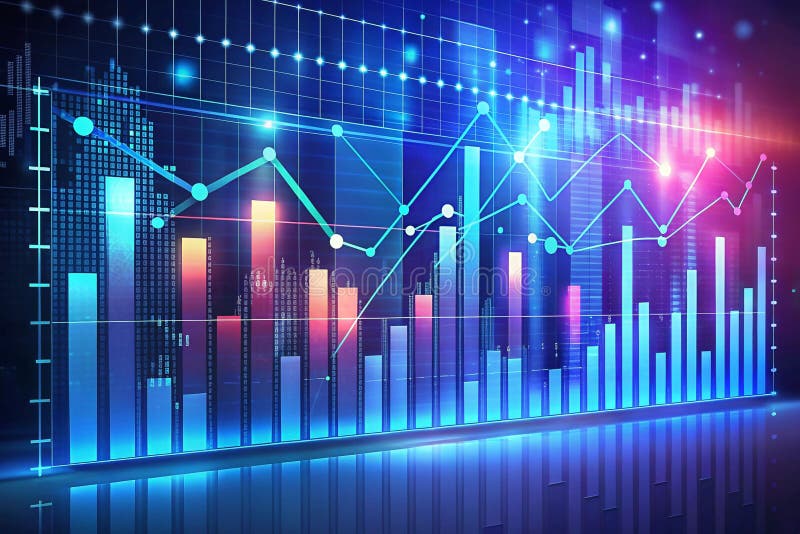
Free with trial Displaying fuchsia and blue graphs on gridlines with glowing currency symbols on dark trading panel. Finance, data, analytics, technology, investment, market, digital. Increase decrease graph illustrations Displaying fuchsia and blue graphs on gridlines with glowing currency symbols on dark trading panel
Free with trial Red textured arrows depict market fluctuations and business trends against a textured background symbolizes economic ups and downs, financial analysis, and investment opportunities with market statistics. Increase decrease graph illustrations Red arrows symbolizing fluctuations representing business trends on a textured background. red textured arrows depict market fluctuations and business trends against a textured background symbolizes economic ups and downs, financial analysis, and investment opportunities with market statistics
Free with trial Percent arrow growth and decline outline icon vector. Percentage up and down sign symbol. Increase decrease graph vectors Percent arrow growth and decline outline icon. Percentage up and down sign symbol
Free with trial A 3D bar chart displays a downward trend. The bars are alternating green and pink, decreasing in height from left to right. A bright yellow arrow points downwards, crossing over the bars and emphasizing the decline. The background is a solid, light blue. Increase decrease graph illustrations Downward Trending Bar Chart with Yellow Arrow Indicating Decline on Light Blue Background. A 3D bar chart displays a downward trend. The bars are alternating green and pink, decreasing in height from left to right. A bright yellow arrow points downwards, crossing over the bars and emphasizing the decline. The background is a solid, light blue
Free with trial Green cube with an upward arrow, symbolizing business progress, finance and investment growth. Close-up. Increase decrease graph illustrations Green cube with an upward arrow, symbolizing business progress, finance and investment growth
Free with trial Up and down arrow dollar icon on black circle. USD growth and decline sign symbol vector. Increase decrease graph vectors Up and down arrow dollar icon on black circle. USD growth and decline sign symbol
Free with trial Colorful growth chart featuring orange and teal bars with upward and downward arrows on a clean white background representing progress decline business data trends and financial performance metrics. Increase decrease graph illustrations Colorful growth chart with orange and teal bars and upward and downward arrows on white background. colorful growth chart featuring orange and teal bars with upward and downward arrows on a clean white background representing progress decline business data trends and financial performance metrics
Free with trial Stock market data with various ticker symbols and percentages displayed in red and green. Numbers and letters are overlaid on dark background with a grid pattern. Increase decrease graph illustrations Stock market data with various ticker symbols and percentages displayed in red and green
Free with trial Hand-drawn line chart doodle is showing grid backdrop and axis over gradient background, copy space. Data visualization, infographics, analytics, diagram, business, educational, minimalistic. Increase decrease graph illustrations Hand-drawn line chart doodle is showing grid backdrop and axis over gradient background, copy space
Free with trial Abstract digital illustration featuring blue and red bar charts and line graphs on a dark blue background. Orange and light blue points highlight data trends. The style is clean and modern. Increase decrease graph illustrations Abstract Financial Data Visualization Blue Red Charts Graphs Lines Points finance business. Abstract digital illustration featuring blue and red bar charts and line graphs on a dark blue background. Orange and light blue points highlight data trends. The style is clean and modern
Free with trial A pair of gleaming gold bars placed on digital financial graphs, symbolizing wealth and investment strategy. The background features abstract data points and fluctuating lines. Increase decrease graph illustrations Shiny Gold Bars Resting on Financial Charts Representing Wealth and Investment Opportunities. A pair of gleaming gold bars placed on digital financial graphs, symbolizing wealth and investment strategy. The background features abstract data points and fluctuating lines
Free with trial 3D Colorful Charts Magnifier Analysis, Data Visualization, Market Research ,chart,magnifying glass , This photo was created using generative AI. Increase decrease graph illustrations 3D Colorful Charts Magnifier Analysis, Data Visualization, Market Research ,chart,magnifying glass
Free with trial Illuminated red financial chart depicting vibrant stock market trends, showcasing upward and downward movements. ideal for financial reports, analysis, and investment presentations in the stock market domain. Generative AI. Increase decrease graph illustrations Dynamic Red Financial Data Chart with Glowing Lights for Stock Market Analysis Generative AI. Illuminated red financial chart depicting vibrant stock market trends, showcasing upward and downward movements. ideal for financial reports, analysis, and investment presentations in the stock market domain. Generative AI
Free with trial Futuristic financial data visualization with graphs and charts showing growth and market trends. Increase decrease graph illustrations Futuristic financial data visualization with graphs and charts showing growth and market trends
Free with trial Up and down trend chart icon in black circle. Business growth and decline symbol illustration. Increase decrease graph vectors Up and down trend chart icon in black circle. Business growth and decline symbol
Free with trial Percent up and down icon. Percentage upward and downward sign. Growth and decline symbol vector. Increase decrease graph vectors Percent up and down icon. Percentage upward and downward sign. Growth and decline symbol
Free with trial Fund investment concept, Interest rate, percentage and arrow investment on coin instead of return return index fund and mutual fund return long term investment retirement fund. Increase decrease graph illustrations Fund investment concept, Interest rate, percentage and arrow investment on coin instead of return return index fund and mutual
Free with trial Loan interest rate doodle icon set. Hand drawn sketch doodle line style bank money loan interest rate icon for house, car discount percentage concept. Trendy cute element. Vector illustration. Increase decrease graph vectors Loan interest rate doodle icon set. Hand drawn sketch doodle line style bank money loan interest rate icon for house
Free with trial Loan interest rate doodle icon set. Hand drawn sketch doodle line style bank money loan interest rate icon for house, car discount percentage concept. Trendy cute element. Vector illustration. Increase decrease graph vectors Loan interest rate doodle icon set. Hand drawn sketch doodle line style bank money loan interest rate icon for house
Free with trial Two lines traverse the canvas, one descending and the other ascending, embodying contrasting trends in a warm orange spectrum that captivates the observer's eye. Increase decrease graph illustrations Dynamic Trends Illustrated in Warm Shades of Orange Showcasing Contrasting Movements Over Time. Two lines traverse the canvas, one descending and the other ascending, embodying contrasting trends in a warm orange spectrum that captivates the observer's eye
Free with trial Growth and decline percent arrow outline icon on black circle. Percentage up and down sign symbol vector. Increase decrease graph vectors Growth and decline percent arrow outline icon on black circle. Percentage up and down sign symbol
Free with trial 3d bar chart illustrating growth, analysis, and business progress with colorful visual representation of data ,Generative ai. Increase decrease graph illustrations 3d bar chart, visualizing growth, data analysis, and business progress for effective communication. 3d bar chart illustrating growth, analysis, and business progress with colorful visual representation of data ,Generative ai
Free with trial Loan interest rate doodle icon set. Hand drawn sketch doodle line style bank money loan interest rate icon for house, car discount percentage concept. Trendy cute element. Vector illustration. Increase decrease graph vectors Loan interest rate doodle icon set. Hand drawn sketch doodle line style bank money loan interest rate icon for house
Free with trial Loan interest rate doodle icon set. Hand drawn sketch doodle line style bank money loan interest rate icon for house, car discount percentage concept. Trendy cute element. Vector illustration. Increase decrease graph vectors Loan interest rate doodle icon set. Hand drawn sketch doodle line style bank money loan interest rate icon for house
Free with trial Loan interest rate doodle icon set. Hand drawn sketch doodle line style bank money loan interest rate icon for house, car discount percentage concept. Trendy cute element. Vector illustration. Increase decrease graph vectors Loan interest rate doodle icon set. Hand drawn sketch doodle line style bank money loan interest rate icon for house
Free with trial Loan interest rate doodle icon set. Hand drawn sketch doodle line style bank money loan interest rate icon for house, car discount percentage concept. Trendy cute element. Vector illustration. Increase decrease graph vectors Loan interest rate doodle icon set. Hand drawn sketch doodle line style bank money loan interest rate icon for house
Free with trial Stacks of gold coins sit before a fluctuating red arrow graph illustrating concepts of financial growth market trends investment risk and economic change The image depicts uncertainty and the potential for both profit and loss. Increase decrease graph illustrations Financial Growth Stock Market Coins Red Arrow Investment Business Economy Finance Money Success. Stacks of gold coins sit before a fluctuating red arrow graph illustrating concepts of financial growth market trends investment risk and economic change The image depicts uncertainty and the potential for both profit and loss
Free with trial Gold business icons on dark background graphs, charts, money, global, growth, finance, planning, idea, vibrant background Generative AI. Increase decrease graph illustrations Gold business icons on dark background graphs, charts, money, global, growth, finance, planning, idea
Free with trial Reduction chart icon vector logo set collection for web app ui. Increase decrease graph vectors Reduction chart icon set depicting data reduction symbols, ideal for business analytics and performance visuals. Reduction chart icon vector logo set collection for web app ui
Free with trial Percentage sign icon, related to accounting, ideal for financial, tax, or business-related designs. Increase decrease graph vectors Professional Percentage Sign Icon for Accounting Purposes. Percentage sign icon, related to accounting, ideal for financial, tax, or business-related designs.
Free with trial Red cube with arrow up. Business and market growth concept. Close-up. Increase decrease graph illustrations Red cube with arrow up. Business and market growth concept
Free with trial Red cube with arrow up. Business and market growth concept. Close-up. Increase decrease graph illustrations Red cube with arrow up. Business and market growth concept
Free with trial Red cube with arrow up. Business and market growth concept. Close-up. Increase decrease graph illustrations Red cube with arrow up. Business and market growth concept
Free with trial Red cube with arrow up. Business and market growth concept. Close-up. Increase decrease graph illustrations Red cube with arrow up. Business and market growth concept
Free with trial Red cube with arrow up. Business and market growth concept. Close-up. Increase decrease graph illustrations Red cube with arrow up. Business and market growth concept
Free with trial Red cube with arrow up. Business and market growth concept. Close-up. Increase decrease graph illustrations Red cube with arrow up. Business and market growth concept
Free with trial Red cube with arrow up. Business and market growth concept. Close-up. Increase decrease graph illustrations Red cube with arrow up. Business and market growth concept
Free with trial A percentage sign is a symbol used to indicate a proportion or ratio in relation to a whole. It is commonly used in finance, business, and marketing contexts, and more. Increase decrease graph vectors Illustration of a percentage sign, a symbol used to indicate a proportion or ratio in relation to a whole. A percentage sign is a symbol used to indicate a proportion or ratio in relation to a whole. It is commonly used in finance, business, and marketing contexts, and more
Free with trial Blue folder with chart, business organization, data analysis, and report presentation concept. streamline your workflow ,Generative ai. Increase decrease graph illustrations Blue folder with chart, streamlining business data analysis and report presentation for enhanced workflow. Blue folder with chart, business organization, data analysis, and report presentation concept. streamline your workflow ,Generative ai
Free with trial This image shows a vibrant 3D bar chart and pie chart, ideal for business presentations and reports to visualize data effectively. The colorful design is visually appealing and easy to understand. Increase decrease graph illustrations Colorful 3D Bar and Pie Charts for Business Presentation. This image shows a vibrant 3D bar chart and pie chart, ideal for business presentations and reports to visualize data effectively. The colorful design is visually appealing and easy to understand.
Free with trial Percent up and down icon on circle line. Percentage arrow growth and decline sign symbol vector. Increase decrease graph vectors Percent up and down icon on circle line. Percentage arrow growth and decline sign symbol
Free with trial This vibrant 3D bar chart illustrates upward trending data, perfect for presentations or reports on financial growth, market analysis, or business success. The colorful blocks represent different data points. Increase decrease graph illustrations Colorful 3D Bar Chart Showing Business Growth and Success. This vibrant 3D bar chart illustrates upward trending data, perfect for presentations or reports on financial growth, market analysis, or business success. The colorful blocks represent different data points.
Free with trial Inventory cart, Snowflake and 3d chart minimal line icons. Neon laser 3d lights. People icons. For web, application, printing. Warehouse goods, Snow, Presentation column. Support job. Vector. Increase decrease graph vectors Inventory cart, Snowflake and 3d chart minimal line icons. For web application, printing. Neon laser 3d lights. Vector. Inventory cart, Snowflake and 3d chart minimal line icons. Neon laser 3d lights. People icons. For web, application, printing. Warehouse goods, Snow, Presentation column. Support job. Vector
Free with trial Green cube with arrow up. Business and market growth concept. Close-up. Increase decrease graph illustrations Green cube with arrow up. Business and market growth concept
Free with trial Green cube with arrow up. Business and market growth concept. Close-up. Increase decrease graph illustrations Green cube with arrow up. Business and market growth concept
Free with trial Green cube with arrow up. Business and market growth concept. Close-up. Increase decrease graph illustrations Green cube with arrow up. Business and market growth concept
Free with trial Green cube with arrow up. Business and market growth concept. Close-up. Increase decrease graph illustrations Green cube with arrow up. Business and market growth concept
Free with trial A set of black and white icons representing stock market data analysis and financial growth. 94. Increase decrease graph vectors Stock market data analysis charts and graphs business finance and investment vector icon set design 100. a set of black and white icons representing stock market data analysis and financial growth. 94
Free with trial The global energy market is a dynamic and complex system, heavily influenced by factors ranging from geopolitical events to technological advancements. This compelling visualization showcases the fluctuating price of a barrel of crude oil over time, revealing the dramatic boom and bust cycles characteristic of the industry. Observe the peaks and valleys, the periods of sustained growth, and the. Increase decrease graph illustrations Visualizing Crude Oil Price Volatility A Deep Dive into the Boom and Bust Cycles of the Global Energy. The global energy market is a dynamic and complex system, heavily influenced by factors ranging from geopolitical events to technological advancements. This compelling visualization showcases the fluctuating price of a barrel of crude oil over time, revealing the dramatic boom and bust cycles characteristic of the industry. Observe the peaks and valleys, the periods of sustained growth, and the
Free with trial Percent arrow down and up icon on black circle. Percentage decline and growth sign symbol vector. Increase decrease graph vectors Percent arrow down and up icon on black circle. Percentage decline and growth sign symbol
Free with trial The Cost reduction and coins for Business concept 3d rendering. Increase decrease graph illustrations The Cost reduction and coins for Business concept 3d rendering
Free with trial The Cost reduction and coins for Business concept 3d rendering. Increase decrease graph illustrations The Cost reduction and coins for Business concept 3d rendering
Free with trial The Cost reduction and coins for Business concept 3d rendering. Increase decrease graph illustrations The Cost reduction and coins for Business concept 3d rendering
Free with trial The Cost reduction and coins for Business concept 3d rendering. Increase decrease graph illustrations The Cost reduction and coins for Business concept 3d rendering
Free with trial The Cost reduction and coins for Business concept 3d rendering. Increase decrease graph illustrations The Cost reduction and coins for Business concept 3d rendering
Free with trial The Cost reduction and coins for Business concept 3d rendering. Increase decrease graph illustrations The Cost reduction and coins for Business concept 3d rendering
Free with trial Lower price. Text effect design with modern colors and 3D font look. Increase decrease graph illustrations Lower price. Text effect with modern colors and 3D font look