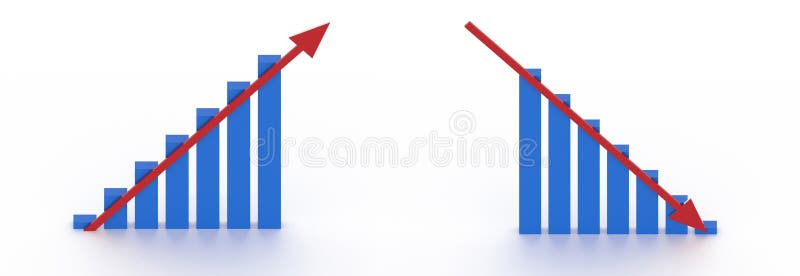
Free with trial The economic impact of coronavirus on the economy. Falling markets and shares due to nCov-2019 pandemic. Stock vector illustration. Increase decrease graph vectors The economic impact of coronavirus on the economy. Falling markets and shares due to nCov-2019 pandemic
Free with trial Data slice in the volume of the distribution function of point data. Three-dimensional flow of analytical information. The bulge of the mountain in the context of science. Increase decrease graph illustrations Data slice in the volume function of point data. Three-dimensional flow information. The bulge of the mountain science. Data slice in the volume of the distribution function of point data. Three-dimensional flow of analytical information. The bulge of the mountain in the context of science
Free with trial Group of people with devices in hands having desk discussion and making reports together on laptop, tablet, notebookn. Increase decrease graph illustrations Group of people with devices in hands having desk discussion and working on laptops, tablets in team. Group of people with devices in hands having desk discussion and making reports together on laptop, tablet, notebookn
Free with trial GDP word rising and falling arrows and coins. Gross domestic product concept. 3D illustration. Increase decrease graph illustrations GDP word rising and falling arrows and coins. Gross domestic product concept. 3D illustration
Free with trial 3d blue charts with red arrows heading up and down. Increase decrease graph illustrations Rising and falling chart with arrows. 3d blue charts with red arrows heading up and down
Free with trial Petroleum and oil prices business graphic design, vector illustration eps10. Increase decrease graph vectors Petroleum and oil prices business
Free with trial The growth and decline concept with businessmen. Increase decrease graph illustrations The growth and decline concept with businessmen
Free with trial Concept profit red bar ladder blocks on spring spirals 3d. Increase decrease graph illustrations Concept profit red bar ladder blocks on spring spirals
Free with trial Malaysia business economy growth country with map and finance condition - vector illustration. Increase decrease graph illustrations Malaysia business economy growth country with map and finance condition - vector illustration
Free with trial Thick textbook on economics in hardcover with bookmark inside and colorful statistical chart isolated vector illustration on white background. Increase decrease graph vectors Textbook on Economics and Bright Statistical Chart. Thick textbook on economics in hardcover with bookmark inside and colorful statistical chart isolated vector illustration on white background.
Free with trial Oil prices industry design, vector illustration eps10. Increase decrease graph illustrations Oil prices industry
Free with trial Financial stock crisis chart, vector art illustration. Increase decrease graph vectors Financial stock crisis chart
Free with trial Collection of finance related line icons. Editable stroke. Vector eps 8. Increase decrease graph vectors Collection of finance related line icons. Editable stroke
Free with trial Vietnam business economy growth country with map and finance condition - vector illustration. Increase decrease graph illustrations Vietnam business economy growth country with map and finance condition - vector illustration
Free with trial Indonesia business economy growth country with map and finance condition - vector illustration. Increase decrease graph illustrations Indonesia business economy growth country with map and finance condition - vector illustration
Free with trial Partnership, Project edit and 3d chart line icons set. Timeline process infograph. Idea sign. Business startup, Settings, Presentation column. Light bulb. Science set. Vector. Increase decrease graph vectors Partnership, Project edit and 3d chart icons set. Idea sign. Business startup, Settings, Presentation column. Vector. Partnership, Project edit and 3d chart line icons set. Timeline process infograph. Idea sign. Business startup, Settings, Presentation column. Light bulb. Science set. Vector
Free with trial Set of Business icons, such as Loan percent, Friendship, Check investment, Bill accounting, Arena stadium, Unknown file, Diagram chart, Chemistry lab, Travel calendar, Bitcoin think. Vector. Increase decrease graph vectors Set of Business icons, such as Loan percent, Friendship, Check investment. Vector. Set of Business icons, such as Loan percent, Friendship, Check investment, Bill accounting, Arena stadium, Unknown file, Diagram chart, Chemistry lab, Travel calendar, Bitcoin think. Vector
Free with trial Percent down and up icon in trendy style. Percentage downward and upward arrow sign. Decline and growth symbol vector. Increase decrease graph vectors Percent down and up icon in trendy style. Percentage downward and upward arrow sign. Decline and growth symbol
Free with trial Debit card, Euro currency and Loan percent line icons set. Handshake deal, research and promotion complex icons. Statistics timer sign. Wallet with credit card, Eur banking, Discount blueprint. Vector. Increase decrease graph vectors Debit card, Euro currency and Loan percent icons set. Statistics timer sign. Vector. Debit card, Euro currency and Loan percent line icons set. Handshake deal, research and promotion complex icons. Statistics timer sign. Wallet with credit card, Eur banking, Discount blueprint. Vector
Free with trial Blocks growing bar diagram on white wall 3d. Increase decrease graph illustrations Blocks growing bar diagram on white wall
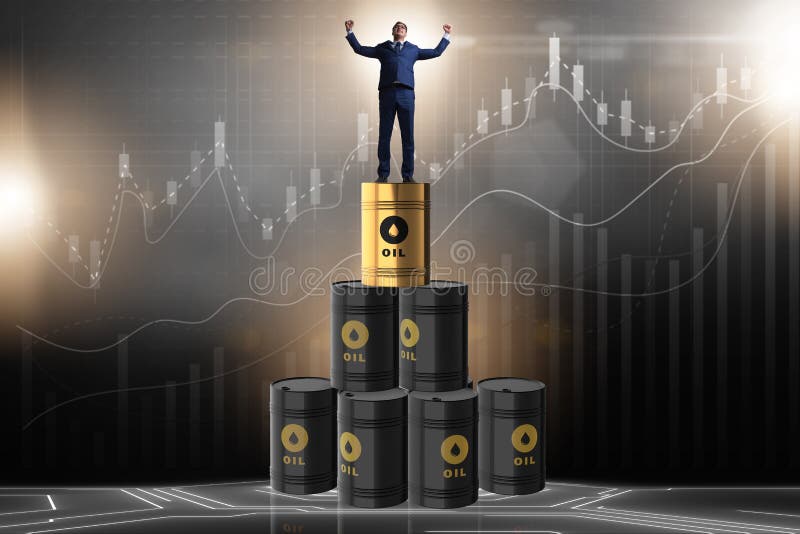
Free with trial The businessman on top of oil barrels. Increase decrease graph illustrations The businessman on top of oil barrels
Free with trial Rendered illustration of a three dimensional pie chart in five colors. Increase decrease graph illustrations Three dimensional pie chart in five colors.
Free with trial The arab businessman supporting oil price. Increase decrease graph illustrations The arab businessman supporting oil price
Free with trial Analytics half glyph vector icon which can easily modify or edit. Increase decrease graph vectors Analytics half glyph vector icon which can easily modify or edit
Free with trial Set of internet investor at home icons, stock vector. Increase decrease graph vectors Set of internet investor at home icons
Free with trial The businessman on top of oil barrels. Increase decrease graph illustrations The businessman on top of oil barrels
Free with trial Vector set of Electronic thermometer, Organic product and Ab testing line icons set. UI phone app screens with line icons. Analytics chart icon. Temperature scan, Leaves, Test chart. Vector. Increase decrease graph vectors Vector set of Electronic thermometer, Organic product and Ab testing line icons set. Vector. Vector set of Electronic thermometer, Organic product and Ab testing line icons set. UI phone app screens with line icons. Analytics chart icon. Temperature scan, Leaves, Test chart. Vector
Free with trial Bitcoin, Income money and Presentation board icons simple set. Remote work banner. Home education class. Stock analysis sign. Cryptocurrency coin, Savings, Growth chart. Business trade. Vector. Increase decrease graph vectors Bitcoin, Income money and Presentation board icons set. Stock analysis sign. Vector. Bitcoin, Income money and Presentation board icons simple set. Remote work banner. Home education class. Stock analysis sign. Cryptocurrency coin, Savings, Growth chart. Business trade. Vector
Free with trial Decreasing bars chart icon vector isolated on white background for your web and mobile app design, Decreasing bars chart logo concept. Increase decrease graph vectors Decreasing bars chart icon vector sign and symbol isolated on white background, Decreasing bars chart logo concept. Decreasing bars chart icon vector isolated on white background for your web and mobile app design, Decreasing bars chart logo concept
Free with trial Charts and graphs icons. Infochart, Block diagram and Algorithm. Presentation classic icon set Quality set. Vector. Increase decrease graph vectors Charts and graphs icons. Infochart, Block diagram and Algorithm. Classic icon set. Vector. Charts and graphs icons. Infochart, Block diagram and Algorithm. Presentation classic icon set Quality set. Vector
Free with trial Volatile uncertain Bitcoin cryptocurrency up and down arrow. 3D Rendering. Increase decrease graph illustrations Volatile uncertain Bitcoin cryptocurrency up and down arrow. 3D Rendering
Free with trial Growth and loss arrow in white background. Increase decrease graph illustrations Growth and loss arrow
Free with trial The arab businessman in oil price business concept. Increase decrease graph illustrations The arab businessman in oil price business concept
Free with trial Petroleum oil industry icon illustration graphic design. Increase decrease graph illustrations Petroleum oil industry
Free with trial Liquid badges. Set of Cloud storage, Dot plot and Star icons. Crane claw machine sign. Computer, Presentation graph, Customer feedback. Attraction park. Gradient cloud storage icon. Vector. Increase decrease graph vectors Cloud storage, Dot plot and Star icons. Crane claw machine sign. Vector. Liquid badges. Set of Cloud storage, Dot plot and Star icons. Crane claw machine sign. Computer, Presentation graph, Customer feedback. Attraction park. Gradient cloud storage icon. Vector
Free with trial A businessman stands with arms outstretched holding 'Buy' and 'Sell' signs, visually representing market trends and investment decisions for use in financial illustrations. Increase decrease graph illustrations Buy Sell Indicator for Stock Trader. A businessman stands with arms outstretched holding 'Buy' and 'Sell' signs, visually representing market trends and investment decisions for use in financial illustrations
Free with trial Volatile uncertain Bitcoin cryptocurrency up and down arrow. 3D Rendering. Increase decrease graph illustrations Volatile uncertain Bitcoin cryptocurrency up and down arrow. 3D Rendering
Free with trial Inflation icon line. Simple element economic crisis symbol for templates, web design and infographics. Increase decrease graph vectors Inflation icon. Monochrome simple line Economic Crisis icon for templates, web design and infographics. Inflation icon line. Simple element economic crisis symbol for templates, web design and infographics.
Free with trial Aging society and low birth rate in developed countries. Low natality rate causing elderly population increase. State economy, pension and social funds problem. Flat vector illustration. Increase decrease graph vectors Aging society and low birth rate in developed countries set. Workforce. Aging society and low birth rate in developed countries. Low natality rate causing elderly population increase. State economy, pension and social funds problem. Flat vector illustration
Free with trial Statistics, Trash bin and Targeting line icons set. Chat bubbles with quotes. Alarm clock, Computer keyboard and Report document signs. Organic product, Diagram graph symbols. Vector. Increase decrease graph vectors Statistics, Trash bin and Targeting icons set. Alarm clock, Computer keyboard and Report document signs. Vector. Statistics, Trash bin and Targeting line icons set. Chat bubbles with quotes. Alarm clock, Computer keyboard and Report document signs. Organic product, Diagram graph symbols. Vector
Free with trial The business concept of both crisis and recovery. Increase decrease graph illustrations The business concept of both crisis and recovery
Free with trial Rise icon in filled, thin line, outline and stroke style. Vector illustration of two colored and black rise vector icons designs can be used for mobile, ui, web. Increase decrease graph vectors Rise icon in filled, thin line, outline and stroke style. Vector illustration of two colored and black rise vector icons designs
Free with trial On the blackboard analysis of the dynamics of the business, sales. Increase decrease graph vectors On the board an analysis of business activities. On the blackboard analysis of the dynamics of the business, sales
Free with trial Data slice in the volume of the distribution function of point data. Three-dimensional flow of analytical information. The bulge of the mountain in the context of science. Increase decrease graph illustrations Data slice in the volume function of point data. Three-dimensional flow information. The bulge of the mountain science. Data slice in the volume of the distribution function of point data. Three-dimensional flow of analytical information. The bulge of the mountain in the context of science
Free with trial Creative vector illustration of revenue, profit, expenses diagram showing infographic isolated on transparent background. Art design business planning template. Abstract concept graphic element. Increase decrease graph vectors Creative vector illustration of revenue, profit, expenses diagram showing infographic isolated on transparent background
Free with trial Creative vector illustration of revenue, profit, expenses diagram showing infographic isolated on transparent background. Art design business planning template. Abstract concept graphic element. Increase decrease graph vectors Creative vector illustration of revenue, profit, expenses diagram showing infographic isolated on transparent background
Free with trial Download arrow, Search package and Report icons simple set. Comparison table. Wine sign. Crisis, Tracking service, Presentation chart. Merlot bottle. Business set. Pricing plan. Vector. Increase decrease graph vectors Download arrow, Search package and Report icons set. Wine sign. Crisis, Tracking service, Presentation chart. Vector. Download arrow, Search package and Report icons simple set. Comparison table. Wine sign. Crisis, Tracking service, Presentation chart. Merlot bottle. Business set. Pricing plan. Vector
Free with trial Volatile uncertain Bitcoin cryptocurrency up and down arrow. 3D Rendering. Increase decrease graph illustrations Volatile uncertain Bitcoin cryptocurrency up and down arrow. 3D Rendering
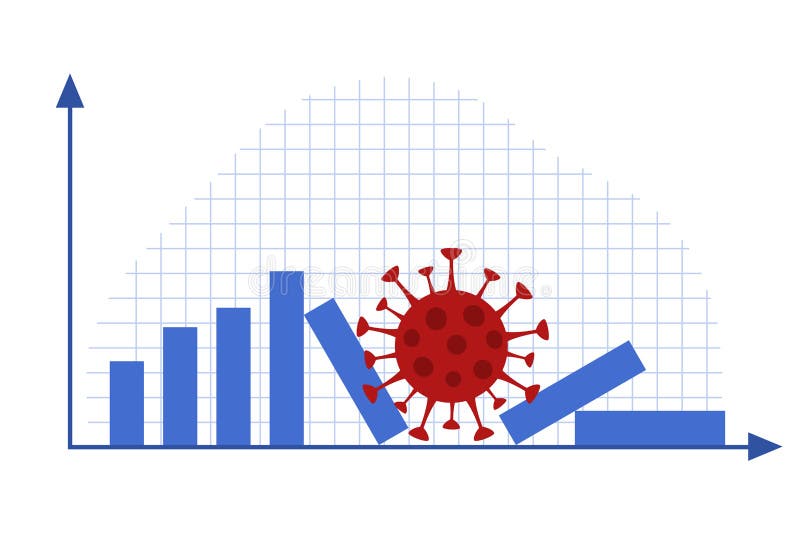
Free with trial Illustration vector design of corona virus making down economy. Increase decrease graph vectors Corona virus vector illustration design. Illustration vector design of corona virus making down economy
Free with trial Vector icon concept of house with arrow down. Black outlines, white background. Increase decrease graph vectors Vector icon concept of house with arrow down
Free with trial Cashback, Money transfer and 24 hours icons simple set. Check investment, Income money and Download arrow signs. Success business, Shopping cart and Loan percent symbols. Line cashback icon. Vector. Increase decrease graph vectors Cashback, Money transfer and 24 hours icons set. Check investment, Income money and Download arrow signs. Vector. Cashback, Money transfer and 24 hours icons simple set. Check investment, Income money and Download arrow signs. Success business, Shopping cart and Loan percent symbols. Line cashback icon. Vector
Free with trial Down chart icon on background for graphic and web design. Simple illustration. Internet concept symbol for website button or mobile app. Increase decrease graph vectors Down chart icon on background for graphic and web design. Simple illustration. Internet concept symbol for website
Free with trial Young businessman sleeping with charts, graphs and reports on the background. Increase decrease graph illustrations Businessman sleeping with charts, graphs and reports concept. Young businessman sleeping with charts, graphs and reports on the background
Free with trial Up, down, left, and right arrow icon on black circle. Upward, downward, leftward, and rightward sign symbol vector. Increase decrease graph vectors Up, down, left, and right arrow icon on black circle. Upward, downward, leftward, and rightward sign symbol
Free with trial Creative vector illustration of revenue, profit, expenses diagram showing infographic isolated on transparent background. Art design business planning template. Abstract concept graphic element. Increase decrease graph vectors Creative vector illustration of revenue, profit, expenses diagram showing infographic isolated on transparent background
Free with trial Africa continent business economy growth country with map and finance condition - vector illustration. Increase decrease graph illustrations Africa continent business economy growth country with map and finance condition - vector illustration
Free with trial The businessman supporting oil price in business concept. Increase decrease graph illustrations The businessman supporting oil price in business concept
Free with trial The businessman sliding down on chair in economic crisis concept. Increase decrease graph illustrations The businessman sliding down on chair in economic crisis concept
Free with trial Ranking star, Eco energy and Certificate line icons set. Chat bubbles with quotes. Love message, Rotation gesture and Dot plot signs. Ab testing, Reject refresh symbols. Click rank, Lightbulb. Vector. Increase decrease graph vectors Ranking star, Eco energy and Certificate icons set. Love message, Rotation gesture and Dot plot signs. Vector. Ranking star, Eco energy and Certificate line icons set. Chat bubbles with quotes. Love message, Rotation gesture and Dot plot signs. Ab testing, Reject refresh symbols. Click rank, Lightbulb. Vector
Free with trial Interest rates fluctuation symbols. Vector finance arrows. Economic indicators concept. EPS 10. Increase decrease graph vectors Interest rates fluctuation symbols. Vector finance arrows. Economic indicators concept.
Free with trial Set of Diagram chart, Survey checklist and Credit card line icons. Poster offer frame with quote, comma. Include Report statistics icons. For web, application. Vector. Increase decrease graph vectors Set of Diagram chart, Survey checklist and Credit card line icons. For design. Vector. Set of Diagram chart, Survey checklist and Credit card line icons. Poster offer frame with quote, comma. Include Report statistics icons. For web, application. Vector
Free with trial This image depicts wheat price analysis, showcasing agricultural economics and market trends. It emphasizes crop valuation, finance, and investment strategies in detail. Increase decrease graph vectors Vector art of wheat price analysis a visual representation of agricultural economics and market trends with a focus on crop. This image depicts wheat price analysis, showcasing agricultural economics and market trends. It emphasizes crop valuation, finance, and investment strategies in detail
Free with trial Gold rate decreased in india, indian rupees floating in air gold with rupees icon 3d render illustration Image indian rupee symbol with background. Increase decrease graph illustrations Gold rate decreased in india, indian rupees floating in air gold with rupees icon 3d render illustration Image indian rupee symbol
Free with trial Business growth of year in white background. Increase decrease graph illustrations Business growth of year
Free with trial Up and down graph chart icon. Growth increase and decrease sign. Graph or diagram with arrow going up and down. Vector illustration. Increase decrease graph illustrations Up and down graph chart icon. Growth increase and decrease sign. Graph or diagram with arrow going up and down. Vector
Free with trial Up and down graph chart icon. Growth increase and decrease sign. Graph or diagram with arrow going up and down. Vector. Illustration. Increase decrease graph vectors Up and down graph chart icon. Growth increase and decrease sign. Graph or diagram with arrow going up and down. Vector. Illustration
Free with trial Business growth and decline icon in black circle. Up and down trend chart symbol illustration. Increase and decrease bar graph concept. Increase decrease graph vectors Business growth and decline icon in black circle. Up and down trend chart symbol. Increase and decrease bar graph concept
Free with trial Graph growth with arrow up and reduction with arrow down, line chart icon. Financial invest, fall, increase and decrease. Statistics and analytics. Vector flat illustration. Increase decrease graph vectors Graph growth with arrow up and reduction with arrow down, line chart icon. Financial invest, fall, increase and decrease
Free with trial Graph growth with arrow up and reduction with arrow down, line chart icon. Financial invest, fall, increase and decrease. Statistics and analytics. Vector flat illustration. Increase decrease graph vectors Graph growth with arrow up and reduction with arrow down, line chart icon. Financial invest, fall, increase and decrease
Free with trial Graph growth with arrow up and reduction with arrow down, line chart icon. Financial invest, fall, increase and decrease. Statistics and analytics. Vector flat illustration. Increase decrease graph vectors Graph growth with arrow up and reduction with arrow down, line chart icon. Financial invest, fall, increase and decrease
Free with trial A bar graph comparing the decrease in crop yields with the increase in agricultural technology and efficiency highlighting the need for sustainable farming practices.. Vector illustration. Increase decrease graph vectors A bar graph comparing the decrease in crop yields with the increase in agricultural technology and efficiency
Free with trial A red graph with arrows illustrating decrease and increase, representing data analysis and performance evaluation in business. Suitable for reports and presentations. Increase decrease graph vectors Vector art of red graph with arrow, illustrating decrease and increase, representing data analysis and performance evaluation in. A red graph with arrows illustrating decrease and increase, representing data analysis and performance evaluation in business. Suitable for reports and presentations
Free with trial A colorful bar graph showing an increase and decrease represented by wooden blocks. Increase decrease graph illustrations Colorful wooden block bar graph showing increase and decrease of progress. A colorful bar graph showing an increase and decrease represented by wooden blocks
Free with trial Statistic graph progress, financial profit growth, increase, and decrease line icons set. Infographic charts with arrows, circles, and bars thin black outline symbols vector illustration. Increase decrease graph vectors Statistic graph progress, financial profit growth, increase and decrease line icons set. Statistic graph progress, financial profit growth, increase, and decrease line icons set. Infographic charts with arrows, circles, and bars thin black outline symbols vector illustration.
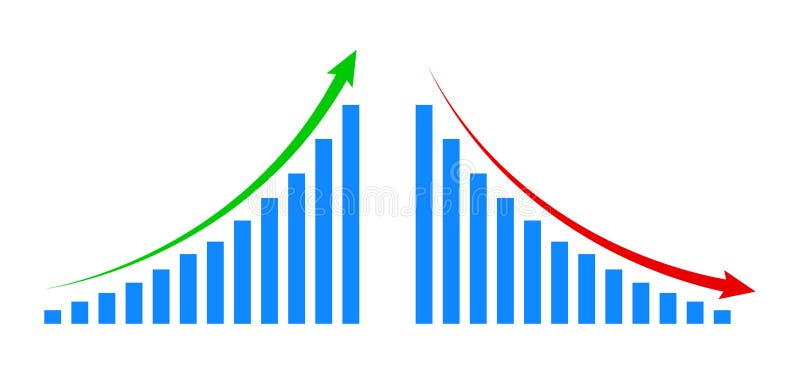
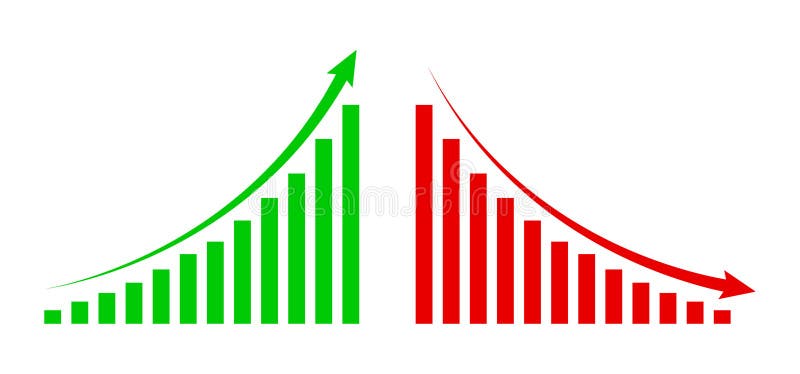
Free with trial Graph going Up and Down sign with green and red arrows. graph increase, decrease sign design. Increase decrease graph vectors Graph going Up and Down sign with green and red arrows. graph increase, decrease sign
Free with trial Up and down graph chart icon. Growth increase and decrease sign. Graph or diagram with arrow going up and down. Vector illustration. Increase decrease graph vectors Up and down graph chart icon. Growth increase and decrease sign. Graph or diagram with arrow going up and down. Vector
Free with trial Financial arrows up and down. Vector graph with green and red arrows. Chart with increase, decrease. Vector 10 EPS. Increase decrease graph vectors Financial arrows up and down. Vector graph with green and red arrows. Chart with increase, decrease.
Free with trial Graph going up and down sign financial arrows. chart increase, decrease sign with green and red arrows. vector graph with green and red arrows. Increase decrease graph vectors Graph going up and down sign financial arrows. chart increase, decrease sign with green and red arrows. vector graph
Free with trial Statistic graph progress, financial profit growth, increase and decrease line icons set. Infographic charts with arrow, circles and bars thin black and red outline symbols vector illustration. Increase decrease graph vectors Statistic graph progress, financial profit growth, increase and decrease line icons set
Free with trial Profit rise and fall graph. Infographic with up and down arrow. Increase and decrease in amount money. Banknotes heap. Financial success. Economy crisis and recession. Statistics chart. Vector concept. Increase decrease graph vectors Profit rise and fall graph. Infographic with up and down arrow. Increase and decrease in amount money. Banknotes heap. Financial