Free with trial Growth and loss arrow icon on circle line. Increase and decrease sign symbol illustration. Increase decrease graph vectors Growth and loss arrow icon on circle line. Increase and decrease sign symbol
Free with trial Businessman runs and holds coins on a red arrow graph decrease on a stack of coins to coin slot. Business Down, wealth create, financial, investment goal, corporate develop, economic, profit and loss. Increase decrease graph vectors Businessman runs and holds coins on a red arrow graph decrease on a stack of coins to coin slot. Business Down, wealth create
Free with trial The graph of the growth and fall of valuable assets is black, three-dimensional, in a modern digital style. Exchange, trading, decrease, increase concept. Generative Ai. Increase decrease graph illustrations The graph of the growth and fall of valuable assets is black, three-dimensional, in a modern digital style. Exchange, trading
Free with trial Growth and loss icon on black circle. Increase and decrease sign symbol. Zigzag arrows illustration concept. Increase decrease graph vectors Growth and loss icon on black circle. Increase and decrease sign symbol. Zigzag arrows concept
Free with trial Up and down arrow icon in generic style. Increase and decrease sign symbol. Zigzag arrows illustration concept. Increase decrease graph vectors Up and down arrow icon in generic style. Increase and decrease sign symbol. Zigzag arrows concept
Free with trial Cut or decrease cost to increase profitability by minimizing expenses, eps10. Increase decrease graph vectors Cut or decrease cost to increase profitability by minimizing expenses
Free with trial A simple line graph illustration showing fluctuations and an upward trend. The graph is drawn on a grid with a black line and red data points, indicating a period of increase, followed by a decrease, and then a final increase. This image can be used to represent business trends, financial analysis, stock market data, or any data that shows changes over time. Increase decrease graph vectors Line Graph with Fluctuations. A simple line graph illustration showing fluctuations and an upward trend. The graph is drawn on a grid with a black line and red data points, indicating a period of increase, followed by a decrease, and then a final increase. This image can be used to represent business trends, financial analysis, stock market data, or any data that shows changes over time.
Free with trial A graph with a red line and a green line. This could represent a decrease in one variable and an increase in another. Increase decrease graph illustrations A graph with a red line and a green line
Free with trial Euro currency up down icon. Europe money increase and decrease sign symbol vector. Increase decrease graph vectors Euro currency up down icon. Europe money increase and decrease sign symbol
Free with trial Arrow percent icon vector on black square. Increase and decrease percentage sign symbol. Increase decrease graph vectors Arrow percent icon on black square. Increase and decrease percentage sign symbol
Free with trial Up and down arrow icon on black circle. Increase and decrease illustration concept. Increase decrease graph vectors Up and down arrow icon on black circle. Increase and decrease concept. Up and down arrow icon on black circle. Increase and decrease illustration concept
Free with trial Euro down and up icon. Europe currency decrease and increase sign symbol vector. Increase decrease graph vectors Euro down and up icon. Europe currency decrease and increase sign symbol
Free with trial Up and down percent icon. Increase and decrease percentage sign. Growth and decline symbol vector. Increase decrease graph vectors Up and down percent icon. Increase and decrease percentage sign. Growth and decline symbol
Free with trial Up and down arrow icon in rounded shape. Increase and decrease illustration concept. Increase decrease graph vectors Up and down arrow icon in rounded shape. Increase and decrease concept. Up and down arrow icon in rounded shape. Increase and decrease illustration concept
Free with trial Arrow percent icon set on black circle. Increase and decrease percentage sign symbol vector. Increase decrease graph vectors Arrow percent icon set on black circle. Increase and decrease percentage sign symbol
Free with trial Calculator alongside arrows indicating increase and decrease, and a line graph with fluctuations. Ideal for finance, budgeting, economics, analysis, statistics, decision-making, simple flat metaphor. Increase decrease graph illustrations Calculator with Arrows and Graph Representing Financial Analysis and Data Trends. Calculator alongside arrows indicating increase and decrease, and a line graph with fluctuations. Ideal for finance, budgeting, economics, analysis, statistics, decision-making, simple flat metaphor
Free with trial Quality increase and cost optimization to improve efficiency and profit. Businessman with quality control growth graph and cost reduction, Effective business, Efficient Risk. Increase decrease graph vectors Quality increase and cost optimization to improve efficiency and profit. Businessman with quality control growth graph and cost
Free with trial Growth and loss arrow icon on black circle. Increase and decrease sign symbol illustration. Increase decrease graph vectors Growth and loss arrow icon on black circle. Increase and decrease sign symbol
Free with trial Declining Bar Graph with Arrow Showing Increase and Downward Trend. Increase decrease graph vectors Declining Bar Graph with Arrow Showing Increase and Downward Trend
Free with trial Up and down arrow icon. Rising and falling sign symbol. Increase and decrease illustration concept. Increase decrease graph vectors Up and down arrow icon. Rising and falling sign symbol. Increase and decrease concept
Free with trial This image showcases a collection of twenty distinct vector icons, each illustrating various representations of increase and decrease graphs. Increase decrease graph vectors Collection of Twenty Vector Icons Depicting Increase and Decrease Graphs. This image showcases a collection of twenty distinct vector icons, each illustrating various representations of increase and decrease graphs.
Free with trial Graph line icons. Interest rate, AI generate, Inflation icons. Set of Chart presentation, Report, Increase growth graph icons. Analytics testing, Falling demand, Pie chart report. Vector. Increase decrease graph vectors Graph line icons. Set of Chart presentation, Report and Increase growth graph icons. App line icons. Vector. Graph line icons. Interest rate, AI generate, Inflation icons. Set of Chart presentation, Report, Increase growth graph icons. Analytics testing, Falling demand, Pie chart report. Vector
Free with trial A collection of icons Decrease report, progress report, Upward report, Downward report, Profit increase, Profit decrease, icon. Increase decrease graph vectors Decrease report, progress report, Upward report, Downward report, Profit increase, Profit decrease, icon
Free with trial A collection of icons Growth, loss, Upward report, Downward report, Sales decrease, Sales increase, icon. Increase decrease graph vectors Growth, loss, Upward report, Downward report, Sales decrease, Sales increase, icon
Free with trial Increase decrease editable stroke line icons isolated on white background. Increase decrease graph vectors Increase decrease editable stroke line icons isolated on white background
Free with trial Dollar up and down icon on circle line. USD currency arrow increase and decrease sign symbol vector. Increase decrease graph vectors Dollar up and down icon on circle line. USD currency arrow increase and decrease sign symbol
Free with trial Growth and loss arrow icon on circle line. Increase and decrease sign symbol illustration. Increase decrease graph vectors Growth and loss arrow icon on circle line. Increase and decrease sign symbol
Free with trial Percent growth and decline arrow icon vector. Increase and decrease percentage concept. Increase decrease graph vectors Percent growth and decline arrow icon. Increase and decrease percentage concept
Free with trial Dollar up and down icon on black circle. USD currency arrow increase and decrease sign symbol vector. Increase decrease graph vectors Dollar up and down icon on black circle. USD currency arrow increase and decrease sign symbol
Free with trial Increase and decrease dollar arrow icon. USD up and down sign symbol vector. Increase decrease graph vectors Increase and decrease dollar arrow icon. USD up and down sign symbol
Free with trial A collection of icons Upward graph, Downward graph, Growth chart, Decrease chart, Sales Analysis, Progress graph, icon. Increase decrease graph vectors Upward graph, Downward graph, Growth chart, Decrease chart, Sales Analysis, Progress graph, icon
Free with trial Set of Chart presentation, Report, Increase growth graph icons. Design shape elements. Graph line icons. Analytics testing, Falling demand, Pie chart report. Calendar statistics, Stats. Vector. Increase decrease graph vectors Graph line icons. Set of Chart presentation, Report and Increase growth graph icons. Design elements. Vector. Set of Chart presentation, Report, Increase growth graph icons. Design shape elements. Graph line icons. Analytics testing, Falling demand, Pie chart report. Calendar statistics, Stats. Vector
Free with trial Percent growth and decline icon on black circle. Increase and decrease percentage arrow sign symbol vector. Increase decrease graph vectors Percent growth and decline icon on black circle. Increase and decrease percentage arrow sign symbol
Free with trial Percent growth decline arrow icon vector on black circle. Increase and decrease percentage sign symbol. Increase decrease graph vectors Percent growth decline arrow icon on black circle. Increase and decrease percentage sign symbol
Free with trial Dollar arrow up and down icon vector. USD currency increase and decrease concept. Increase decrease graph vectors Dollar arrow up and down icon. USD currency increase and decrease concept
Free with trial A person's open palm supports a glowing digital graph illustrating a decrease in cost and an increase in quality, set against a dark background. Increase decrease graph illustrations Hand holding glowing graph showing cost decreasing and quality increasing palm open. A person's open palm supports a glowing digital graph illustrating a decrease in cost and an increase in quality, set against a dark background
Free with trial Dollar arrow up and down outline icon vector. USD increase and decrease sign symbol. Increase decrease graph vectors Dollar arrow up and down outline icon. USD increase and decrease sign symbol
Free with trial Set line Financial growth decrease, increase, Diamond and Wallet with money icon. Vector. Increase decrease graph illustrations Set line Financial growth decrease, increase, Diamond and Wallet with money icon. Vector
Free with trial Dollar arrow up and down icon. USD currency increase and decrease sign symbol vector. Increase decrease graph vectors Dollar arrow up and down icon. USD currency increase and decrease sign symbol
Free with trial Dollar up and down icon vector. USD currency arrow increase and decrease sign symbol. Increase decrease graph vectors Dollar up and down icon. USD currency arrow increase and decrease sign symbol
Free with trial Set Graph, chart, diagram, Arrow and Financial growth decrease. White square button. Vector. Increase decrease graph illustrations Set Graph, chart, diagram, Arrow and Financial growth decrease. White square button. Vector
Free with trial Set line Financial growth decrease, Casino signboard, increase and Dart arrow icon. Vector. Increase decrease graph vectors Set line Financial growth decrease, Casino signboard, increase and Dart arrow icon. Vector
Free with trial A collection of icons Decrease, Intersection graph, decrease, Intersect graph, Connection network, Hierarchy structure, icon. Increase decrease graph vectors Decrease, Intersection graph, decrease, Intersect graph, Connection network, Hierarchy structure, icon
Free with trial Percent growth decline arrow icon. Increase and decrease percentage sign symbol vector. Increase decrease graph vectors Percent growth decline arrow icon. Increase and decrease percentage sign symbol
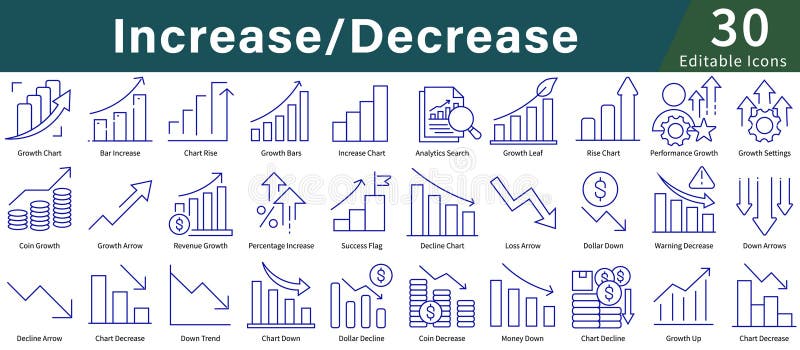
Free with trial Icons illustrating concepts of "Increase Decrease," using simple blue line art. Features include graphs and charts with upward and downward arrows, coins, dollar symbols, and percentage signs. Icons depict growth, decline, analytics, and performance tracking. Suitable for business, finance, or data analysis themes, these icons provide a visual representation of financial trends and statistics, making abstract concepts clear and easily understandable. The design is minimalistic and user-friendly, aimed at enhancing clarity in presentations and reports. Increase decrease graph vectors Increase Decrease Icon Set in Line Style with Editable Vector for Growth, Analytics, Charts, and Data Visualization. Icons illustrating concepts of "Increase Decrease," using simple blue line art. Features include graphs and charts with upward and downward arrows, coins, dollar symbols, and percentage signs. Icons depict growth, decline, analytics, and performance tracking. Suitable for business, finance, or data analysis themes, these icons provide a visual representation of financial trends and statistics, making abstract concepts clear and easily understandable. The design is minimalistic and user-friendly, aimed at enhancing clarity in presentations and reports.
Free with trial Dollar arrow up and down outline icon on black circle. USD increase and decrease sign symbol vector. Increase decrease graph vectors Dollar arrow up and down outline icon on black circle. USD increase and decrease sign symbol
Free with trial Up and down dollar arrow outline icon on black circle. Increase and decrease USD sign symbol vector. Increase decrease graph vectors Up and down dollar arrow outline icon on black circle. Increase and decrease USD sign symbol
Free with trial Up and down dollar arrow outline icon on circle line. Increase and decrease USD sign symbol vector. Increase decrease graph vectors Up and down dollar arrow outline icon on circle line. Increase and decrease USD sign symbol
Free with trial Set line Laptop with browser window Browser Cloud technology data transfer Financial growth increase decrease Magnifying glass and delete Online shopping on screen and Server icon. Vector. Increase decrease graph vectors Set line Laptop with browser window, Browser, Cloud technology data transfer, Financial growth increase, decrease. Set line Laptop with browser window Browser Cloud technology data transfer Financial growth increase decrease Magnifying glass and delete Online shopping on screen and Server icon. Vector.
Free with trial Set Financial growth increase, Casino chips, decrease and Online sports betting icon with long shadow. Vector. Increase decrease graph vectors Set Financial growth increase, Casino chips, decrease and Online sports betting icon with long shadow. Vector
Free with trial Set Pie chart infographic, Graph, chart, diagram, Arrow, Financial growth decrease, and Target icon. Vector. Increase decrease graph vectors Set Pie chart infographic, Graph, chart, diagram, Arrow, Financial growth decrease, and Target icon. Vector
Free with trial Set line Casino chip with dollar, Financial growth decrease, increase and Lottery ticket. Glowing neon icon. Vector. Increase decrease graph vectors Set line Casino chip with dollar, Financial growth decrease, increase and Lottery ticket. Glowing neon icon. Vector
Free with trial Set line Financial growth decrease, Document with graph chart, Cloud download and upload and Data analysis icon. Vector. Increase decrease graph illustrations Set line Financial growth decrease, Document with graph chart, Cloud download and upload and Data analysis icon. Vector
Free with trial Set line Graph, chart, diagram, Pie infographic, Financial growth decrease and icon. Vector. Increase decrease graph vectors Set line Graph, chart, diagram, Pie infographic, Financial growth decrease and icon. Vector
Free with trial Set line Old hourglass with sand, Graph, chart, diagram, Financial growth decrease and Factory. White rectangle button. Vector. Increase decrease graph vectors Set line Old hourglass with sand, Graph, chart, diagram, Financial growth decrease and Factory. White rectangle button
Free with trial Set Financial growth decrease Magnifying glass with check mark Graph chart infographic Search engine Website stocks market Browser shield window and Mobile phone icon. Vector. Increase decrease graph illustrations Set Financial growth decrease, Magnifying glass with check mark, Graph chart infographic, Search engine, Website stocks. Set Financial growth decrease Magnifying glass with check mark Graph chart infographic Search engine Website stocks market Browser shield window and Mobile phone icon. Vector.
Free with trial A detailed line graph visualization titled Global Climate Trends presents annual data from 2011 through 2013, plotting precipitation levels and CO2 emissions on the y-axis against years on the x-axis, where a blue line indicates a steady increase in precipitation over time, a green line shows corresponding CO2 levels, and a separate green trend line suggests a potential decrease in another. Increase decrease graph illustrations A line graph showing global climate trends from 2011 to 2013 with precipitation and CO2 levels visualized in blue and green. A detailed line graph visualization titled Global Climate Trends presents annual data from 2011 through 2013, plotting precipitation levels and CO2 emissions on the y-axis against years on the x-axis, where a blue line indicates a steady increase in precipitation over time, a green line shows corresponding CO2 levels, and a separate green trend line suggests a potential decrease in another
Free with trial Earning Money increase decrease icon with arrow symbol profit and loss vector icon illustration cost rising revenue design. Increase decrease graph vectors Earning Money increase decrease icon with arrow symbol profit and loss vector icon illustration cost rising revenue
Free with trial Chart arrows up and down. Green and red arrows. Decrease and increase graph vector illustration. Increase decrease graph vectors Chart arrows set. Chart arrows up and down. Green and red arrows. Decrease and increase graph vector illustration
Free with trial A cartoon woman with brown hair in a ponytail, wearing a blue shirt and red pants, stands confidently between two bar graphs. The green graph on the left shows an increase, while the purple graph on the right shows a decrease. The image is a simple, illustrative representation of data analysis or business concepts. Increase decrease graph vectors Woman Standing Between Two Bar Graphs. A cartoon woman with brown hair in a ponytail, wearing a blue shirt and red pants, stands confidently between two bar graphs. The green graph on the left shows an increase, while the purple graph on the right shows a decrease. The image is a simple, illustrative representation of data analysis or business concepts.
Free with trial A set of money growth and decrease icons featuring coins and directional arrows, indicating financial increase and decline. These images represent concepts of economic growth, loss, and currency fluctuation, suitable for various financial and business design projects. Increase decrease graph vectors Set of Money Growth and Decrease Icons with Arrows and Coins. A set of money growth and decrease icons featuring coins and directional arrows, indicating financial increase and decline. These images represent concepts of economic growth, loss, and currency fluctuation, suitable for various financial and business design projects
Free with trial A flat design vector illustration showing a graph with rising and falling bars, marked by green and red arrows indicating increase and decrease. Ideal for financial concepts. Increase decrease graph vectors Bar chart showing positive and negative data trends. A flat design vector illustration showing a graph with rising and falling bars, marked by green and red arrows indicating increase and decrease. Ideal for financial concepts
Free with trial The graph displays two lines, one green and one red. The green line is ascending, indicating growth or progress, while the red line is descending, suggesting a decline or decrease. Increase decrease graph illustrations A graph with a green line and a red line. The graph displays two lines, one green and one red. The green line is ascending, indicating growth or progress, while the red line is descending, suggesting a decline or decrease
Free with trial Arrow 3d chart graph pointer, vector illustration. Up and down forward arrow, motion and navigation symbol, financial growth concept. Web design elements crease of decrease sign. Increase decrease graph vectors Arrow navigation pointer, chart graph. Arrow 3d chart graph pointer, vector illustration. Up and down forward arrow, motion and navigation symbol, financial growth concept. Web design elements crease of decrease sign
Free with trial Set line Financial growth decrease, Hierarchy organogram chart, Graph, chart, diagram and Location. Gradient color icons. Vector. Increase decrease graph vectors Set line Financial growth decrease, Hierarchy organogram chart, Graph, chart, diagram and Location. Gradient color icons
Free with trial Two flat design icons with color. One depicts an upward bar chart with a blue arrow and percentage, the other a downward bar chart with a grey arrow and percentage. Increase decrease graph vectors Color Bar Chart Icons for Increase and Decrease graph Ai-Generated. Two flat design icons with color. One depicts an upward bar chart with a blue arrow and percentage, the other a downward bar chart with a grey arrow and percentage
Free with trial Set of 16 black and white graph icons in a 4x4 grid. Each icon depicts variations of bar charts with upward and downward arrows, suggesting growth or decline. Some include additional elements like magnifying glasses, checkmarks, and data points connected by lines. Icons vary slightly in design, representing different data trends with simple, bold lines on a white background, ideal for business and statistical representation. Increase decrease graph vectors Graph icon set. Increase and decrease graph icon. Growth icon. Graph chart icons. Icon set. 16 icons. Set of 16 black and white graph icons in a 4x4 grid. Each icon depicts variations of bar charts with upward and downward arrows, suggesting growth or decline. Some include additional elements like magnifying glasses, checkmarks, and data points connected by lines. Icons vary slightly in design, representing different data trends with simple, bold lines on a white background, ideal for business and statistical representation.
Free with trial The image depicts a hand adjusting a graph with two key metrics: Quality and Cost. The Quality metric is represented by a green upward arrow, indicating an increase in quality. Conversely, the Cost metric is represented by a red downward arrow, indicating a decrease in cost. This visual metaphor emphasizes the importance of balancing these two critical factors in business operations to achieve. Increase decrease graph illustrations Balancing quality and cost in business performance. The image depicts a hand adjusting a graph with two key metrics: Quality and Cost. The Quality metric is represented by a green upward arrow, indicating an increase in quality. Conversely, the Cost metric is represented by a red downward arrow, indicating a decrease in cost. This visual metaphor emphasizes the importance of balancing these two critical factors in business operations to achieve
Free with trial 3d bar graph illustrating financial growth with upward green arrow and downward red arrows indicating trends. Increase decrease graph vectors Bar graph rising with arrows showing increase decrease. 3d bar graph illustrating financial growth with upward green arrow and downward red arrows indicating. 3d bar graph illustrating financial growth with upward green arrow and downward red arrows indicating trends
Free with trial A 3D illustration of a stack of golden coins with an decrease and increase arrow graph, symbolizing financial growth and success. financial freedom, wealth management, economic growth, Financial Growth, Growing Wealth. Increase decrease graph vectors Ggrowing wealth financial success, rising profits investment. A 3D illustration of a stack of golden coins with an decrease and increase arrow graph, symbolizing financial growth and success. financial freedom, wealth management, economic growth, Financial Growth, Growing Wealth
Free with trial A vertical bar graph displays monthly service reach statistics with six colored sections representing different months, showing service growth from approximately $20,000 to $30,000 in the first quarter, fluctuations between 1,500 and 2,500 in the second quarter, a decrease followed by slight recovery in service requests during the third quarter, and a significant increase from around 3,500 to 4,. Increase decrease graph illustrations Business growth bar chart showing monthly service reach statistics with colorful data visualization and performance metrics. A vertical bar graph displays monthly service reach statistics with six colored sections representing different months, showing service growth from approximately $20,000 to $30,000 in the first quarter, fluctuations between 1,500 and 2,500 in the second quarter, a decrease followed by slight recovery in service requests during the third quarter, and a significant increase from around 3,500 to 4,
Free with trial A clean, minimalist smartphone app interface displays a spending tracker. A bar graph shows spending increase, highlighting financial growth. The design is black and white, emphasizing data clarity. Increase decrease graph illustrations Smartphone App UI: Minimalist Black & White Spending Tracker with Rising Graph. A clean, minimalist smartphone app interface displays a spending tracker. A bar graph shows spending increase, highlighting financial growth. The design is black and white, emphasizing data clarity
Free with trial Several stacks of gold coins are arranged in a rising graph-like pattern, with white tooth models placed on some of the stacks. The varying heights of the coin stacks visually suggest an increase or decrease in value or cost. The teeth are clean and white, symbolizing dental health. The backdrop is a solid, bright blue, creating a clear separation and focus on the central The conveys a message. Increase decrease graph illustrations Dental health cost concept with teeth on rising coin stacks against blue. Several stacks of gold coins are arranged in a rising graph-like pattern, with white tooth models placed on some of the stacks. The varying heights of the coin stacks visually suggest an increase or decrease in value or cost. The teeth are clean and white, symbolizing dental health. The backdrop is a solid, bright blue, creating a clear separation and focus on the central The conveys a message
Free with trial The image is a combination of a bar and line graph. The blue bars represent individual data points, while the red line connects these points to show the overall trend. The graph demonstrates an upward trend with some fluctuations, indicating an overall increase in values over time. Increase decrease graph illustrations A bar and line graph showing a trend of increasing values over time with fluctuations. The image is a combination of a bar and line graph. The blue bars represent individual data points, while the red line connects these points to show the overall trend. The graph demonstrates an upward trend with some fluctuations, indicating an overall increase in values over time
Free with trial Where the price will go up or down. Increase or decrease of the indicator. Market uncertainty and price speculation trends. Forecasting challenges and investor sentiment shifts. Increase decrease graph illustrations Where the price will go up or down. Increase or decrease of the indicator. Market uncertainty and price speculation trends
Free with trial Where the price will go up or down. Increase or decrease of the indicator. Market uncertainty and price speculation trends. Forecasting challenges and investor sentiment shifts. Increase decrease graph illustrations Where the price will go up or down. Increase or decrease of the indicator. Market uncertainty and price speculation trends
Free with trial Where the price will go up or down. Increase or decrease of the indicator. Market uncertainty and price speculation trends. Forecasting challenges and investor sentiment shifts. Increase decrease graph illustrations Where the price will go up or down. Increase or decrease of the indicator. Market uncertainty and price speculation trends