Free with trial Where the price will go up or down. Increase or decrease of the indicator. Market uncertainty and price speculation trends. Forecasting challenges and investor sentiment shifts. Increase decrease graph illustrations Where the price will go up or down. Increase or decrease of the indicator. Market uncertainty and price speculation trends
Free with trial Graph or block diagram shows the increase or decrease of shares, which means financial loss or gain -. Increase decrease graph illustrations Graph or block diagram shows the increase or decrease of shares, which means financial loss or gain
Free with trial Graph or block diagram shows the increase or decrease of shares, which means financial loss or gain -. Increase decrease graph illustrations Graph or block diagram shows the increase or decrease of shares, which means financial loss or gain
Free with trial A set of twenty-two black chart icons, illustrating various graph types on a white background. The icons feature line graphs, bar graphs, and pie charts, each depicting trends such as growth, decline, and fluctuations. Magnifying glass icons are used to represent analysis. The charts convey concepts of data visualization, statistical analysis, and business metrics tracking. The minimalistic design is characterized by simple, clean lines and solid fill, suitable for use in reports, presentations, or digital interfaces. Increase decrease graph vectors Increase and decrease glyph solid icons collection. A set of twenty-two black chart icons, illustrating various graph types on a white background. The icons feature line graphs, bar graphs, and pie charts, each depicting trends such as growth, decline, and fluctuations. Magnifying glass icons are used to represent analysis. The charts convey concepts of data visualization, statistical analysis, and business metrics tracking. The minimalistic design is characterized by simple, clean lines and solid fill, suitable for use in reports, presentations, or digital interfaces.
Free with trial Two adjacent panels display a line graph icon with dual zigzagging lines and circular data points. On the left, the icon is black on a white background. On the right, it's white on a dark background. Both icons feature the line graph at a 45-degree angle, suggesting an increase in data points, with round nodes indicating specific values along the line. The simplistic design focuses on contrast and clarity, ideal for visual representation in data analysis or presentation templates. Increase decrease graph vectors Increase Icon. Solid glyph series icon. Two adjacent panels display a line graph icon with dual zigzagging lines and circular data points. On the left, the icon. Two adjacent panels display a line graph icon with dual zigzagging lines and circular data points. On the left, the icon is black on a white background. On the right, it's white on a dark background. Both icons feature the line graph at a 45-degree angle, suggesting an increase in data points, with round nodes indicating specific values along the line. The simplistic design focuses on contrast and clarity, ideal for visual representation in data analysis or presentation templates.
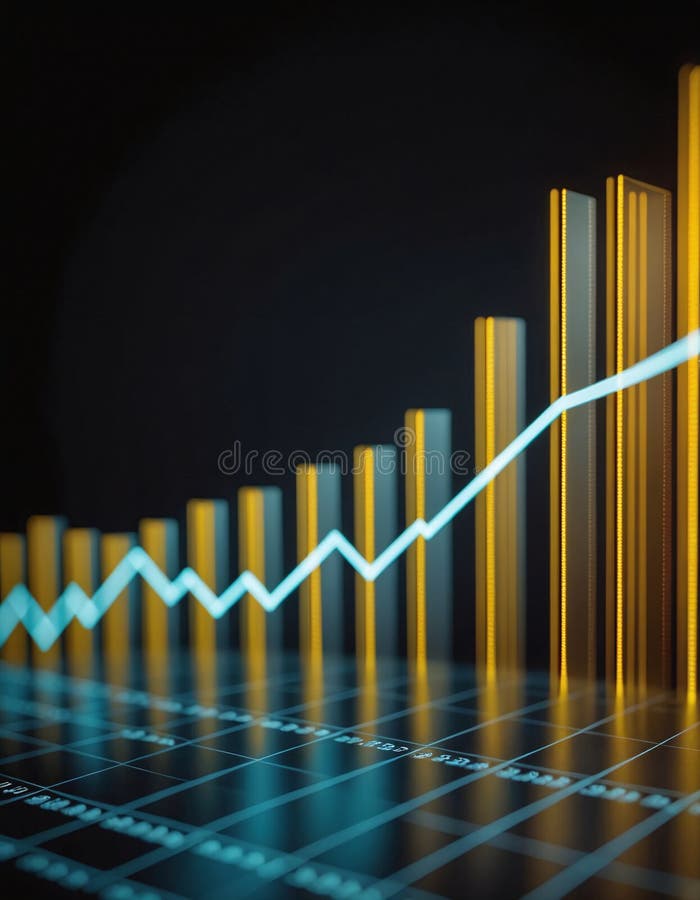
Free with trial Graph or block diagram shows the increase or decrease of shares, which means financial loss or gain -. Increase decrease graph illustrations Graph or block diagram shows the increase or decrease of shares, which means financial loss or gain
Free with trial Graph or block diagram shows the increase or decrease of shares, which means financial loss or gain -. Increase decrease graph illustrations Graph or block diagram shows the increase or decrease of shares, which means financial loss or gain
Free with trial Graph or block diagram shows the increase or decrease of shares, which means financial loss or gain -. Increase decrease graph illustrations Graph or block diagram shows the increase or decrease of shares, which means financial loss or gain
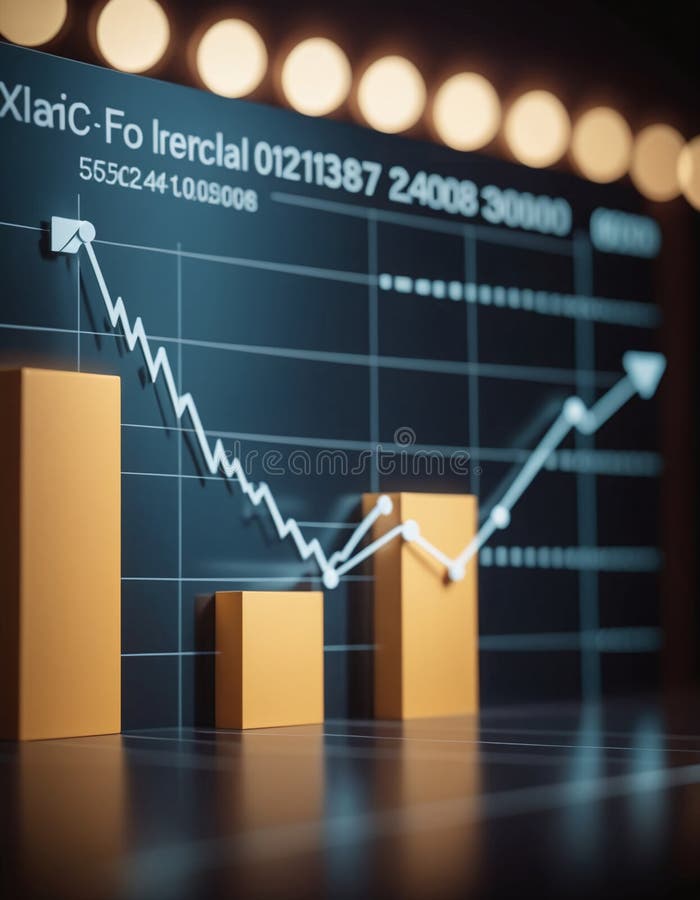
Free with trial Graph or block diagram shows the increase or decrease of shares, which means financial loss or gain -. Increase decrease graph illustrations Graph or block diagram shows the increase or decrease of shares, which means financial loss or gain
Free with trial Graph or block diagram shows the increase or decrease of shares, which means financial loss or gain -. Increase decrease graph illustrations Graph or block diagram shows the increase or decrease of shares, which means financial loss or gain
Free with trial Graph or block diagram shows the increase or decrease of shares, which means financial loss or gain -. Increase decrease graph illustrations Graph or block diagram shows the increase or decrease of shares, which means financial loss or gain
Free with trial Graph or block diagram shows the increase or decrease of shares, which means financial loss or gain -. Increase decrease graph illustrations Graph or block diagram shows the increase or decrease of shares, which means financial loss or gain
Free with trial Graph or block diagram shows the increase or decrease of shares, which means financial loss or gain -. Increase decrease graph illustrations Graph or block diagram shows the increase or decrease of shares, which means financial loss or gain
Free with trial Graph or block diagram shows the increase or decrease of shares, which means financial loss or gain -. Increase decrease graph illustrations Graph or block diagram shows the increase or decrease of shares, which means financial loss or gain
Free with trial Graph or block diagram shows the increase or decrease of shares, which means financial loss or gain -. Increase decrease graph illustrations Graph or block diagram shows the increase or decrease of shares, which means financial loss or gain
Free with trial Graph or block diagram shows the increase or decrease of shares, which means financial loss or gain -. Increase decrease graph illustrations Graph or block diagram shows the increase or decrease of shares, which means financial loss or gain
Free with trial Graph or block diagram shows the increase or decrease of shares, which means financial loss or gain -. Increase decrease graph illustrations Graph or block diagram shows the increase or decrease of shares, which means financial loss or gain
Free with trial Graph or block diagram shows the increase or decrease of shares, which means financial loss or gain -. Increase decrease graph illustrations Graph or block diagram shows the increase or decrease of shares, which means financial loss or gain
Free with trial Graph or block diagram shows the increase or decrease of shares, which means financial loss or gain -. Increase decrease graph illustrations Graph or block diagram shows the increase or decrease of shares, which means financial loss or gain
Free with trial Graph or block diagram shows the increase or decrease of shares, which means financial loss or gain -. Increase decrease graph illustrations Graph or block diagram shows the increase or decrease of shares, which means financial loss or gain
Free with trial Graph or block diagram shows the increase or decrease of shares, which means financial loss or gain -. Increase decrease graph illustrations Graph or block diagram shows the increase or decrease of shares, which means financial loss or gain
Free with trial Graph or block diagram shows the increase or decrease of shares, which means financial loss or gain -. Increase decrease graph illustrations Graph or block diagram shows the increase or decrease of shares, which means financial loss or gain
Free with trial Graph or block diagram shows the increase or decrease of shares, which means financial loss or gain -. Increase decrease graph illustrations Graph or block diagram shows the increase or decrease of shares, which means financial loss or gain
Free with trial Graph or block diagram shows the increase or decrease of shares, which means financial loss or gain -. Increase decrease graph illustrations Graph or block diagram shows the increase or decrease of shares, which means financial loss or gain
Free with trial Graph or block diagram shows the increase or decrease of shares, which means financial loss or gain -. Increase decrease graph illustrations Graph or block diagram shows the increase or decrease of shares, which means financial loss or gain
Free with trial Graph or block diagram shows the increase or decrease of shares, which means financial loss or gain -. Increase decrease graph illustrations Graph or block diagram shows the increase or decrease of shares, which means financial loss or gain
Free with trial Graph or block diagram shows the increase or decrease of shares, which means financial loss or gain -. Increase decrease graph illustrations Graph or block diagram shows the increase or decrease of shares, which means financial loss or gain
Free with trial Graph or block diagram shows the increase or decrease of shares, which means financial loss or gain -. Increase decrease graph illustrations Graph or block diagram shows the increase or decrease of shares, which means financial loss or gain
Free with trial Graph or block diagram shows the increase or decrease of shares, which means financial loss or gain -. Increase decrease graph illustrations Graph or block diagram shows the increase or decrease of shares, which means financial loss or gain
Free with trial Graph or block diagram shows the increase or decrease of shares, which means financial loss or gain -. Increase decrease graph illustrations Graph or block diagram shows the increase or decrease of shares, which means financial loss or gain
Free with trial Graph or block diagram shows the increase or decrease of shares, which means financial loss or gain -. Increase decrease graph illustrations Graph or block diagram shows the increase or decrease of shares, which means financial loss or gain
Free with trial Graph or block diagram shows the increase or decrease of shares, which means financial loss or gain -. Increase decrease graph illustrations Graph or block diagram shows the increase or decrease of shares, which means financial loss or gain
Free with trial Graph or block diagram shows the increase or decrease of shares, which means financial loss or gain -. Increase decrease graph illustrations Graph or block diagram shows the increase or decrease of shares, which means financial loss or gain
Free with trial Graph or block diagram shows the increase or decrease of shares, which means financial loss or gain -. Increase decrease graph illustrations Graph or block diagram shows the increase or decrease of shares, which means financial loss or gain
Free with trial Graph or block diagram shows the increase or decrease of shares, which means financial loss or gain -. Increase decrease graph illustrations Graph or block diagram shows the increase or decrease of shares, which means financial loss or gain
Free with trial Graph or block diagram shows the increase or decrease of shares, which means financial loss or gain -. Increase decrease graph illustrations Graph or block diagram shows the increase or decrease of shares, which means financial loss or gain
Free with trial Graph or block diagram shows the increase or decrease of shares, which means financial loss or gain -. Increase decrease graph illustrations Graph or block diagram shows the increase or decrease of shares, which means financial loss or gain
Free with trial Graph or block diagram shows the increase or decrease of shares, which means financial loss or gain -. Increase decrease graph illustrations Graph or block diagram shows the increase or decrease of shares, which means financial loss or gain
Free with trial Graph or block diagram shows the increase or decrease of shares, which means financial loss or gain -. Increase decrease graph illustrations Graph or block diagram shows the increase or decrease of shares, which means financial loss or gain
Free with trial Graph or block diagram shows the increase or decrease of shares, which means financial loss or gain -. Increase decrease graph illustrations Graph or block diagram shows the increase or decrease of shares, which means financial loss or gain
Free with trial Graph or block diagram shows the increase or decrease of shares, which means financial loss or gain -. Increase decrease graph illustrations Graph or block diagram shows the increase or decrease of shares, which means financial loss or gain
Free with trial Graph or block diagram shows the increase or decrease of shares, which means financial loss or gain -. Increase decrease graph illustrations Graph or block diagram shows the increase or decrease of shares, which means financial loss or gain
Free with trial Graph or block diagram shows the increase or decrease of shares, which means financial loss or gain -. Increase decrease graph illustrations Graph or block diagram shows the increase or decrease of shares, which means financial loss or gain
Free with trial Graph or block diagram shows the increase or decrease of shares, which means financial loss or gain -. Increase decrease graph illustrations Graph or block diagram shows the increase or decrease of shares, which means financial loss or gain
Free with trial Graph or block diagram shows the increase or decrease of shares, which means financial loss or gain -. Increase decrease graph illustrations Graph or block diagram shows the increase or decrease of shares, which means financial loss or gain
Free with trial Graph or block diagram shows the increase or decrease of shares, which means financial loss or gain -. Increase decrease graph illustrations Graph or block diagram shows the increase or decrease of shares, which means financial loss or gain
Free with trial Graph or block diagram shows the increase or decrease of shares, which means financial loss or gain -. Increase decrease graph illustrations Graph or block diagram shows the increase or decrease of shares, which means financial loss or gain
Free with trial Graph or block diagram shows the increase or decrease of shares, which means financial loss or gain -. Increase decrease graph illustrations Graph or block diagram shows the increase or decrease of shares, which means financial loss or gain
Free with trial Graph or block diagram shows the increase or decrease of shares, which means financial loss or gain -. Increase decrease graph illustrations Graph or block diagram shows the increase or decrease of shares, which means financial loss or gain
Free with trial Graph or block diagram shows the increase or decrease of shares, which means financial loss or gain -. Increase decrease graph illustrations Graph or block diagram shows the increase or decrease of shares, which means financial loss or gain
Free with trial Graph or block diagram shows the increase or decrease of shares, which means financial loss or gain -. Increase decrease graph illustrations Graph or block diagram shows the increase or decrease of shares, which means financial loss or gain
Free with trial Graph or block diagram shows the increase or decrease of shares, which means financial loss or gain -. Increase decrease graph illustrations Graph or block diagram shows the increase or decrease of shares, which means financial loss or gain
Free with trial Graph or block diagram shows the increase or decrease of shares, which means financial loss or gain -. Increase decrease graph illustrations Graph or block diagram shows the increase or decrease of shares, which means financial loss or gain
Free with trial Graph or block diagram shows the increase or decrease of shares, which means financial loss or gain -. Increase decrease graph illustrations Graph or block diagram shows the increase or decrease of shares, which means financial loss or gain
Free with trial Graph or block diagram shows the increase or decrease of shares, which means financial loss or gain -. Increase decrease graph illustrations Graph or block diagram shows the increase or decrease of shares, which means financial loss or gain
Free with trial Graph or block diagram shows the increase or decrease of shares, which means financial loss or gain -. Increase decrease graph illustrations Graph or block diagram shows the increase or decrease of shares, which means financial loss or gain
Free with trial Graph or block diagram shows the increase or decrease of shares, which means financial loss or gain -. Increase decrease graph illustrations Graph or block diagram shows the increase or decrease of shares, which means financial loss or gain
Free with trial Graph or block diagram shows the increase or decrease of shares, which means financial loss or gain -. Increase decrease graph illustrations Graph or block diagram shows the increase or decrease of shares, which means financial loss or gain
Free with trial Graph or block diagram shows the increase or decrease of shares, which means financial loss or gain -. Increase decrease graph illustrations Graph or block diagram shows the increase or decrease of shares, which means financial loss or gain
Free with trial Graph or block diagram shows the increase or decrease of shares, which means financial loss or gain -. Increase decrease graph illustrations Graph or block diagram shows the increase or decrease of shares, which means financial loss or gain
Free with trial Graph or block diagram shows the increase or decrease of shares, which means financial loss or gain -. Increase decrease graph illustrations Graph or block diagram shows the increase or decrease of shares, which means financial loss or gain
Free with trial Graph or block diagram shows the increase or decrease of shares, which means financial loss or gain -. Increase decrease graph illustrations Graph or block diagram shows the increase or decrease of shares, which means financial loss or gain
Free with trial Graph or block diagram shows the increase or decrease of shares, which means financial loss or gain -. Increase decrease graph illustrations Graph or block diagram shows the increase or decrease of shares, which means financial loss or gain
Free with trial Graph or block diagram shows the increase or decrease of shares, which means financial loss or gain -. Increase decrease graph illustrations Graph or block diagram shows the increase or decrease of shares, which means financial loss or gain
Free with trial Graph or block diagram shows the increase or decrease of shares, which means financial loss or gain -. Increase decrease graph illustrations Graph or block diagram shows the increase or decrease of shares, which means financial loss or gain
Free with trial Graph or block diagram shows the increase or decrease of shares, which means financial loss or gain -. Increase decrease graph illustrations Graph or block diagram shows the increase or decrease of shares, which means financial loss or gain
Free with trial Graph or block diagram shows the increase or decrease of shares, which means financial loss or gain -. Increase decrease graph illustrations Graph or block diagram shows the increase or decrease of shares, which means financial loss or gain
Free with trial Graph or block diagram shows the increase or decrease of shares, which means financial loss or gain -. Increase decrease graph illustrations Graph or block diagram shows the increase or decrease of shares, which means financial loss or gain
Free with trial A 3D illustration of a stack of silver dollar coins with an decrease and increase arrow graph, symbolizing financial growth and success, isolated, png, transparent, clipart, transparent background, cutout, cut-out. Increase decrease graph vectors A 3D illustration of a stack of golden coins. A 3D illustration of a stack of silver dollar coins with an decrease and increase arrow graph, symbolizing financial growth and success, isolated, png, transparent, clipart, transparent background, cutout, cut-out
Free with trial A 3D illustration of a stack of golden dollar coins with an decrease and increase arrow graph, symbolizing financial growth and success, isolated, png, transparent, clipart, transparent background, cutout, cut-out. Increase decrease graph vectors A 3D illustration of a stack of golden coins. A 3D illustration of a stack of golden dollar coins with an decrease and increase arrow graph, symbolizing financial growth and success, isolated, png, transparent, clipart, transparent background, cutout, cut-out
Free with trial Visualization shifting line graph illustration fluctuation increase, movement change, axis scale visualization shifting line graph. Increase decrease graph illustrations Visualization shifting line graph
Free with trial A blackboard with a graph on it and a potted plant next to it. The graph shows a downward trend, which could represent a decrease in sales or a decline in a particular stock. Increase decrease graph illustrations A blackboard with a graph on it and a potted plant next to it
Free with trial Up Down Accend Decend Increase Decrease Arrow Pointer Point Path Elevator Lift Rise Drop Black White Icon Sign Symbol Graphic Illustration Vector. Increase decrease graph vectors Up Down Accend Decend Increase Decrease Arrow Pointer Point Path Elevator Lift Rise Drop Black White Icon Sign Symbol Graphic Illu
Free with trial Profit increase and decrease graph, coin icon. Increase decrease graph vectors Profit increase and decrease graph
Free with trial Profit increase and decrease graph, coin icon. Increase decrease graph vectors Profit increase and decrease graph
Free with trial Profit increase and decrease graph, coin icon. Increase decrease graph vectors Profit increase and decrease graph
Free with trial Profit increase and decrease graph, coin icon. Increase decrease graph vectors Profit increase and decrease graph
Free with trial Profit increase and decrease graph, coin icon. Increase decrease graph vectors Profit increase and decrease graph
Free with trial Profit increase and decrease graph, coin icon. Increase decrease graph vectors Profit increase and decrease graph
Free with trial Modern rendered line graph with yellow marker points rising and falling vertically, forming a white trend line that fluctuates across the screen. The graph represents business data such as growth, decrease, profit, and market performance. Set against a blurred office background, the image has a clean, digital aesthetic ideal for financial presentations, company reports, startup pitches, and data analysis. This visual is suitable for showcasing trading performance, corporate strategy, and economic trends. Increase decrease graph illustrations Business Trend Line Graph Showing Growth and Market Fluctuations. Modern rendered line graph with yellow marker points rising and falling vertically, forming a white trend line that fluctuates across the screen. The graph represents business data such as growth, decrease, profit, and market performance. Set against a blurred office background, the image has a clean, digital aesthetic ideal for financial presentations, company reports, startup pitches, and data analysis. This visual is suitable for showcasing trading performance, corporate strategy, and economic trends.