Free with trial Set of sketched icons showing mutual fund nav increases and decreases with indian rupee signs on an alpha transparent base. Line decrease vectors Mutual fund nav trend sketch icons with rupee symbol alpha transparent. Set of sketched icons showing mutual fund nav increases and decreases with indian rupee signs on an alpha transparent base.
Free with trial Up and down profit arrows seamless pattern isolated on white background. Simple background. Line decrease vectors Up and down profit arrows seamless pattern isolated on white background
Free with trial Comprehensive cardiology icon. Representative moisture symbols. Healthcare medicine Vector. Essential healthcare emblem. EPS 10. Line decrease vectors Comprehensive cardiology icon. Representative moisture symbols. Healthcare medicine Vector. Essential healthcare emblem.
Free with trial Black smooth arrow moving in a downward and leftward direction, featuring three thin lines at its pointed tip, isolated on white background. Line decrease vectors Abstract smooth black arrow pointing down left with three lines at tip. Black smooth arrow moving in a downward and leftward direction, featuring three thin lines at its pointed tip, isolated on white background
Free with trial Stacks of gold coins are arranged in a triangular formation on a white background. Above them, a large, upward-pointing arrow signifies growth and financial prosperity. The coins and arrow are illustrated in a uniform golden hue, symbolizing wealth and economic advancement. Line decrease vectors Financial Growth Concept with Stacks of Gold Coins and Upward Arrow. Financial Growth Gold Coins. Growth Chart. Stacks of gold coins are arranged in a triangular formation on a white background. Above them, a large, upward-pointing arrow signifies growth and financial prosperity. The coins and arrow are illustrated in a uniform golden hue, symbolizing wealth and economic advancement.
Free with trial Abstract illustration of a financial graph with glowing lines on a dark background. The graph shows two distinct curves, one starting in cool blue tones and transitioning to warm orange hues, suggesting a shift in market trends or performance. The image conveys concepts of data analysis, growth, decline, and financial forecasting. Suitable for illustrating business reports, presentations, or articles related to finance, investment, and economics. Line decrease illustrations Abstract Financial Graph Illustration. Abstract illustration of a financial graph with glowing lines on a dark background. The graph shows two distinct curves, one starting in cool blue tones and transitioning to warm orange hues, suggesting a shift in market trends or performance. The image conveys concepts of data analysis, growth, decline, and financial forecasting. Suitable for illustrating business reports, presentations, or articles related to finance, investment, and economics.
Free with trial Reduce Affection Outline of a Heart Featuring a Bold Subtraction Symbol for Less. Line decrease vectors Heart Icon with a Minus Sign Symbolizing Decreased Love or Emotional Removal. Reduce Affection Outline of a Heart Featuring a Bold Subtraction Symbol for Less.
Free with trial The image showcases a smartphone displaying financial data visualizations, including line graphs and bar charts. Additional icons and graphics related to data analysis and finance surround the phone, emphasizing the digital and analytical nature of the content. This composition was generated by AI,. Line decrease illustrations Mobile Financial Data. The image showcases a smartphone displaying financial data visualizations, including line graphs and bar charts. Additional icons and graphics related to data analysis and finance surround the phone, emphasizing the digital and analytical nature of the content. This composition was generated by AI,
Free with trial Conceptual artwork displaying a blue rupee coin plunging down a green spiral funnel, illustrating the concepts of shrinking wealth, economic recession, and currency drop, alpha transparent, blue pen doodle. Line decrease vectors Financial crisis draining indian rupee coins in spiral, alpha transparent. Conceptual artwork displaying a blue rupee coin plunging down a green spiral funnel, illustrating the concepts of shrinking wealth, economic recession, and currency drop, alpha transparent, blue pen doodle.
Free with trial Business finance and growth icons illustrating statistics charts trends progress and success. Line decrease vectors Finance and growth icons showing progress and business performance blue navy. Business finance and growth icons illustrating statistics charts trends progress and success
Free with trial Discount percentage icon continuous outline drawing simple style finance vector art. Line decrease vectors Discount percentage icon continuous outline drawing simple style finance
Free with trial Logo design graphic concept creative premium vector stock image top sell. Line decrease vectors Dollar money arrow up down chart diagram inflation rate risk market business. Logo design graphic concept creative premium vector stock image top sell
Free with trial Blue circular halftone pattern features a dotted radial gradient transitioning from dense, darker blue dots outward to lighter blue. The dots decrease in size and density as they move away from the center, creating a ring-like effect on a white background. This abstract design is commonly used in graphic design and visual arts to convey dynamism and depth. Line decrease vectors Abstract blue circular halftone pattern with dotted radial gradient transition. Blue circular halftone pattern features a dotted radial gradient transitioning from dense, darker blue dots outward to lighter blue. The dots decrease in size and density as they move away from the center, creating a ring-like effect on a white background. This abstract design is commonly used in graphic design and visual arts to convey dynamism and depth.
Free with trial A drawn graphic illustration showing the Indian currency INR symbol dropping alongside a downward arrow, indicating financial loss, economic decline, and recession, isolated on an Alpha transparent background. Line decrease vectors Indian Rupee depreciation downward arrow stylized sketch Alpha transparent. A drawn graphic illustration showing the Indian currency INR symbol dropping alongside a downward arrow, indicating financial loss, economic decline, and recession, isolated on an Alpha transparent background.
Free with trial A drawn graphic showing the Indian currency INR symbol dropping alongside a downward red arrow, indicating recession and financial loss, isolated on an Alpha transparent background. Line decrease vectors Indian Rupee depreciation red arrow down stylized sketch Alpha transparent. A drawn graphic showing the Indian currency INR symbol dropping alongside a downward red arrow, indicating recession and financial loss, isolated on an Alpha transparent background.
Free with trial Minimal curved arrow pointing downward, representing direction, download, or movement. Clean design suitable for navigation, UI, and infographic use. Line decrease vectors Curved downward arrow icon simple navigation direction symbol black vector. Minimal curved arrow pointing downward, representing direction, download, or movement. Clean design suitable for navigation, UI, and infographic use
Free with trial A clear, black and white vector illustration of a lace knitting chart with a corresponding legend. The grid pattern contains various symbols representing different knitting stitches, such as knit, yarn over, and decreases. The legend on the right provides a key to decipher the symbols, making it a complete instructional guide. This graphic is perfect for craft blogs, knitting pattern books, DIY tutorials, hobby magazines, and any content related to needlework, textiles, and handmade crafts. The clean design is easy to read and understand. Line decrease illustrations Lace Knitting Chart and Stitch Legend. A clear, black and white vector illustration of a lace knitting chart with a corresponding legend. The grid pattern contains various symbols representing different knitting stitches, such as knit, yarn over, and decreases. The legend on the right provides a key to decipher the symbols, making it a complete instructional guide. This graphic is perfect for craft blogs, knitting pattern books, DIY tutorials, hobby magazines, and any content related to needlework, textiles, and handmade crafts. The clean design is easy to read and understand.
Free with trial Abstract dotted financial graph chart sparkling background. Vector minimal tech design. Line decrease vectors Abstract dotted financial graph chart sparkling background
Free with trial Colorful abstract background featuring a gradient transitioning from blue to green. It showcases a dynamic pattern of circular dots, which gradually decrease in size as they move rightward across the image. Curved lines subtly add a sense of movement and depth, creating an illusion of fluidity and dimension. The overall design evokes a sense of modernity and visual intrigue. Line decrease illustrations Abstract Gradient Background with Colorful Dots and Dynamic Curves. Colorful abstract background featuring a gradient transitioning from blue to green. It showcases a dynamic pattern of circular dots, which gradually decrease in size as they move rightward across the image. Curved lines subtly add a sense of movement and depth, creating an illusion of fluidity and dimension. The overall design evokes a sense of modernity and visual intrigue
Free with trial Resize and scale icons. Reduce, zoom and change, expand symbols, vector thin line ui arrows and hands. Size control outline icons set, enlarge, move, shrink or extend, maximize, full screen, minimize. Line decrease illustrations Resize and scale icons. Reduce, zoom, expand signs. Resize and scale icons. Reduce, zoom and change, expand symbols, vector thin line ui arrows and hands. Size control outline icons set, enlarge, move, shrink or extend, maximize, full screen, minimize
Free with trial Illustration of a growing sales funnel depth with a deep funnel filling with gold coins, a stream of downward arrows, and a simple payment terminal. Vector flat icon design on a white background for a prospect conversion illustration --chaos 30 --ar 16:9 --v 7 Job ID: 03afdd75-fca3-49f5-98d4-f73b21faf025. Line decrease illustrations Money Loss Concept Coins Falling Through Funnel into Pile, Money Decreasing Near Payment Terminal. Illustration of a growing sales funnel depth with a deep funnel filling with gold coins, a stream of downward arrows, and a simple payment terminal. Vector flat icon design on a white background for a prospect conversion illustration --chaos 30 --ar 16:9 --v 7 Job ID: 03afdd75-fca3-49f5-98d4-f73b21faf025
Free with trial Financial decline, coins falling, abstract design, graphic, stock photo. Line decrease illustrations Financial Growth Concept Golden Dollar Coins and Upward Trend Line on Dark Blue Background. Financial decline, coins falling, abstract design, graphic, stock photo
Free with trial A simple graphic illustrating debt reduction. The image features a line graph with a downward trend, transitioning from green to blue, culminating in an arrow pointing downwards towards a horizontal line. The text "5. Debt Reduction" is placed above the graph. This visual can be used to represent financial improvement, debt management, or economic progress. Line decrease vectors Debt Reduction Chart with Downward Arrow. A simple graphic illustrating debt reduction. The image features a line graph with a downward trend, transitioning from green to blue, culminating in an arrow pointing downwards towards a horizontal line. The text "5. Debt Reduction" is placed above the graph. This visual can be used to represent financial improvement, debt management, or economic progress.
Free with trial Colorful geometric pattern composed of interlocking polygons radiating from a central point. Dominant colors include blue, red, green, and purple. The design features symmetrical zigzagging lines creating a kaleidoscopic effect. Shapes decrease in size toward the center, forming a circular pattern, giving the appearance of depth and movement. The overall design is intricately layered, with each layer differing slightly in color and shape, contributing to a dynamic and visually engaging abstract design. Line decrease vectors Vibrant Geometric Pattern Background with Colorful Shapes and Abstract Design. Colorful geometric pattern composed of interlocking polygons radiating from a central point. Dominant colors include blue, red, green, and purple. The design features symmetrical zigzagging lines creating a kaleidoscopic effect. Shapes decrease in size toward the center, forming a circular pattern, giving the appearance of depth and movement. The overall design is intricately layered, with each layer differing slightly in color and shape, contributing to a dynamic and visually engaging abstract design.
Free with trial Red arrow going down stock icon on white background. Bankruptcy, financial market crash icon for your web site design, logo, app, UI. graph chart down trend symbol. chart going down sign. Line decrease vectors Red arrow going down stock icon on white background. Bankruptcy, financial market crash icon for your web site. Red arrow going down stock icon on white background. Bankruptcy, financial market crash icon for your web site design, logo, app, UI. graph chart down trend symbol.chart going down sign.
Free with trial A 3D rendered image depicting a financial graph with a prominent red arrow indicating a downward trend. The graph features a bar chart with several red bars, showing a decline in value. The background is a dark grid, emphasizing the data visualization. This image is ideal for representing financial losses, economic downturns, market crashes, or negative performance in business and investment contexts. Line decrease illustrations Red Arrow Downward Trend Graph with Bar Chart. A 3D rendered image depicting a financial graph with a prominent red arrow indicating a downward trend. The graph features a bar chart with several red bars, showing a decline in value. The background is a dark grid, emphasizing the data visualization. This image is ideal for representing financial losses, economic downturns, market crashes, or negative performance in business and investment contexts.
Free with trial Net zero solid icons collection. Containing customer ecology, sustainable, environmental etc icons. Line decrease vectors Net zero solid icons collection. Containing customer ecology, sustainable, environmental etc icons
Free with trial Black glyph icon representing a broken downward arrow, symbolizing decline, financial crisis, market downturn, failure, or negative trends. Ideal for business presentations, economic reports, data visualization, infographics, and conceptual designs indicating loss, recession, or problems. Simple, clean graphic illustration on a white background. Generated by AI. Line decrease vectors Declining Trend Broken Downward Arrow Icon. Black glyph icon representing a broken downward arrow, symbolizing decline, financial crisis, market downturn, failure, or negative trends. Ideal for business presentations, economic reports, data visualization, infographics, and conceptual designs indicating loss, recession, or problems. Simple, clean graphic illustration on a white background. Generated by AI
Free with trial This image depicts a sound wave spectrum with various colors representing different frequencies and amplitudes. The left side of the image shows a dense cluster of pink and purple waves, indicating high amplitude and frequency. The middle section transitions to blue, showing a decrease in amplitude and frequency. The right side features turquoise waves, indicating lower frequency and amplitude. Line decrease illustrations Colorful sound wave spectrum. This image depicts a sound wave spectrum with various colors representing different frequencies and amplitudes. The left side of the image shows a dense cluster of pink and purple waves, indicating high amplitude and frequency. The middle section transitions to blue, showing a decrease in amplitude and frequency. The right side features turquoise waves, indicating lower frequency and amplitude
Free with trial Up and down percentage icon set. Percentage growth and decline icons. Percent arrow up and down icon. Line decrease vectors Up and down percentage icon set. Percentage growth and decline icons. Percent arrow up and down icon
Free with trial Icons in two tones about energy management. Sustainable development Contains such icons as saving, regulation, price rise, consumption and efficiency. Editable stroke. Line decrease vectors Icons in two tones about energy management. Sustainable development
Free with trial A detailed black and white illustration of a knitting pattern stitch chart. This graphical guide features a grid with various symbols, icons, and abbreviations like 'k2tog' and 'ssk', representing different knitting stitches and techniques. The chart is organized by rows and columns, providing a visual map for creating intricate designs, particularly in lace knitting. This image is ideal for crafting websites, DIY tutorials, knitting books, hobby blogs, and instructional materials related to needlework, textiles, and handmade crafts. Line decrease illustrations Knitting Pattern Stitch Chart
Free with trial Reduction chart icon Vector symbol or sign set collection in black and white outline. Line decrease vectors Reduction chart icon Symbol mark in filled style. Reduction chart icon Vector symbol or sign set collection in black and white outline
Free with trial A minimalist, black and white line art icon depicting a swirling vortex or spiral. The design features concentric, curved lines that decrease in size towards the center, creating a sense of motion and depth. This versatile graphic can represent concepts like energy, movement, focus, or abstract patterns. Its clean, modern aesthetic makes it suitable for a wide range of applications, from web design and branding to educational materials and scientific illustrations. Line decrease vectors Abstract Swirl Icon. A minimalist, black and white line art icon depicting a swirling vortex or spiral. The design features concentric, curved lines that decrease in size towards the center, creating a sense of motion and depth. This versatile graphic can represent concepts like energy, movement, focus, or abstract patterns. Its clean, modern aesthetic makes it suitable for a wide range of applications, from web design and branding to educational materials and scientific illustrations.
Free with trial Icons in two colors about energy management. Sustainable development Contains such icons as saving, regulation, price rise, consumption and efficiency. Editable stroke. Line decrease vectors Icons in two colors about energy management. Sustainable development
Free with trial This striking abstract vector illustration features a dynamic spiral composed entirely of black squares, set against a clean white background. The squares decrease in size and density as they converge towards the center, creating a mesmerizing sense of depth and movement. This minimalist geometric design evokes concepts of progress, technology, data flow, and infinite expansion. Ideal for modern branding, corporate presentations, web backgrounds, app icons, or any project requiring a sleek, contemporary, and visually engaging graphic element. Line decrease vectors Geometric Black Square Spiral Abstract Design. This striking abstract vector illustration features a dynamic spiral composed entirely of black squares, set against a clean white background. The squares decrease in size and density as they converge towards the center, creating a mesmerizing sense of depth and movement. This minimalist geometric design evokes concepts of progress, technology, data flow, and infinite expansion. Ideal for modern branding, corporate presentations, web backgrounds, app icons, or any project requiring a sleek, contemporary, and visually engaging graphic element.
Free with trial A circular arrangement of colorful heart shapes creates a radial design against a white background. The hearts, in shades of green, blue, orange, red, and purple, decrease in size toward the center, forming concentric circles. This vector illustration is likely themed for Valentine's Day, emphasizing themes of love and romance through its vibrant and symmetrical heart pattern. Line decrease illustrations Colorful Hearts Circle Frame Valentine\'s Day Vector Card Background Romantic Love Design Stock Illustration. A circular arrangement of colorful heart shapes creates a radial design against a white background. The hearts, in shades of green, blue, orange, red, and purple, decrease in size toward the center, forming concentric circles. This vector illustration is likely themed for Valentine's Day, emphasizing themes of love and romance through its vibrant and symmetrical heart pattern.
Free with trial Concentric circles of black hearts on a white background create a mesmerizing pattern. The hearts gradually decrease in size toward the center, forming an optical illusion effect. The design is suitable for a romantic or Valentine's Day theme, emphasizing love and unity. Line decrease illustrations Colorful Hearts Circle Frame Valentine\'s Day Vector Card Background Romantic Love Design Stock Illustration. Concentric circles of black hearts on a white background create a mesmerizing pattern. The hearts gradually decrease in size toward the center, forming an optical illusion effect. The design is suitable for a romantic or Valentine's Day theme, emphasizing love and unity.
Free with trial This abstract illustration depicts the dynamic nature of financial markets, showcasing both significant volatility and an overall upward growth trend. A prominent red line graph indicates positive development, while underlying grey jagged lines and vertical bars represent frequent fluctuations and market uncertainty. To the right, orange up and down arrows symbolize the opposing forces and constant changes within the market. This visual is ideal for conveying concepts related to stock market performance, economic indicators, investment risks, and business analysis. Line decrease vectors Financial Market Volatility and Growth Trend. This abstract illustration depicts the dynamic nature of financial markets, showcasing both significant volatility and an overall upward growth trend. A prominent red line graph indicates positive development, while underlying grey jagged lines and vertical bars represent frequent fluctuations and market uncertainty. To the right, orange up and down arrows symbolize the opposing forces and constant changes within the market. This visual is ideal for conveying concepts related to stock market performance, economic indicators, investment risks, and business analysis.
Free with trial Isometric hand drawn illustration of an indian rupee coin next to a downward pointing arrow and declining bar chart on an alpha transparent background. Line decrease vectors Hand drawn indian rupee coin and falling financial graph doodle alpha transparent. Isometric hand drawn illustration of an indian rupee coin next to a downward pointing arrow and declining bar chart on an alpha transparent background.
Free with trial A simple, minimalist vector illustration of a minus sign within a rounded square outline, representing a negative symbol or reduction, perfect for web and app interfaces. Line decrease vectors Minus Sign Icon on White Square Outline, Negative Symbol, Vector Flat Design Graphic. A simple, minimalist vector illustration of a minus sign within a rounded square outline, representing a negative symbol or reduction, perfect for web and app interfaces
Free with trial A minimalist black-and-white graphic featuring a hand-drawn arrow. The arrow starts from the upper right, follows a gentle curve downwards, and concludes with an arrowhead pointing towards the bottom left corner. The style is simple and sketchy, resembling a casual marker stroke on a clean white background, ideal for indicating direction, decline, or downward movement. Line decrease vectors Simple hand-drawn black arrow curving downwards on a plain white background Vector. A minimalist black-and-white graphic featuring a hand-drawn arrow. The arrow starts from the upper right, follows a gentle curve downwards, and concludes with an arrowhead pointing towards the bottom left corner. The style is simple and sketchy, resembling a casual marker stroke on a clean white background, ideal for indicating direction, decline, or downward movement
Free with trial Circular chart icon presenting a bar graph visualizing statistical data, analytics, and business reports, symbolizing financial decline, data analysis, and market trends. Line decrease vectors Circular chart icon showing declining bar graph. Circular chart icon presenting a bar graph visualizing statistical data, analytics, and business reports, symbolizing financial decline, data analysis, and market trends
Free with trial A detailed red candlestick chart illustrating a consistent downward trend over time. Line decrease illustrations Red candlestick chart showing downward trend. A detailed red candlestick chart illustrating a consistent downward trend over time
Free with trial Pair of black scissors cutting a blue sticky note on a bright yellow background. Concept of budget cuts, reducing costs, price reduction, tax cuts, and creative editing or craft projects. Line decrease illustrations Pair of black scissors cutting a blue sticky note on a bright yellow background.
Free with trial Abstract wave design featuring multiple black lines forming undulating peaks and valleys, suggestive of mountain shapes. The pattern resembles frequency waves with a rhythmic, flowing structure. The lines increase and decrease in height to mimic a mountainous terrain, set against a stark white background. The smooth, curvilinear forms give a sense of dynamic movement and depth, emphasizing the interplay between geometry and natural forms. Line decrease vectors Abstract wave element for design Analog frequency track in Geography Mountain Shape. Abstract wave design featuring multiple black lines forming undulating peaks and valleys, suggestive of mountain shapes. The pattern resembles frequency waves with a rhythmic, flowing structure. The lines increase and decrease in height to mimic a mountainous terrain, set against a stark white background. The smooth, curvilinear forms give a sense of dynamic movement and depth, emphasizing the interplay between geometry and natural forms.
Free with trial Abstract design featuring a pink halftone pattern radiating from a central white circle. The pattern consists of evenly spaced dots that decrease in size as they extend outward in a sunburst effect, creating a sense of movement and depth on a white background. Line decrease vectors Abstract design featuring a pink halftone pattern radiating from a central white circle.
Free with trial Professional Vector Logo Design High-Resolution & Fully Editable This high-quality vector logo is designed with precision and creativity making it ideal for modern businesses, startups, and creative professionals The design is clean, scalable, and easy to customize�perfect for branding marketing materials, websites, and print applications. Key Features:100% Vector format (AI EPS SVG)Fully editable (colors, text, and shapes)High resolution � perfect for both web and print Modern, professional, and versatile design Ready for branding and promotional use Elevate your brand with this premium quality logo!. Line decrease vectors Dementia icon editable stock vector logo design. Professional Vector Logo Design High-Resolution & Fully Editable This high-quality vector logo is designed with precision and creativity making it ideal for modern businesses, startups, and creative professionals The design is clean, scalable, and easy to customize�perfect for branding marketing materials, websites, and print applications. Key Features:100% Vector format (AI EPS SVG)Fully editable (colors, text, and shapes)High resolution � perfect for both web and print Modern, professional, and versatile design Ready for branding and promotional use Elevate your brand with this premium quality logo!
Free with trial A minimalist flat design icon featuring a vertical separator bar. On the left, an upward-pointing arrow and a dark grey triangle symbolize "up" or "upload. " On the right, a downward-pointing arrow and an inverted dark grey triangle represent "down" or "download. " This versatile vector illustration is ideal for user interface elements, web design, mobile applications, data transfer concepts, navigation, or indicating directional movement and progress. Line decrease illustrations Up Down Arrows Icon for Upload Download Concept. A minimalist flat design icon featuring a vertical separator bar. On the left, an upward-pointing arrow and a dark grey triangle symbolize "up" or "upload." On the right, a downward-pointing arrow and an inverted dark grey triangle represent "down" or "download." This versatile vector illustration is ideal for user interface elements, web design, mobile applications, data transfer concepts, navigation, or indicating directional movement and progress.
Free with trial A minimalist vector icon illustrating market volatility and financial trends. The graphic features two distinct line graphs on a coordinate system: a jagged, highly fluctuating upper line representing high volatility, and a smoother lower line with marked points indicating a general trend. Up-down arrows and separate up down indicators further emphasize market movement and unpredictable changes. Ideal for financial reports, business presentations, data visualization, and economic analysis. Line decrease vectors Market Volatility and Financial Trend Graph Icon. A minimalist vector icon illustrating market volatility and financial trends. The graphic features two distinct line graphs on a coordinate system: a jagged, highly fluctuating upper line representing high volatility, and a smoother lower line with marked points indicating a general trend. Up-down arrows and separate up down indicators further emphasize market movement and unpredictable changes. Ideal for financial reports, business presentations, data visualization, and economic analysis.
Free with trial Up and down profit arrows seamless pattern isolated on color background. Simple background. Line decrease vectors Up and down profit arrows seamless pattern isolated on color background
Free with trial Up and down profit arrows seamless pattern isolated on black background. Simple background. Line decrease vectors Up and down profit arrows seamless pattern isolated on black background
Free with trial This vector graphic depicts a magnifying glass focused on a female figure and a declining bar graph, symbolizing the. Line decrease illustrations Women\'s Job Loss Magnifying Glass on Female Employment Decline. This vector graphic depicts a magnifying glass focused on a female figure and a declining bar graph, symbolizing the.
Free with trial This comprehensive vector icon set illustrates various financial market trends, economic indicators, and potential crises. Featuring line graphs, bar charts, pie charts, dollar signs, piggy banks, and warning sirens, the collection uses a striking red and black color palette to depict both growth and decline. Concepts like stock market volatility, investment risks, economic downturns, and business analytics are visually represented. Ideal for financial reports, business presentations, economic news, investment platforms, and educational materials requiring clear and impactful visual communication of market dynamics. Line decrease vectors Financial Market Trends and Crisis Vector Icons Set. This comprehensive vector icon set illustrates various financial market trends, economic indicators, and potential crises. Featuring line graphs, bar charts, pie charts, dollar signs, piggy banks, and warning sirens, the collection uses a striking red and black color palette to depict both growth and decline. Concepts like stock market volatility, investment risks, economic downturns, and business analytics are visually represented. Ideal for financial reports, business presentations, economic news, investment platforms, and educational materials requiring clear and impactful visual communication of market dynamics.
Free with trial A comprehensive vector icon set featuring essential symbols for business, finance, and data analysis. This collection includes various arrows for indicating growth and decline, wavy lines representing market trends, checkmarks for success or approval, X marks for errors or rejection, stopwatches for time management and efficiency, and stacks of coins with dollar signs for financial concepts. Ideal for presentations, infographics, web design, and reports to visually communicate progress, status, and economic indicators. Line decrease vectors Business, Finance, and Data Analytics Vector Icon Set. A comprehensive vector icon set featuring essential symbols for business, finance, and data analysis. This collection includes various arrows for indicating growth and decline, wavy lines representing market trends, checkmarks for success or approval, X marks for errors or rejection, stopwatches for time management and efficiency, and stacks of coins with dollar signs for financial concepts. Ideal for presentations, infographics, web design, and reports to visually communicate progress, status, and economic indicators.
Free with trial Design BRAIN SLEEPY FEELING TIRED SLEEPING ON PILLOW element. Line decrease illustrations BRAIN SLEEPY FEELING TIRED SLEEPING ON PILLOW element
Free with trial A close-up view of a red stock market chart displaying a strong downward trend. Candlestick bars and a fluctuating line graph indicate a significant decline in stock prices. Red arrows point downwards, emphasizing the negative movement. The background is dark with a subtle grid pattern and a bright light source on the left. Line decrease illustrations Red Stock Market Chart Showing Downward Trend graph. A close-up view of a red stock market chart displaying a strong downward trend. Candlestick bars and a fluctuating line graph indicate a significant decline in stock prices. Red arrows point downwards, emphasizing the negative movement. The background is dark with a subtle grid pattern and a bright light source on the left
Free with trial A three-dimensional green arrow with a jagged zigzag shape pointing downwards against a white backdrop. Line decrease vectors Green 3D zigzag arrow pointing down, declining trend symbol, falling growth icon. A three-dimensional green arrow with a jagged zigzag shape pointing downwards against a white backdrop
Free with trial A cartoon-style illustration of a bar graph displayed on a presentation screen. The graph shows three bars of different heights and colors (green, orange, and yellow), indicating growth or progress. The image is clean and simple, suitable for illustrating business, finance, or educational concepts in a visually appealing way. Line decrease illustrations Cartoon Bar Graph Presentation. A cartoon-style illustration of a bar graph displayed on a presentation screen. The graph shows three bars of different heights and colors (green, orange, and yellow), indicating growth or progress. The image is clean and simple, suitable for illustrating business, finance, or educational concepts in a visually appealing way.
Free with trial This vector graphic depicts declining performance with a gear, descending graph, downward arrow, and a 24-hour clock. Line decrease illustrations Declining Performance Gear, Graph, Arrow, 24 Hours Icon. This vector graphic depicts declining performance with a gear, descending graph, downward arrow, and a 24-hour clock.
Free with trial Scale with illustrations of cash and home stocks. The concept of inflation. Stock Illustration. Home price is decrease. Line decrease vectors Scale with illustrations of cash and home stocks. The concept of inflation. Stock Illustration
Free with trial A detailed red financial graph illustrates a sharp downward trend in stock prices. Candlestick bars and a wavy line graph show a significant decline, with red arrows reinforcing the negative movement. The dark background features a grid, and a bright light emanates from the left side of the image. Line decrease illustrations Red Financial Graph with Falling Stock Prices stock market. A detailed red financial graph illustrates a sharp downward trend in stock prices. Candlestick bars and a wavy line graph show a significant decline, with red arrows reinforcing the negative movement. The dark background features a grid, and a bright light emanates from the left side of the image
Free with trial Graphic bar chart illustrating business data analysis, financial statistics, and market trends with both positive growth and negative decline on a clean white background. Line decrease vectors Business financial graph showing increase and decrease. Graphic bar chart illustrating business data analysis, financial statistics, and market trends with both positive growth and negative decline on a clean white background
Free with trial The image features a heart shape composed of multiple concentric heart outlines. The hearts progressively decrease in size, creating a sense of depth and infinity. The design is monochromatic, with alternating black and white lines, giving it a striking and elegant appearance. This image symbolizes eternal love, affection, and the infinite nature of emotions. Line decrease vectors Infinite heart symbolizing eternal love. The image features a heart shape composed of multiple concentric heart outlines. The hearts progressively decrease in size, creating a sense of depth and infinity. The design is monochromatic, with alternating black and white lines, giving it a striking and elegant appearance. This image symbolizes eternal love, affection, and the infinite nature of emotions
Free with trial Reduce costs concept, business and company to keep cost low, cut spending or expense deduction in budget plan, businessman breaking the graph cost. Line decrease vectors Reduce costs concept
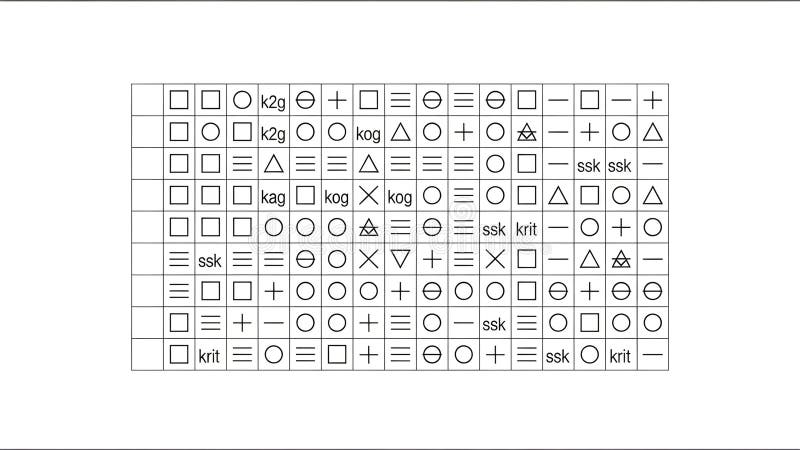
Free with trial A detailed black and white illustration of a complex knitting pattern chart on a clean white background. The grid is filled with various symbols, including geometric shapes like circles, squares, and triangles, alongside standard knitting abbreviations such as 'k2g', 'ssk', and 'kog'. This graphic represents a stitch legend or a visual guide for creating intricate lace or colorwork designs. It's perfect for craft-related websites, publications, tutorials, and projects that require a visual representation of handmade instructions, patterns, or complex codes. Line decrease illustrations Knitting Pattern Chart with Symbols and Abbreviations. A detailed black and white illustration of a complex knitting pattern chart on a clean white background. The grid is filled with various symbols, including geometric shapes like circles, squares, and triangles, alongside standard knitting abbreviations such as 'k2g', 'ssk', and 'kog'. This graphic represents a stitch legend or a visual guide for creating intricate lace or colorwork designs. It's perfect for craft-related websites, publications, tutorials, and projects that require a visual representation of handmade instructions, patterns, or complex codes.
Free with trial Graph going Up and Down sign with green and red arrows vector. Flat design vector illustration concept of sales bar chart symbol icon with arrow moving down and sales bar chart with arrow moving up. Line decrease illustrations Graph going Up and Down sign with green and red arrows vector. Flat design vector illustration concept of sales bar chart symbol. Graph going Up and Down sign with green and red arrows vector. Flat design vector illustration concept of sales bar chart symbol icon with arrow moving down and sales bar chart with arrow moving up.
Free with trial A professional 3D rendering of a bar chart representing a negative trend or financial loss. The illustration features three textured blue metallic columns with a prominent, jagged red arrow pointing downwards across them. This graphic symbolizes economic recession, market crashes, or decreasing sales figures. It is mounted on a sleek grey base and isolated on a white background, making it perfect for business presentations, investment risk analysis, and economic reports. Line decrease vectors 3D Downward Bar Chart with Red Arrow - Financial Loss & Recession Concept. A professional 3D rendering of a bar chart representing a negative trend or financial loss. The illustration features three textured blue metallic columns with a prominent, jagged red arrow pointing downwards across them. This graphic symbolizes economic recession, market crashes, or decreasing sales figures. It is mounted on a sleek grey base and isolated on a white background, making it perfect for business presentations, investment risk analysis, and economic reports.
Free with trial A clean, minimal, and abstract composition featuring a series of thin, circular frames arranged horizontally. The circles gradually decrease in size and fade in color and thickness from left to right, creating a sense of distance, perspective, or vanishing effect. The circles are outlined in a light, lime green or pale gold color against a pure white background. This progression of geometric shapes is a versatile graphic element suitable for abstract art, background design, or representing concepts like scale, progression, or evolution. Line decrease vectors Gradually Decreasing Lime Green Circle Frames on White. A clean, minimal, and abstract composition featuring a series of thin, circular frames arranged horizontally. The circles gradually decrease in size and fade in color and thickness from left to right, creating a sense of distance, perspective, or vanishing effect. The circles are outlined in a light, lime green or pale gold color against a pure white background. This progression of geometric shapes is a versatile graphic element suitable for abstract art, background design, or representing concepts like scale, progression, or evolution.
Free with trial Vector illustration of a downward arrow symbolizing economic decline, recession, and financial downturn. Line decrease vectors Vector illustration of a downward arrow symbolizing economic decline, recession
Free with trial Set of black and white financial icons features various symbols related to money and banking. Includes hands holding coins, stacks of bills, a money bag, and a coin. Illustrated are circular arrows indicating currency exchange, mobile phones with dollar signs, and an ATM screen. Symbols of a calendar with a coin, a stack of bills, and bank buildings with check marks and directional arrows depicting increase and decrease are present. Icons of dollar signs inside arrows pointing up and down, along with a receipt, are also shown. Line decrease vectors Icon set of money, banknotes, coins, payment, investment, accounting, currency, e-money, household, finance. Set of black and white financial icons features various symbols related to money and banking. Includes hands holding coins, stacks of bills, a money bag, and a coin. Illustrated are circular arrows indicating currency exchange, mobile phones with dollar signs, and an ATM screen. Symbols of a calendar with a coin, a stack of bills, and bank buildings with check marks and directional arrows depicting increase and decrease are present. Icons of dollar signs inside arrows pointing up and down, along with a receipt, are also shown.
Free with trial A captivating abstract geometric pattern featuring a dynamic spiral composed of numerous black squares on a pristine white background. The squares progressively decrease in size and density towards the center, creating a powerful sense of depth, movement, and an optical illusion of rotation or a vortex. This minimalist and high-contrast design is ideal for modern backgrounds, technology-related visuals, branding, or any project requiring a sophisticated and eye-catching graphic element. Line decrease vectors Abstract Black and White Spiral Squares Geometric Pattern. A captivating abstract geometric pattern featuring a dynamic spiral composed of numerous black squares on a pristine white background. The squares progressively decrease in size and density towards the center, creating a powerful sense of depth, movement, and an optical illusion of rotation or a vortex. This minimalist and high-contrast design is ideal for modern backgrounds, technology-related visuals, branding, or any project requiring a sophisticated and eye-catching graphic element.
Free with trial A minimalist flat design icon featuring a single, dark blue horizontal bar centered on a white background, representing a minus sign or subtraction. Line decrease illustrations Minus sign icon, simple flat design. A minimalist flat design icon featuring a single, dark blue horizontal bar centered on a white background, representing a minus sign or subtraction
Free with trial A stylized candlestick chart, commonly used in financial trading, is presented on a white background. The chart consists of several vertical bars, alternating in color between green (indicating an increase in price) and red (indicating a decrease in price). Each bar has a thin gold line extending from its top and bottom, representing wicks. Line decrease illustrations Candlestick Chart with Green and Red Bars on White Background stock market finance. A stylized candlestick chart, commonly used in financial trading, is presented on a white background. The chart consists of several vertical bars, alternating in color between green (indicating an increase in price) and red (indicating a decrease in price). Each bar has a thin gold line extending from its top and bottom, representing wicks
Free with trial Conceptual image showing a magnifying glass focusing on a business presentation with a declining graph. Line decrease illustrations Decline Analysis Magnifying Glass on Business Loss Graph. Conceptual image showing a magnifying glass focusing on a business presentation with a declining graph.
Free with trial CO2 cloud outline icon set with up and down arrows representing carbon emission reduction and increase. Greenhouse gas, environmental sustainability and climate change concept vector illustration. Line decrease vectors CO2 cloud outline icon set with up and down arrows representing carbon emission reduction and increase. Greenhouse gas
Free with trial A 3D illustration of a financial chart showing a dramatic downward trend. A large red arrow points sharply down over a series of declining blue bar graphs, symbolizing a stock market crash, economic recession, or business failure. The background features complex data and grids, representing financial analysis and market data. This image is perfect for concepts related to economic crisis, investment loss, financial risk, bankruptcy, and negative business reports. Line decrease illustrations Stock Market Crash Financial Graph. A 3D illustration of a financial chart showing a dramatic downward trend. A large red arrow points sharply down over a series of declining blue bar graphs, symbolizing a stock market crash, economic recession, or business failure. The background features complex data and grids, representing financial analysis and market data. This image is perfect for concepts related to economic crisis, investment loss, financial risk, bankruptcy, and negative business reports.
Free with trial Image Compression Outline Icon Vector Linear File Shrink Symbol for Web Optimization Isolated on White Background. Image Compression Outline Icon Vector Linear. Line decrease vectors Image Compression Outline Icon Vector Linear File Shrink Symbol for Web Optimization Isolated on White Background. Image Compression Outline Icon Vector Linear