Free with trial Abstract illustration of business growth, featuring bar graphs and line graphs in shades of blue and grey. The image conveys concepts of data analysis, progress, and financial performance. Suitable for presentations, reports, and marketing materials related to business, finance, and technology. Line decrease illustrations Abstract Business Growth Chart. Abstract illustration of business growth, featuring bar graphs and line graphs in shades of blue and grey. The image conveys concepts of data analysis, progress, and financial performance. Suitable for presentations, reports, and marketing materials related to business, finance, and technology.
Free with trial The image shows a stylized, neon blue graph depicting a downward trend, overlaid on a background resembling the interior of a theater or auditorium. the graph is composed of many small, glowing particles, giving it a digital or futuristic appearance. the background features rows of empty seats and stage lighting, suggesting a performance venue. the overall impression is one of economic downturn or financial loss, visualized in an unusual and somewhat theatrical setting. Line decrease illustrations Declining stock market graph in theater setting. the image shows a stylized, neon blue graph depicting a downward trend, overlaid on a background resembling the interior of a theater or auditorium. the graph is composed of many small, glowing particles, giving it a digital or futuristic appearance. the background features rows of empty seats and stage lighting, suggesting a performance venue. the overall impression is one of economic downturn or financial loss, visualized in an unusual and somewhat theatrical setting.
Free with trial Money loan interest rate hand drawn doodle icons set collection in flat style. Payment benefit vector illustration on isolated background. Discount sign business concept. Line decrease vectors Money loan interest rate hand drawn doodle icons set collection in flat style. Payment benefit vector illustration on isolated
Free with trial A horizontal arrangement of three electrocardiogram graphs displayed on a textured beige background illustrates distinct cardiac rhythms including normal sinus rhythm with green tracing, atrial fibrillation showing irregular red waveform patterns, and bradycardia demonstrated through slowed blue heartbeat tracings, providing educational visual comparison of arrhythmias for medical textbooks,. Line decrease illustrations Three medical ECG heart rhythm comparison charts showing normal sinus atrial fibrillation and bradycardia on aged beige background. A horizontal arrangement of three electrocardiogram graphs displayed on a textured beige background illustrates distinct cardiac rhythms including normal sinus rhythm with green tracing, atrial fibrillation showing irregular red waveform patterns, and bradycardia demonstrated through slowed blue heartbeat tracings, providing educational visual comparison of arrhythmias for medical textbooks,
Free with trial Zoom In Pinch Arrowhead Icon Scale Size Big Small Out Finger Gesture Movement Enlarge Minimize Two Corner Arrow Window Expansion Point Pointer Shape. Line decrease vectors Zoom In Pinch Arrowhead Icon Scale Size Big Small Out Finger Gesture Movement Enlarge Minimize Two Corner Arrow Window
Free with trial Hand drawn arrow black mark set. Isolated Hand-drawn arrows icons on white background. Different pointer collection. Simple drawing arrow pen. Vector illustration. Line decrease vectors Colection of black hand drawn arrow signs. Vector illustration. Hand drawn arrow black mark set. Isolated Hand-drawn arrows icons on white background. Different pointer collection. Simple drawing arrow pen. Vector illustration.
Free with trial Yellow Circle Minus Sign Symbol Icon Simple Minimalist Modern Flat Design Concept. Line decrease vectors Yellow Circle Minus Sign Symbol Icon Simple Minimalist Modern Flat Design Concept
Free with trial Several white and black arrows point upward at different angles on a light background. One black arrow in the upper right hand corner points downward. Line decrease illustrations Arrows Indicate Growth Upward, One Arrow Points Downward. Several white and black arrows point upward at different angles on a light background. One black arrow in the upper right hand corner points downward.
Free with trial Black silhouette icon featuring a simplistic human shape with a downward-pointing arrow extending from the body. The design consists of a circular head atop a semicircular body segment, with the arrow positioned in the middle. Simple and minimalistic, the icon suggests movement or directionality, typically used in digital interfaces for download actions or indicating something moving downwards. The white background highlights the bold black lines. Line decrease vectors Human icon with downward arrow. Black silhouette icon featuring a simplistic human shape with a downward-pointing arrow extending from the body. The design consists of a circular head atop a semicircular body segment, with the arrow positioned in the middle. Simple and minimalistic, the icon suggests movement or directionality, typically used in digital interfaces for download actions or indicating something moving downwards. The white background highlights the bold black lines.
Free with trial Stacks of silver coins ascend with a red arrow graph line indicating growth, contrasted by a blue downward arrow and house outlines. Line decrease illustrations Stacks of coins with rising and falling graph lines and house outlines money finance. Stacks of silver coins ascend with a red arrow graph line indicating growth, contrasted by a blue downward arrow and house outlines
Free with trial This vector illustration shows a set of black graph icons with rising and falling charts indicated by arrows showing trends in data with clear simple design and sharp edges calm. Generative AI. Line decrease vectors Black graph icons set rising and falling charts with arrows vector illustration simple design. This vector illustration shows a set of black graph icons with rising and falling charts indicated by arrows showing trends in data with clear simple design and sharp edges calm. Generative AI
Free with trial Five transparent glass cubes with polished silver metal frames are arranged in a row, increasing in size from left to right. Line decrease illustrations Five clear glass cubes with silver frames arranged in ascending size transparent. Five transparent glass cubes with polished silver metal frames are arranged in a row, increasing in size from left to right
Free with trial An image showcasing four different graphical representations of financial trends using arrows and lines on grid backgrounds. Line decrease illustrations Graphical representation of financial trends isolated on transparent background. An image showcasing four different graphical representations of financial trends using arrows and lines on grid backgrounds
Free with trial Red 3D zigzag arrow is trending downward on plain white background, casting faint shadow. Business decline, financial analysis, data visualization, modern design, digital marketing, growth reduction, minimalistic style. Line decrease illustrations Red 3D zigzag arrow is trending downward on plain white background, casting faint shadow
Free with trial A simple and clear black-and-white illustration of decreasing stacks of dollar coins, symbolizing loss, reduced income, or financial decline. Perfect for presentations, infographics, and finance apps. Line decrease vectors Declining Revenue Icon Stacked Coin Chart. A simple and clear black-and-white illustration of decreasing stacks of dollar coins, symbolizing loss, reduced income, or financial decline. Perfect for presentations, infographics, and finance apps
Free with trial Green bar graph illustrating continuous growth or progress. Line decrease illustrations Green bar graph illustrating continuous growth or progress.
Free with trial Dollar Currency Up Down Icons. Redus and high costs line with dollar icons.. eps. Line decrease vectors Circular dollar icons showing rising and falling currency values. Dollar Currency Up Down Icons. Redus and high costs line with dollar icons..eps
Free with trial Global Downturn Visualized: A striking graphic representation of economic decline, featuring a world map as the backdrop for a visual depiction of market fluctuations. Line decrease illustrations Global Downturn Visualized: A striking graphic representation
Free with trial Concentric heart shapes in flat vector design with a minimalist style. Black outlines progressively decrease in size, creating a layered effect. The illustration features five hearts centered on a plain white background, symbolizing love and romance. Line decrease illustrations Flat Design Love Vector Illustration Heart Icon Romantic Love Symbol Stock Art. Concentric heart shapes in flat vector design with a minimalist style. Black outlines progressively decrease in size, creating a layered effect. The illustration features five hearts centered on a plain white background, symbolizing love and romance.
Free with trial A man in a dark suit touches a glowing blue digital interface overlaid on a downward trending bar graph. Line decrease illustrations Businessman touching glowing digital interface with downward trend graph technology. A man in a dark suit touches a glowing blue digital interface overlaid on a downward trending bar graph
Free with trial This image features a minimalist black and white bar graph icon, depicting data analysis. It includes vertical bars of varying heights along horizontal and vertical axes. Line decrease vectors Simple Black and White Bar Graph Icon for Data Visualization. This image features a minimalist black and white bar graph icon, depicting data analysis. It includes vertical bars of varying heights along horizontal and vertical axes.
Free with trial Data Stats Board Display Icon Downward Down Trend Statistic Performance Market Decline Economy Downturn Bar Graph Progress Sign Symbol Presentation. Line decrease vectors Data Stats Board Display Icon Downward Down Trend Statistic Performance Market Decline Economy Downturn Bar Graph Progress
Free with trial Financial analysis scene showing colorful graphs and charts with a wooden block displaying a house icon and the year 2026, conveying real estate market growth and investment trends, ideal for finance and real estate marketing materials. Line decrease illustrations Financial Growth Charts with Wooden House Block and Year 2026. Financial analysis scene showing colorful graphs and charts with a wooden block displaying a house icon and the year 2026, conveying real estate market growth and investment trends, ideal for finance and real estate marketing materials
Free with trial The image displays a financial stock market chart with various colored candlesticks and multiple technical indicators overlaid on a grid background. Line decrease illustrations Detailed financial stock market chart with technical indicators and price movements. The image displays a financial stock market chart with various colored candlesticks and multiple technical indicators overlaid on a grid background
Free with trial Gray circle with minus sign, mathematical symbol or negative icon, simple design element. Line decrease illustrations Gray circle with minus sign, mathematical symbol or negative icon, simple design element
Free with trial Concentric circles in red and blue dominate the design, alternating in color. The circles decrease in size towards the center, creating a target-like pattern against a white background. Each ring appears to have a slight shadow, giving a three-dimensional effect. The color contrast is striking, emphasizing the geometric precision and symmetry of the circular pattern. Line decrease illustrations Concentric circles in red and blue dominate the design, alternating in color
Free with trial A black shopping basket icon displays various financial charts and graphs in blue and green, indicating business analytics. Line decrease illustrations Shopping basket icon with financial charts and graphs on white background cart retail. A black shopping basket icon displays various financial charts and graphs in blue and green, indicating business analytics
Free with trial Three funnel-shaped arrows�orange, red, and dark blue�decrease in size vertically, leading into a single blue arrow pointing right. Each funnel section tapers downward, representing a flow or process. The arrows contrast against a light background, emphasizing the transition from multiple inputs to a single output. Suitable for illustrating processes like sales funnels or data narrowing. Line decrease vectors Funnel flow chart template with three arrows. Three funnel-shaped arrows�orange, red, and dark blue�decrease in size vertically, leading into a single blue arrow pointing right. Each funnel section tapers downward, representing a flow or process. The arrows contrast against a light background, emphasizing the transition from multiple inputs to a single output. Suitable for illustrating processes like sales funnels or data narrowing.
Free with trial A visual representation of negative financial performance, illustrating a significant downward trend with a red arrow pointing downwards, indicating a loss or decline in value. Line decrease illustrations Red graph showing a downward trend isolated on white background. A visual representation of negative financial performance, illustrating a significant downward trend with a red arrow pointing downwards, indicating a loss or decline in value
Free with trial Hand drawn vintage arrow symbol pointing down sketch illustration. Line decrease vectors Hand drawn vintage arrow symbol pointing down sketch illustration
Free with trial A halftone dotted pattern with a white background. The black dots are arranged in a gradient, varying in size to create a wave-like effect. The dots are more concentrated at the edges and gradually decrease towards the center, creating an illusion of depth and movement. The design is symmetrical and visually balanced, emphasizing the contrast between the black dots and the white space. Line decrease vectors Halftone dotted background pattern Halftone texture isolated on the white background. A halftone dotted pattern with a white background. The black dots are arranged in a gradient, varying in size to create a wave-like effect. The dots are more concentrated at the edges and gradually decrease towards the center, creating an illusion of depth and movement. The design is symmetrical and visually balanced, emphasizing the contrast between the black dots and the white space.
Free with trial Showing helix graph tracking market data in dotted grid display, with bars and arrowed markers. Financial, technology, innovation, data, analytics, digital, futuristic. Line decrease illustrations Showing helix graph tracking market data in dotted grid display, with bars and arrowed markers
Free with trial Displaying chart showing downward trend on gray hexagon grid, with gradient bars and red arrow. Data analytics, infographics, minimalist, technology, finance, business intelligence, dashboard. Line decrease illustrations Displaying chart showing downward trend on gray hexagon grid, with gradient bars and red arrow
Free with trial Financial crisis concept. Decreasing graph with falling columns. Vector illustration showing recession, bankruptcy, and economic decline. Line decrease vectors Financial crisis concept. Decreasing graph with falling columns. Vector illustration showing recession, bankruptcy
Free with trial Subtraction interface icon. Negative Vector representation. Minimalist circular illustration. Prohibited removal identification. EPS 10. Line decrease vectors Subtraction interface icon. Negative Vector representation. Minimalist circular illustration. Prohibited removal identification.
Free with trial Concentric circles create a three-dimensional effect on a white background. The rings decrease in size toward the center, forming a gently spiraling pattern. The texture is smooth, with soft shadows adding depth and the appearance of layered, recessed surfaces. The monochromatic tone gives a minimalist and modern feel, making it suitable as a backdrop for design or presentation purposes. Line decrease illustrations Abstract White Circular Pattern Background. Concentric circles create a three-dimensional effect on a white background. The rings decrease in size toward the center, forming a gently spiraling pattern. The texture is smooth, with soft shadows adding depth and the appearance of layered, recessed surfaces. The monochromatic tone gives a minimalist and modern feel, making it suitable as a backdrop for design or presentation purposes.
Free with trial A high-quality conceptual image featuring a row of smooth wooden cubes spelling the word "PESSIMISM" on a wooden surface. The arrangement includes a stacked block showing a sad face emoticon and a downward-sloping line graph, symbolizing financial loss, recession, negative market sentiment, and psychological discouragement in a professional or personal context. Line decrease illustrations Wooden Blocks Spelling Pessimism with Sad Face Icon and Downward Trend Graph. A high-quality conceptual image featuring a row of smooth wooden cubes spelling the word "PESSIMISM" on a wooden surface. The arrangement includes a stacked block showing a sad face emoticon and a downward-sloping line graph, symbolizing financial loss, recession, negative market sentiment, and psychological discouragement in a professional or personal context.
Free with trial A globe with a map of the world on it, sitting next to a set of orange bar graphs. Line decrease illustrations A globe sitting on top of a table next to a bar chart. A globe with a map of the world on it, sitting next to a set of orange bar graphs
Free with trial A dynamic black illustration depicts a lightning bolt with emanating lines and a downward-pointing arrow, symbolizing energy discharge, power reduction, or data download against a clean white backdrop. Line decrease vectors Powerful Energy Download: Black Graphic Symbol on White Background. A dynamic black illustration depicts a lightning bolt with emanating lines and a downward-pointing arrow, symbolizing energy discharge, power reduction, or data download against a clean white backdrop.
Free with trial Concentric black ovals on a white background create an abstract swirl pattern. The design consists of thicker, evenly spaced lines that decrease in size towards the center, forming a hypnotic effect. The lines are smooth and consistent, radiating outward from the center, with each oval increasing in size sequentially. The overall appearance is bold and graphic, emphasizing contrast and symmetry. Line decrease vectors Black and white swirl background Abstract Silhouette Design. Concentric black ovals on a white background create an abstract swirl pattern. The design consists of thicker, evenly spaced lines that decrease in size towards the center, forming a hypnotic effect. The lines are smooth and consistent, radiating outward from the center, with each oval increasing in size sequentially. The overall appearance is bold and graphic, emphasizing contrast and symmetry.
Free with trial Stock showing diverse collection of black and white for financial data analysis charts and graphs keywords: financial, data, analysis, charts. Line decrease illustrations Diverse Collection of Black and White for Financial Data Analysis Charts and Graphs Keywords: financial, data
Free with trial Displaying dashboard on screen showing red arrow trending down over bar chart and colorful lines. Analytics, visualization, data, performance, digital, insight, metrics. Line decrease illustrations Displaying dashboard on screen showing red arrow trending down over bar chart and colorful lines
Free with trial Indicating negative trend red arrow slanting down on finance dashboard, with bars and data points. Financial, analytics, data visualization, technology, digital interface, dashboard, statistical. Line decrease illustrations Indicating negative trend red arrow slanting down on finance dashboard, with bars and data points
Free with trial Up or down vector icon, eps 10 file, easy to edit. Line decrease vectors Up or down vector icon
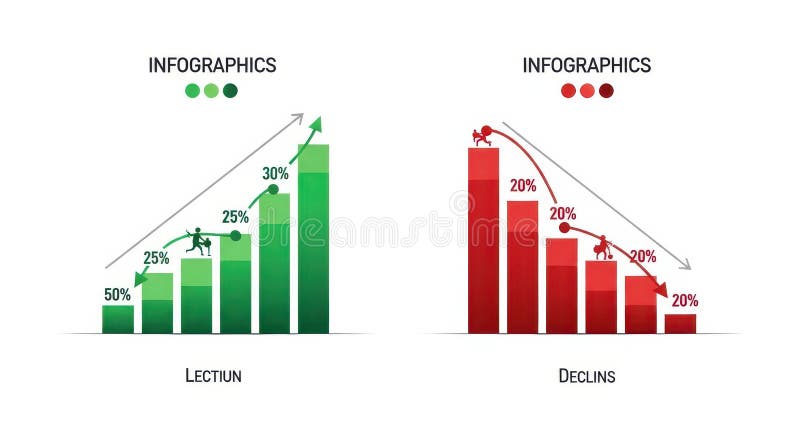
Free with trial The image displays two infographics side by side. the left infographic, titled "lection," depicts a green bar graph showing growth, starting at 50% and increasing to 30% with a figure climbing the bars. an upward-pointing arrow indicates positive growth. the right infographic, titled "declins," shows a red bar graph illustrating decline, starting at 20% and decreasing to 20% with a figure falling down the bars. a downward-pointing arrow indicates negative growth. Line decrease illustrations Infographics showing growth and decline charts. the image displays two infographics side by side. the left infographic, titled "lection," depicts a green bar graph showing growth, starting at 50% and increasing to 30% with a figure climbing the bars. an upward-pointing arrow indicates positive growth. the right infographic, titled "declins," shows a red bar graph illustrating decline, starting at 20% and decreasing to 20% with a figure falling down the bars. a downward-pointing arrow indicates negative growth.
Free with trial Line graph with downward trend, sad face for dissatisfaction, alert bell for warning, and magnifier symbolizing evaluation. Ideal for data analysis, performance tracking, decline, warning, failure. Line decrease vectors Declining Graph with Sad Face, Alert Bell, and Magnifier Indicating Negative Trends. Line graph with downward trend, sad face for dissatisfaction, alert bell for warning, and magnifier symbolizing evaluation. Ideal for data analysis, performance tracking, decline, warning, failure
Free with trial Concentric circular pattern formed by red dots, arranged from dense center to sparse edges on a white background. The dots increase in number but decrease in size as they radiate outward from the center, creating a ripple effect. The pattern visually represents sound waves or vibrations, emphasizing symmetry and balance. This abstract design might be used in contexts related to sound, technology, or visual arts. Line decrease illustrations Concentric circular pattern formed by red dots
Free with trial Four vibrant lines undulating on a dark dashboard, illustrating progress over time while emphasizing key data points with distinct circles for enhanced clarity and analysis. Line decrease vectors Four vibrant lines undulating on a dark dashboard, illustrating progress over time while emphasizing key data points
Free with trial Red stock market investment decline chart. Line decrease vectors Red stock market investment decline chart
Free with trial Red stock market investment decline chart. Line decrease vectors Red stock market investment decline chart
Free with trial Red sad face beside a line graph showing a downward trend and a bar graph. Ideal for business loss, economic decline, performance issues, challenges, setbacks, analytics, trends. Simple flat metaphor. Line decrease vectors Declining Chart with Sad Face and Bar Graph Representing Negative Trend and Challenges. Red sad face beside a line graph showing a downward trend and a bar graph. Ideal for business loss, economic decline, performance issues, challenges, setbacks, analytics, trends. Simple flat metaphor
Free with trial A 3D rendered image of a red arrow pointing downwards, suggesting a negative trend or decline. The arrow has a feathered fletching and casts a shadow on a white background, emphasizing the downward direction. The image is clean and minimalist, perfect for illustrating concepts of loss, decline, or. Line decrease illustrations Red Arrow Downward Trend. A 3D rendered image of a red arrow pointing downwards, suggesting a negative trend or decline. The arrow has a feathered fletching and casts a shadow on a white background, emphasizing the downward direction. The image is clean and minimalist, perfect for illustrating concepts of loss, decline, or
Free with trial Blue flat visualization showing bar chart and downward arrow over data grid with world map overlay. Analytics, finance, data analysis, digital, infographic, corporate, trend. Line decrease illustrations Blue flat visualization showing bar chart and downward arrow over data grid with world map overlay
Free with trial A graphic illustrating declining gas prices, featuring a fuel pump and a downward trending red line graph, isolated on a white background. Line decrease illustrations Falling gas prices graph with fuel pump isolated on white background. A graphic illustrating declining gas prices, featuring a fuel pump and a downward trending red line graph, isolated on a white background
Free with trial Thick black arrow curving to the right and pointing downward, perfect for enhancing presentations, websites, or various graphic design projects with a bold visual element. Line decrease vectors Thick black arrow curving to the right and pointing downward, perfect for enhancing presentations, websites, or various
Free with trial A striking 3D-rendered image featuring a blue hand emerging from the left side, gripping a red zigzag arrow pointing downward against a solid light blue background. The arrow symbolizes a decline in metrics such as financial performance, market trends, or business growth. This image is ideal for use in economic reports, editorial content, business presentations, and visual storytelling focused on loss, downturns, or negative growth. The clean design and bold color contrast make it a powerful metaphor for financial challenges and strategic analysis. Line decrease illustrations . A striking 3D-rendered image featuring a blue hand emerging from the left side, gripping a red zigzag arrow pointing downward against a solid light blue background. The arrow symbolizes a decline in metrics such as financial performance, market trends, or business growth. This image is ideal for use in economic reports, editorial content, business presentations, and visual storytelling focused on loss, downturns, or negative growth. The clean design and bold color contrast make it a powerful metaphor for financial challenges and strategic analysis.
Free with trial Money loan interest rate hand drawn doodle icons set collection in flat style. Payment benefit vector illustration on isolated background. Discount sign business concept. Line decrease vectors Money loan interest rate hand drawn doodle icons set collection in flat style. Payment benefit vector illustration on isolated
Free with trial Layered heart pattern in shades of pink forming a symmetrical abstract background. The hearts decrease in size, creating a central focal point. Smooth gradients give a sense of depth and movement to the design, suitable for romantic themes like Valentine's Day or weddings. The overall texture is sleek, with a modern aesthetic. Line decrease illustrations Pink heart abstract background, layered heart pattern with smooth gradients, modern romantic illustration. Layered heart pattern in shades of pink forming a symmetrical abstract background. The hearts decrease in size, creating a central focal point. Smooth gradients give a sense of depth and movement to the design, suitable for romantic themes like Valentine's Day or weddings. The overall texture is sleek, with a modern aesthetic.
Free with trial A red arrow points downward on a reflective surface during a rainy night, suggesting a decline or downturn for visual communication. Line decrease illustrations Red Arrow Declining in Rain at Night. A red arrow points downward on a reflective surface during a rainy night, suggesting a decline or downturn for visual communication
Free with trial Six metal candle mold lock bands are aligned horizontally on a solid white background. Each band features an adjustable clasp mechanism with a screw and latch, allowing for easy securement. The bands gradually decrease in size from left to right, showcasing a shiny, polished steel finish. These bands are cylindrical, designed for use in candle making to hold molds or forms securely. Line decrease vectors Candle mold lock bands floating horizontally on solid white background. Six metal candle mold lock bands are aligned horizontally on a solid white background. Each band features an adjustable clasp mechanism with a screw and latch, allowing for easy securement. The bands gradually decrease in size from left to right, showcasing a shiny, polished steel finish. These bands are cylindrical, designed for use in candle making to hold molds or forms securely.
Free with trial Growth vector icon. Graph or diagram with arrow going up and down. Vector illustration. Line decrease vectors Growth vector icon. Graph or diagram with arrow going up and down. Vector
Free with trial Illustration of a smartphone displaying financial charts and a stack of gold coins with dollar signs. Arrows circulate around the phone, suggesting a cycle of investment and growth. The image represents mobile banking, online trading, and the potential for financial success through digital platforms. Line decrease illustrations Mobile Investment and Financial Growth. Illustration of a smartphone displaying financial charts and a stack of gold coins with dollar signs. Arrows circulate around the phone, suggesting a cycle of investment and growth. The image represents mobile banking, online trading, and the potential for financial success through digital platforms.
Free with trial A graph with a reduction report. A dagram showing the recession and bankruptcy. Business and finance concept. Vector illustration. Line decrease vectors Graph with a reduction report. A dagram showing the recession and bankruptcy. Business and finance concept. Vector illustration
Free with trial Minus Sign Drawn in a Circle, Subtraction Math Symbol, Outline Illustration. Line decrease vectors Minus Sign Drawn in a Circle, Subtraction Math Symbol, Outline Illustration
Free with trial Abstract stock market chart with red and green candlesticks illustrating financial data and trading trends. Perfect for representing economic analysis, investment strategies, or business reporting. Line decrease illustrations Dynamic Stock Market Chart Displaying Fluctuating Trends and Analytics. Abstract stock market chart with red and green candlesticks illustrating financial data and trading trends. Perfect for representing economic analysis, investment strategies, or business reporting
Free with trial Simple black percentage symbol "%" on a white background. The design features a forward slash with a circle on the top left and bottom right, representing the mathematical percent sign. Clean and minimalistic vector style for clarity and easy recognition. Line decrease vectors Percent icon, simple vector design. Simple black percentage symbol "%" on a white background. The design features a forward slash with a circle on the top left and bottom right, representing the mathematical percent sign. Clean and minimalistic vector style for clarity and easy recognition.
Free with trial Circular arrows pointing in opposite directions, creating a balanced and visually appealing design element. Perfect for website icons, app design, or any project requiring a sense of balance and movement. High-resolution vector graphic ensures scalability without loss of quality. Line decrease vectors Abstract Circular Arrows: Symmetrical Design Element. Circular arrows pointing in opposite directions, creating a balanced and visually appealing design element. Perfect for website icons, app design, or any project requiring a sense of balance and movement. High-resolution vector graphic ensures scalability without loss of quality.
Free with trial Bright, colorful stock chart on dark screen. Fluctuations lines and grid representing data and trends. Stock photo. Line decrease illustrations Bright, colorful stock chart on dark screen. Fluctuations lines and grid representing data and trends
Free with trial A sleek, minimalist vector illustration of a minus symbol with a horizontal line, signifying subtraction, reduction, or a negative value. Ideal for mathematical concepts, financial reports, or user interface controls for decreasing quantities. Clean and versatile for various digital applications, vector design Generative AI. Line decrease vectors Minimalist Minus Symbol: Subtraction & Reduction Vector, vector design Generative AI. A sleek, minimalist vector illustration of a minus symbol with a horizontal line, signifying subtraction, reduction, or a negative value. Ideal for mathematical concepts, financial reports, or user interface controls for decreasing quantities. Clean and versatile for various digital applications, vector design Generative AI
Free with trial Circular green halftone pattern consisting of a grid of dots that vary in size. The dots are larger in the center and gradually decrease in size towards the edges, creating a gradient effect. The overall design is set against a white background, with a smooth transition that gives a sense of depth and texture. This is a visual technique often used in graphic design and printing for creating shading and tonal effects. Line decrease vectors Circular green halftone pattern consisting of a grid of dots that vary in size.
Free with trial An abstract digital rendering of a financial market chart with a prominent red line indicating fluctuations in a stock market or trading scenario, set against a background of data streams and numerical information. It can be used for visualizing economic trends or for representing financial analytics. Line decrease illustrations Abstract financial chart depicting market trends and data analysis interface. An abstract digital rendering of a financial market chart with a prominent red line indicating fluctuations in a stock market or trading scenario, set against a background of data streams and numerical information. It can be used for visualizing economic trends or for representing financial analytics
Free with trial Downward line graph with sad face reflecting poor performance, folder with binary data, and cloud element. Ideal for finance, analytics, failure, statistics, digital storage, emotions simple flat. Line decrease illustrations Negative trend in data analysis with declining graph, sad face, and digital file management. Downward line graph with sad face reflecting poor performance, folder with binary data, and cloud element. Ideal for finance, analytics, failure, statistics, digital storage, emotions simple flat
Free with trial Red 3D zigzag arrow is showing downward trend on white background, subtle shadowing, copy space. Progress, decline, analytics, chart, visualization, presentation, digital. Line decrease illustrations Red 3D zigzag arrow is showing downward trend on white background, subtle shadowing, copy space
Free with trial An icon representing financial downturn, featuring a stack of coins and a line graph with a downward arrow, indicating a decrease in value or performance. This visual signifies economic hardship or in. Line decrease vectors Graph showing financial decline with coins isolated on transparent background. An icon representing financial downturn, featuring a stack of coins and a line graph with a downward arrow, indicating a decrease in value or performance. This visual signifies economic hardship or in
Free with trial Multiple black square shapes arranged in a spiral pattern against a light grey background. Each square is tilted at a different angle, creating a dynamic sense of movement from the center outward. The squares decrease in size as they approach the center point of the spiral, forming a hypnotic geometric pattern. The squares maintain crisp, clean edges throughout the composition, emphasizing the abstract nature of the design. Minimalist art with clean lines and strong geometric forms against a monochromatic background. 32. Line decrease illustrations Abstract shapes. Abstract spiral square shapes, Vector wallpaper design. Multiple black square shapes arranged in a spiral pattern against a light grey background. Each square is tilted at a different angle, creating a dynamic sense of movement from the center outward. The squares decrease in size as they approach the center point of the spiral, forming a hypnotic geometric pattern. The squares maintain crisp, clean edges throughout the composition, emphasizing the abstract nature of the design. Minimalist art with clean lines and strong geometric forms against a monochromatic background.32
Free with trial Multiple black square shapes arranged in a spiral pattern against a light grey background. Each square is tilted at a different angle, creating a dynamic sense of movement from the center outward. The squares decrease in size as they approach the center point of the spiral, forming a hypnotic geometric pattern. The squares maintain crisp, clean edges throughout the composition, emphasizing the abstract nature of the design. Minimalist art with clean lines and strong geometric forms against a monochromatic background. 32. Line decrease illustrations Abstract shapes. Abstract spiral square shapes, Vector wallpaper design. Multiple black square shapes arranged in a spiral pattern against a light grey background. Each square is tilted at a different angle, creating a dynamic sense of movement from the center outward. The squares decrease in size as they approach the center point of the spiral, forming a hypnotic geometric pattern. The squares maintain crisp, clean edges throughout the composition, emphasizing the abstract nature of the design. Minimalist art with clean lines and strong geometric forms against a monochromatic background.32
Free with trial Multiple black square shapes arranged in a spiral pattern against a light grey background. Each square is tilted at a different angle, creating a dynamic sense of movement from the center outward. The squares decrease in size as they approach the center point of the spiral, forming a hypnotic geometric pattern. The squares maintain crisp, clean edges throughout the composition, emphasizing the abstract nature of the design. Minimalist art with clean lines and strong geometric forms against a monochromatic background. 32. Line decrease illustrations Abstract shapes. Abstract spiral square shapes, Vector wallpaper design. Multiple black square shapes arranged in a spiral pattern against a light grey background. Each square is tilted at a different angle, creating a dynamic sense of movement from the center outward. The squares decrease in size as they approach the center point of the spiral, forming a hypnotic geometric pattern. The squares maintain crisp, clean edges throughout the composition, emphasizing the abstract nature of the design. Minimalist art with clean lines and strong geometric forms against a monochromatic background.32
Free with trial Candlestick charts with red and green bars display a stock market or forex trading pattern. Each candlestick represents data for a specific time period, showing opening, closing, high, and low values. Red indicates a price decrease, while green signifies an increase. The chart analyzes investment trends and is used for financial decisions in business and trading. The background is dark blue, enhancing the visibility of the vibrant candlestick colors. Line decrease illustrations Stock market chart forex trading candlestick pattern investment finance business graph analysis data trend. Candlestick charts with red and green bars display a stock market or forex trading pattern. Each candlestick represents data for a specific time period, showing opening, closing, high, and low values. Red indicates a price decrease, while green signifies an increase. The chart analyzes investment trends and is used for financial decisions in business and trading. The background is dark blue, enhancing the visibility of the vibrant candlestick colors.