Free with trial Visual representation of a financial downturn. A bar chart shows a sharp decline, accompanied by a warning sign and a gold dollar coin, symbolizing economic trouble and risk. Line decrease illustrations Financial crisis alert decreasing bar chart with dollar coin and warning sign. Visual representation of a financial downturn. A bar chart shows a sharp decline, accompanied by a warning sign and a gold dollar coin, symbolizing economic trouble and risk.
Free with trial A conceptual vector illustration depicting the duality of business performance. On a modern teal background, two reports are shown side-by-side. One features a rising red graph symbolizing growth, profit, and success, while the other displays a descending graph representing decline, loss, and failure. This flat design graphic is ideal for financial analysis, market trend comparisons, business presentations, and infographics illustrating opposite outcomes or strategic choices. The long shadow effect adds a contemporary feel to the design. Line decrease vectors Growth and Decline Business Charts Comparison. A conceptual vector illustration depicting the duality of business performance. On a modern teal background, two reports are shown side-by-side. One features a rising red graph symbolizing growth, profit, and success, while the other displays a descending graph representing decline, loss, and failure. This flat design graphic is ideal for financial analysis, market trend comparisons, business presentations, and infographics illustrating opposite outcomes or strategic choices. The long shadow effect adds a contemporary feel to the design.
Free with trial This image depicts a computer screen displaying a sharply declining stock market graph, generated by AI. The red line dramatically illustrates a significant market downturn, accompanied by numerous data points and financial indicators. The dark aesthetic enhances the sense of urgency and potential. Line decrease illustrations AI-Generated Stock Market Decline. This image depicts a computer screen displaying a sharply declining stock market graph, generated by AI. The red line dramatically illustrates a significant market downturn, accompanied by numerous data points and financial indicators. The dark aesthetic enhances the sense of urgency and potential
Free with trial Slices of onions are arranged in concentric circles, forming a tunnel-like perspective. The layers of translucent white onion gradually decrease in size towards the center, where a bright light radiates, creating an illuminated effect. The rings are uniform, highlighting the onion's natural pattern and texture. This creates a captivating visual resembling a tunnel or vortex, showcasing the intricate beauty of the onion's structure. Line decrease illustrations Multiple, uniform onion slices arranged and stacked, creating a receding, linear perspective of a tunnel. Slices of onions are arranged in concentric circles, forming a tunnel-like perspective. The layers of translucent white onion gradually decrease in size towards the center, where a bright light radiates, creating an illuminated effect. The rings are uniform, highlighting the onion's natural pattern and texture. This creates a captivating visual resembling a tunnel or vortex, showcasing the intricate beauty of the onion's structure.
Free with trial A cartoon Bitcoin character is presenting a chart showing cryptocurrency market trends. The image is suitable for illustrating financial news, investment advice, or educational materials about Bitcoin and the crypto market. Line decrease illustrations Bitcoin Cartoon Character Explaining Crypto Market Trends. A cartoon Bitcoin character is presenting a chart showing cryptocurrency market trends. The image is suitable for illustrating financial news, investment advice, or educational materials about Bitcoin and the crypto market.
Free with trial Doodle style bar chart with a downward trending arrow indicating financial loss. Line decrease vectors Doodle style bar chart with a downward trending arrow indicating financial loss
Free with trial A minimalist abstract background featuring a series of thin, black concentric circles against a light, neutral backdrop. The circles decrease in size towards the center, creating a sense of depth and focus. This clean, geometric design evokes a feeling of order, precision, and modern aesthetics, making it suitable for a wide range of design applications. Line decrease illustrations Concentric Circles Abstract Background. A minimalist abstract background featuring a series of thin, black concentric circles against a light, neutral backdrop. The circles decrease in size towards the center, creating a sense of depth and focus. This clean, geometric design evokes a feeling of order, precision, and modern aesthetics, making it suitable for a wide range of design applications.
Free with trial A simple black vector illustration of a simple checkmark inside a circle, set against a white background, composed of basic geometric shapes, large circle, two perpendicular lines --chaos 30 --ar 16:9 --v 7 Job ID: e5716674-c7ae-40bc-b54b-07f4d0cf3160. Line decrease illustrations Black Circle with Inner V Symbol. a simple black vector illustration of a simple checkmark inside a circle, set against a white background, composed of basic geometric shapes, large circle, two perpendicular lines --chaos 30 --ar 16:9 --v 7 Job ID: e5716674-c7ae-40bc-b54b-07f4d0cf3160
Free with trial Illustration of a hand holding a magnifying glass over a financial chart showing business growth and success. The image represents data analysis, investment strategy, and market trends in a visually appealing way. Line decrease illustrations Business Growth Analysis Magnifying Glass on Financial Chart. Illustration of a hand holding a magnifying glass over a financial chart showing business growth and success. The image represents data analysis, investment strategy, and market trends in a visually appealing way.
Free with trial Falling financial chart with a sharp decline. Space for text. Line decrease illustrations Falling financial chart with a sharp decline. Space for text.
Free with trial Design dehydration water droplet with half water insisiting dehration concept medical illustration icon. Line decrease illustrations Dehydration water droplet with half water insisiting dehration concept medical illustration icon
Free with trial A dramatic business concept image showing a person in a business suit holding a glowing red line graph that is trending downwards with an arrow. The background is a blurred view of stock market ticker screens, clearly linking the downward trend to a financial market crash, recession, or investment loss. Generative AI. Line decrease illustrations A person in a suit holding a plunging red arrow graph in front of stock market screens. A dramatic business concept image showing a person in a business suit holding a glowing red line graph that is trending downwards with an arrow. The background is a blurred view of stock market ticker screens, clearly linking the downward trend to a financial market crash, recession, or investment loss. Generative AI.
Free with trial Decreasing graph icon Business chart with downward arrow Financial loss symbol. Line decrease vectors Decreasing graph icon Business chart with downward arrow Financial loss symbol
Free with trial Stacked chevron arrows inside a circular refresh loop, modern design illustration. Line decrease vectors Stacked chevron arrows inside a circular refresh loop, modern design illustration
Free with trial Black outline of descending bar chart with downward arrow, isolated on white background. concept of economic decline, data analysis, financial crisis, statistics. Line decrease vectors Black outline of descending bar chart with downward arrow, isolated on white background. concept of economic decline, data
Free with trial White isometric icons representing various financial concepts, including money, transactions, and data management, are depicted against a black background. These clean, modern icons are ideal for financial applications, websites, or presentations. Line decrease illustrations Isometric Finance Icons. White isometric icons representing various financial concepts, including money, transactions, and data management, are depicted against a black background. These clean, modern icons are ideal for financial applications, websites, or presentations.
Free with trial Simple yet effective double lined bold down arrow icon, ideal for website design and app interfaces. This vector illustration symbolizes downloading, saving, or accessing content. Line decrease vectors Double Lined Bold Down Arrow Icon Download Button Symbol. Simple yet effective double lined bold down arrow icon, ideal for website design and app interfaces. This vector illustration symbolizes downloading, saving, or accessing content.
Free with trial Hand-drawn financial charts, graphs, and calculators perfect for business, finance, and accounting illustrations. These vector illustrations depict various tools used for data analysis and financial calculations. Line decrease vectors Collection of Hand Drawn Financial Charts and Calculators. Hand-drawn financial charts, graphs, and calculators perfect for business, finance, and accounting illustrations. These vector illustrations depict various tools used for data analysis and financial calculations.
Free with trial A neon glowing graph with blue bars and pink zigzag arrow showing fluctuating growth on black background. Generative AI. Line decrease illustrations Neon glowing graph with blue bars and pink zigzag arrow showing fluctuating growth on black background
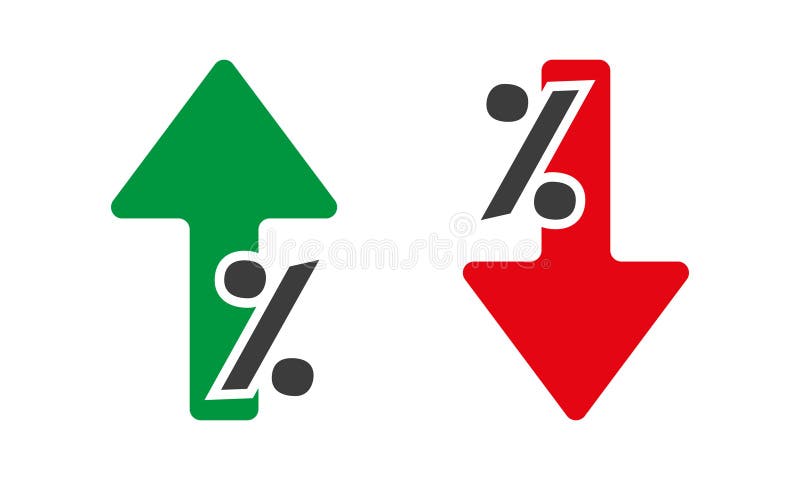
Free with trial Percentage with arrow up and down. Percentage arrow with percent sign. Design concept for banking, credit, interest rate, finance and money sphere. Line decrease vectors Percentage with arrow up and down. Percentage arrow with percent sign.
Free with trial Three dark grey arrows pointing downwards, stacked vertically, create a simple yet effective visual. This minimalist design is perfect for website interfaces, presentations, or any project requiring a clear indication of downward movement or progression. Line decrease vectors Three Stacked Down Arrows: Simple Geometric Design Element. Three dark grey arrows pointing downwards, stacked vertically, create a simple yet effective visual. This minimalist design is perfect for website interfaces, presentations, or any project requiring a clear indication of downward movement or progression.
Free with trial Simple square button with plus and minus icons. This clean design is perfect for website or app interfaces. Line decrease vectors Adding New Item, Interface Icon Design, Plus and Minus Sign. Simple square button with plus and minus icons. This clean design is perfect for website or app interfaces.
Free with trial This image showcases a simple yet bold black down arrow icon, perfect for website design, app interfaces, or presentations. The clean and modern design ensures versatility across various applications. Line decrease vectors Bold Black Down Arrow Icon Simple, Clean, and Modern Design. This image showcases a simple yet bold black down arrow icon, perfect for website design, app interfaces, or presentations. The clean and modern design ensures versatility across various applications.
Free with trial Concentric circles in varying shades of blue are arranged on a dark blue background. The circles decrease in size towards the center, creating a ripple effect. The design is symmetrical, with smooth, evenly spaced lines that lend a sense of depth and movement. The overall aesthetic is modern and minimalist, emphasizing geometric forms in a soothing color palette. , A i generated. Line decrease illustrations Abstract illustration of concentric circles in blue shades on a dark blue background. Concentric circles in varying shades of blue are arranged on a dark blue background. The circles decrease in size towards the center, creating a ripple effect. The design is symmetrical, with smooth, evenly spaced lines that lend a sense of depth and movement. The overall aesthetic is modern and minimalist, emphasizing geometric forms in a soothing color palette., A i generated
Free with trial Graph depiction on paper with a pencil ,Generative ai. Line decrease illustrations Pencil and paper, a detailed illustration of graph for data analysis visualization. Graph depiction on paper with a pencil ,Generative ai
Free with trial Red falling arrow and declining chart with stock market data overlay on office interior background, symbolizing global financial collapse impact. Line decrease illustrations Financial market crash with red downward arrow and stock graph lines descending sharply over modern office background during. Red falling arrow and declining chart with stock market data overlay on office interior background, symbolizing global financial collapse impact
Free with trial Digital illustration depicting a financial decline with red downward-trending graphs, coin stacks, and scattered currency symbols. Set against a dark grid background with neon highlights, this image conveys themes of market loss, economic recession, and financial analysis�ideal for business, editorial, and presentation use. Line decrease illustrations Economic Downturn Illustration Red Decline Graph with Coin Stacks on Digital Grid. Digital illustration depicting a financial decline with red downward-trending graphs, coin stacks, and scattered currency symbols. Set against a dark grid background with neon highlights, this image conveys themes of market loss, economic recession, and financial analysis�ideal for business, editorial, and presentation use.
Free with trial Three black arrows are arranged vertically on a white background, each featuring double-chevron designs. The arrows decrease in width from left to right, and the chevrons within each arrow create a repetitive, geometric pattern. The simplicity and boldness of the black-and-white contrast enhance the visual impact of the chevron motifs. Line decrease vectors Three black arrows are arranged vertically on a white background, each featuring double-chevron designs.
Free with trial A stock market chart with a downward trend and shattered glass evokes a sense of financial loss and failure, and is used to illustrate economic downturns or market crashes. Line decrease illustrations Financial Downfall Stock Market Chart with Shattered Glass. A stock market chart with a downward trend and shattered glass evokes a sense of financial loss and failure, and is used to illustrate economic downturns or market crashes
Free with trial Abstract design featuring flowing red and blue waves on the right side. The background is a gradient of grayish white with dotted patterns that gradually decrease in size, creating a sense of depth and movement. The color contrast highlights the dynamic curves against the subtle background, ideal for contemporary graphic design projects or digital interfaces. Line decrease vectors Blue red abstract waves background design images. Abstract design featuring flowing red and blue waves on the right side. The background is a gradient of grayish white with dotted patterns that gradually decrease in size, creating a sense of depth and movement. The color contrast highlights the dynamic curves against the subtle background, ideal for contemporary graphic design projects or digital interfaces.
Free with trial Collection of various red infographic elements including charts, graphs, diagrams, and symbols, perfect for presentations and data visualization. Ideal for showcasing data trends, progress, and comparisons. Easily customizable and adaptable to diverse projects. Line decrease illustrations Red Infographic Elements
Free with trial A minimalist cartoon-style illustration on a white background depicts a green horseshoe-shaped symbol on the left with two arrows pointing toward it, one green arrow entering from the left and a larger red arrow exiting to the right, pointing downward to signify a decreasing trend in cancer diagnoses, while a second red arrow points upward, creating a contrast that visually communicates changing. Line decrease illustrations Cancer diagnosis decline concept with arrows and horseshoe shape. A minimalist cartoon-style illustration on a white background depicts a green horseshoe-shaped symbol on the left with two arrows pointing toward it, one green arrow entering from the left and a larger red arrow exiting to the right, pointing downward to signify a decreasing trend in cancer diagnoses, while a second red arrow points upward, creating a contrast that visually communicates changing
Free with trial A conceptual vector illustration depicting business analysis and market research. A hand holds a magnifying glass, focusing on a colorful financial chart with bar and line graphs labeled 'Market Trends'. Surrounding icons represent key business metrics like growth, decline, market share, and innovation. This flat design graphic is ideal for presentations, reports, and web content related to data analytics, strategic planning, and financial performance evaluation, symbolizing the scrutiny of data to identify opportunities and understand market dynamics. Line decrease illustrations Business Analysis and Market Trends Concept with Magnifying Glass. A conceptual vector illustration depicting business analysis and market research. A hand holds a magnifying glass, focusing on a colorful financial chart with bar and line graphs labeled 'Market Trends'. Surrounding icons represent key business metrics like growth, decline, market share, and innovation. This flat design graphic is ideal for presentations, reports, and web content related to data analytics, strategic planning, and financial performance evaluation, symbolizing the scrutiny of data to identify opportunities and understand market dynamics.
Free with trial Stylized Blue and Yellow Arrows Pointing in Opposite Directions, Vector Illustration. Line decrease vectors Stylized Blue and Yellow Arrows Pointing in Opposite Directions, Vector Illustration
Free with trial The image displays a series of evenly spaced concentric circles, each outlined with dotted lines. The circles gradually decrease in size from the outermost to the innermost, creating a symmetrical, target-like structure. The design is minimalistic and appears to be hand-drawn or digitally sketched with a consistent line weight. Line decrease illustrations Concentric circles pattern with dotted lines forming a target-li. The image displays a series of evenly spaced concentric circles, each outlined with dotted lines. The circles gradually decrease in size from the outermost to the innermost, creating a symmetrical, target-like structure. The design is minimalistic and appears to be hand-drawn or digitally sketched with a consistent line weight
Free with trial Simple icon design featuring a double-lined, rounded rectangle shape with a minus sign centrally positioned. Perfect for minimalist designs and user interfaces. Line decrease vectors Double Lined Rounded Rectangle Shape Icon Minus Sign Inside. Simple icon design featuring a double-lined, rounded rectangle shape with a minus sign centrally positioned. Perfect for minimalist designs and user interfaces.
Free with trial Stylized black magnifying glass icon with a minus sign inside. Represents functionality to remove or reduce search results. Simplified, bold lines create a clear, strong visual contrast on a white background. Often used in digital interfaces or applications to symbolize the option to exclude, filter out, or decrease information. Line decrease vectors Magnifying Glass with Minus Icon: Remove Search Result Symbol. Stylized black magnifying glass icon with a minus sign inside. Represents functionality to remove or reduce search results. Simplified, bold lines create a clear, strong visual contrast on a white background. Often used in digital interfaces or applications to symbolize the option to exclude, filter out, or decrease information.
Free with trial Depositing money, financial savings, wealth accumulation, growing funds, investment growth. Line decrease vectors Stack of Coins with Download Arrows: Financial Savings Concept. Depositing money, financial savings, wealth accumulation, growing funds, investment growth.
Free with trial Financial Growth Chart on a Suitcase Business Investment Economy Graphic Illustration. Line decrease vectors Financial Growth Chart on a Suitcase Business Investment Economy Graphic Illustration
Free with trial Magnifying glass with reduce CO2 emissions carbon symbol on green background. Line decrease vectors Magnifying glass with reduce CO2 emissions carbon symbol
Free with trial Simple square button design, perfect for user interface design. Clean lines and minimalist style. Ideal for websites and app development. Line decrease vectors Abstract Square Button Interface Design, Modern Graphic Element. Simple square button design, perfect for user interface design. Clean lines and minimalist style. Ideal for websites and app development.
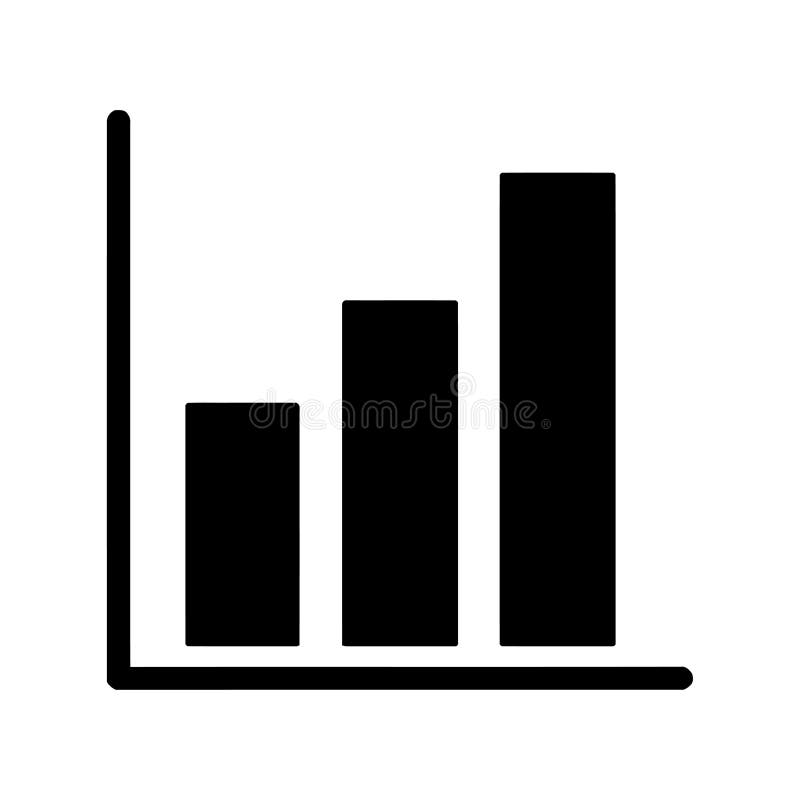
Free with trial Understanding bar graph charts data analysis and visualization for business and financial performance metrics. Line decrease vectors Understanding bar graph charts data analysis and visualization for business
Free with trial Business data is visually represented in black and white through various charts and graphs illustrating growth analysis and strategic planning for financial reporting showing a clear picture of market. Line decrease vectors Black and white business data visualization with charts and graphs showing growth and analysis for financial reporting and. Business data is visually represented in black and white through various charts and graphs illustrating growth analysis and strategic planning for financial reporting showing a clear picture of market
Free with trial A collection of minimalist, gray 3D icons representing various data points and processes, including charts, graphs, documents, cloud computing, location markers, and alerts. The design suggests data analysis, project management, or business intelligence concepts. Line decrease illustrations Data Visualization Icons. A collection of minimalist, gray 3D icons representing various data points and processes, including charts, graphs, documents, cloud computing, location markers, and alerts. The design suggests data analysis, project management, or business intelligence concepts.
Free with trial Bitcoin failing graph crypto currency. Coin B symbol finance economy banking system. Blockchain extra crash with lightning negative forecast for decline in value vector illustration. Line decrease vectors Bitcoin failing graph crypto currency. Coin B symbol finance economy banking system. Blockchain extra crash with
Free with trial 3D illustration of a red bar chart with a downward arrow, isolated on a transparent background. Symbolizes financial loss, economic crisis, revenue drop, or business decline. Ideal for presentations, finance reports, investment warnings, stock market analysis, and economic downturn visuals. Line decrease illustrations 3D Red Downward Arrow Graph Icon Showing Financial Decline on Transparent Background. 3D illustration of a red bar chart with a downward arrow, isolated on a transparent background. Symbolizes financial loss, economic crisis, revenue drop, or business decline. Ideal for presentations, finance reports, investment warnings, stock market analysis, and economic downturn visuals.
Free with trial People drive the stock market and that is the theme of this illustration of people on an up and down stock market chart. Line decrease illustrations People drive the stock market
Free with trial A simple bar graph illustrating upward growth and financial success. Ideal for presentations, reports, and website use. Line decrease vectors Upward Trending Bar Graph: Business Growth and Financial Success. A simple bar graph illustrating upward growth and financial success. Ideal for presentations, reports, and website use.
Free with trial A clean, minimalist 3D render depicts a series of white arrows of varying heights arranged in a graph-like formation. The tallest arrows, on the left, are illuminated with a warm, orange glow, symbolizing growth, success, and positive trends. The arrows decrease in size towards the right, suggesting a progression or trend line. The reflective surface and bright, airy background create a modern and optimistic feel, ideal for business, finance, and technology-related concepts. Line decrease illustrations Rising Arrows Graph. A clean, minimalist 3D render depicts a series of white arrows of varying heights arranged in a graph-like formation. The tallest arrows, on the left, are illuminated with a warm, orange glow, symbolizing growth, success, and positive trends. The arrows decrease in size towards the right, suggesting a progression or trend line. The reflective surface and bright, airy background create a modern and optimistic feel, ideal for business, finance, and technology-related concepts.
Free with trial A 3D icon depicting two orange arrows pointing inwards. The arrows suggest contraction, reduction, or minimizing. This icon is commonly used to represent actions such as collapsing a window, zooming out on an image, or decreasing the size of a content element. Line decrease vectors Minimize Arrow 3D Icon. A 3D icon depicting two orange arrows pointing inwards. The arrows suggest contraction, reduction, or minimizing. This icon is commonly used to represent actions such as collapsing a window, zooming out on an image, or decreasing the size of a content element.
Free with trial Tax blocks with percentage symbol and up and down arrows on financial charts, concept of tax rate changes and fiscal policy featuring taxes, taxation, percent with VAT and government elements for. Line decrease illustrations Tax blocks with percentage symbol and up and down arrows on financial charts
Free with trial A red downward arrow with a black outline stands prominently against a white background. Line decrease illustrations Red downward arrow
Free with trial An optical illusion featuring a geometric, 3D tunneling effect created with a red and white checkered pattern. The squares decrease in size toward the center, enhancing the illusion of depth and perspective. The design is framed by thin red lines, emphasizing the rectangular shape. Clean lines and contrasting colors contribute to the visual impact of the artwork. Line decrease vectors Vector art of data analysis and business analytics concept, business people analyzing financial graph and chart. An optical illusion featuring a geometric, 3D tunneling effect created with a red and white checkered pattern. The squares decrease in size toward the center, enhancing the illusion of depth and perspective. The design is framed by thin red lines, emphasizing the rectangular shape. Clean lines and contrasting colors contribute to the visual impact of the artwork.
Free with trial A vibrant bar graph shows an upward trend with a green arrow, indicating growth. The bars are blue, yellow, green, and red, set against a clean white background. Line decrease illustrations Colorful Bar Graph with Upward Trend Line and Green Arrow Indicator on White Background. A vibrant bar graph shows an upward trend with a green arrow, indicating growth. The bars are blue, yellow, green, and red, set against a clean white background
Free with trial Reciprocal tariffs and stock market crashes and economic decline or falling stock market prices. Line decrease illustrations Reciprocal tariffs and stock market crashes and economic decline or falling stock market prices
Free with trial Illustration of economic growth is depicted by a green staircase ascending toward light, symbolizing progress and increased prosperity. Line decrease vectors Illustration of economic growth is depicted by a green staircase ascending toward light
Free with trial Green thermometer with arc and downward arrows indicating temperature change or comparison. Line decrease vectors Green thermometer with arc and downward arrows indicating temperature change or comparison
Free with trial Dimensional minus sign in a circle hand drawn doodle style icon for subtraction or removal. Line decrease vectors Dimensional minus sign in a circle hand drawn doodle style icon for subtraction or removal
Free with trial Flat design business icons depict various charts, percentage signs, targets, hierarchical diagrams, and coin stacks representing financial growth and data analysis in monochrome. Generative AI. Line decrease vectors Black and white flat design business icons including charts percentage target and money stacks illustrating financial growth and. Flat design business icons depict various charts, percentage signs, targets, hierarchical diagrams, and coin stacks representing financial growth and data analysis in monochrome. Generative AI
Free with trial Red line graph shows a sharp stock market decline. Economic downturn visualized. Line decrease illustrations Stock Market Decline: A Visual Representation of Economic Downturn. Red line graph shows a sharp stock market decline. Economic downturn visualized
Free with trial Financial chart displays data points and lines indicating trends against a blue background and is useful for presentations. Line decrease illustrations Financial Data on Chart. Financial chart displays data points and lines indicating trends against a blue background and is useful for presentations
Free with trial Layered hearts design featuring three overlapping hearts in various shades of pink and red, arranged vertically. The hearts decrease in size from bottom to top, creating a layered look. The colors transition from a light pink at the bottom to a deeper red at the top. The white background enhances the simplicity and clarity of the icon, making it effective for visual communications related to love or affection. Line decrease vectors Layered Heart Love Icon. Layered hearts design featuring three overlapping hearts in various shades of pink and red, arranged vertically. The hearts decrease in size from bottom to top, creating a layered look. The colors transition from a light pink at the bottom to a deeper red at the top. The white background enhances the simplicity and clarity of the icon, making it effective for visual communications related to love or affection.
Free with trial A subtraction drawn with a black marker with a transparent background. Line decrease vectors A subtraction drawn with a black marker
Free with trial This image shows a downward-trending red arrow graph, generated by AI, illustrating a significant decline. The visual representation is clear and effective in communicating a negative trend, potentially in stock prices, sales figures, or other quantifiable data. Line decrease illustrations Downward Trending Graph. This image shows a downward-trending red arrow graph, generated by AI, illustrating a significant decline. The visual representation is clear and effective in communicating a negative trend, potentially in stock prices, sales figures, or other quantifiable data.
Free with trial A red neon downward arrow on a black background with a reflection. generative ai. Line decrease illustrations Red neon downward arrow
Free with trial Abstract stipple gradient design features a central dark square with edges radiating outward, creating a 3D illusion. The pattern uses densely packed small dots that gradually decrease in density towards the edges, forming a tunnel-like effect. The shading transitions smoothly from deep navy at the center to lighter tones at the outer sections, giving a sense of depth and movement. The background is a light, neutral color, enhancing the contrast and giving prominence to the stipple effect. Line decrease illustrations Abstract Stipple Gradient Square Background Design. Abstract stipple gradient design features a central dark square with edges radiating outward, creating a 3D illusion. The pattern uses densely packed small dots that gradually decrease in density towards the edges, forming a tunnel-like effect. The shading transitions smoothly from deep navy at the center to lighter tones at the outer sections, giving a sense of depth and movement. The background is a light, neutral color, enhancing the contrast and giving prominence to the stipple effect.
Free with trial An illustration depicting a row of houses and coins falling on a downward arrow, symbolizing a decline in the housing market or real estate values. The image features a red background with a wavy line and a large red arrow pointing downwards, conveying a sense of decrease or recession. Line decrease illustrations Houses on a Downward Trend. An illustration depicting a row of houses and coins falling on a downward arrow, symbolizing a decline in the housing market or real. An illustration depicting a row of houses and coins falling on a downward arrow, symbolizing a decline in the housing market or real estate values. The image features a red background with a wavy line and a large red arrow pointing downwards, conveying a sense of decrease or recession.
Free with trial Shimmering turquoise sequins are sprinkled across the upper half of a vivid blue background. The sequins, round and glossy, reflect light, creating a sparkling effect. They gradually decrease in density, leaving the lower portion of the image as a solid, uninterrupted expanse of blue. The overall effect is one of fluid, underwater-like texture, evoking a sense of movement and light play. Line decrease illustrations Wallpaper Glitter 5 - 136. Shimmering turquoise sequins are sprinkled across the upper half of a vivid blue background. The sequins, round and glossy, reflect light, creating a sparkling effect. They gradually decrease in density, leaving the lower portion of the image as a solid, uninterrupted expanse of blue. The overall effect is one of fluid, underwater-like texture, evoking a sense of movement and light play.
Free with trial Blue graphs and charts depicting financial analysis and market trends with fountain pen. Line decrease illustrations Blue graphs and charts depicting financial analysis and market trends with
Free with trial Candlestick chart with red and white bars representing stock price changes over time. Red candles indicate price decrease, while white suggest price increase. Vertical lines, or "wicks," show high and low prices. A white line, possibly a moving average, intersects the candles, offering a smooth trend indication. The background is dark blue with faint grid lines and circular elements, enhancing the financial data visualization aspect. Line decrease illustrations Candlestick chart showing stock market trends and financial analysis. Candlestick chart with red and white bars representing stock price changes over time. Red candles indicate price decrease, while white suggest price increase. Vertical lines, or "wicks," show high and low prices. A white line, possibly a moving average, intersects the candles, offering a smooth trend indication. The background is dark blue with faint grid lines and circular elements, enhancing the financial data visualization aspect.
Free with trial Download button, web design element, simple arrow, black arrow, direction icon, pointer, interface symbol, user interface, website design, app design, graphic design. Line decrease vectors Simple Bold Black Down Arrow Icon, Download Button, Web Design Element. Download button, web design element, simple arrow, black arrow, direction icon, pointer, interface symbol, user interface, website design, app design, graphic design.
Free with trial This image presents a striking composition of four square shapes, each featuring a concentric square pattern in black and white. The squares are arranged in a 2x2 grid, with each square containing a series of concentric squares that decrease in size towards the center. Line decrease illustrations Minimalist Geometric Abstract Background with Concentric Squares in Grid Layout. This image presents a striking composition of four square shapes, each featuring a concentric square pattern in black and white. The squares are arranged in a 2x2 grid, with each square containing a series of concentric squares that decrease in size towards the center.
Free with trial The image presents a striking arrangement of four square shapes, each comprising concentric squares that gradually decrease in size towards the center. Line decrease illustrations Minimalist Geometric Abstract Background with Concentric Squares in Grid Layout. The image presents a striking arrangement of four square shapes, each comprising concentric squares that gradually decrease in size towards the center.
Free with trial Undo delete or remove outline symbol with looping arrow for graphic element and design projects on white background. Line decrease vectors Undo delete or remove outline symbol with looping arrow for graphic element and design projects on white background