Free with trial Image Compression Outline Icon Vector Linear File Shrink Symbol for Web Optimization Isolated on White Background. Line decrease vectors Image Compression Outline Icon Vector Linear File Shrink Symbol for Web Optimization Isolated on White Background
Free with trial A minimalist black and white line drawing of a leafy branch. The design features a single vertical stem with multiple oval-shaped leaves arranged in a symmetrical pattern. Each leaf is drawn with simple curved lines, creating a leaf-like shape with pointed tips. The leaves are arranged in a fan pattern along the central stem. The drawing has clean, continuous black lines on a white background, with no shading or texture details. The leaves decrease in size as they move away from the main stem. The entire design is a single continuous line drawing with no breaks or gaps in the line work. Line decrease vectors Symmetrical leafy branch with oval leaves drawn in continuous black lines. A minimalist black and white line drawing of a leafy branch. The design features a single vertical stem with multiple oval-shaped leaves arranged in a symmetrical pattern. Each leaf is drawn with simple curved lines, creating a leaf-like shape with pointed tips. The leaves are arranged in a fan pattern along the central stem. The drawing has clean, continuous black lines on a white background, with no shading or texture details. The leaves decrease in size as they move away from the main stem. The entire design is a single continuous line drawing with no breaks or gaps in the line work.
Free with trial Illustration of a business activities. Line decrease vectors Illustration of a business activities
Free with trial Concept depicting financial security risk and economic recession. Line decrease illustrations Financial Security Risk Analysis Recession Under Scrutiny. Concept depicting financial security risk and economic recession.
Free with trial Conceptual icon depicting declining mental health or cognitive decline. Line decrease illustrations Declining Mental Health Brain, Chart, Magnifying Glass Icon. Conceptual icon depicting declining mental health or cognitive decline.
Free with trial This image depicts a financial downturn, with stacks of coins decreasing under a magnifying glass, accompanied by a. Line decrease illustrations Economic Downturn Magnifying Glass on Falling Money Graph. This image depicts a financial downturn, with stacks of coins decreasing under a magnifying glass, accompanied by a.
Free with trial A green arrow graph displaying a sharp decline, indicating a downward trend. Line decrease vectors Green arrow decline graph showing downward trend. A green arrow graph displaying a sharp decline, indicating a downward trend.
Free with trial A series of five red paper hearts are arranged diagonally across a vibrant blue background. The hearts decrease in size from the bottom left corner to the top right, creating a sense of progression. The clean, minimalist composition highlights the iconic symbol of love against a solid, bright color. Line decrease illustrations Red Paper Hearts Arranged in a Diagonal Line on a Bright Blue Background love symbol. A series of five red paper hearts are arranged diagonally across a vibrant blue background. The hearts decrease in size from the bottom left corner to the top right, creating a sense of progression. The clean, minimalist composition highlights the iconic symbol of love against a solid, bright color
Free with trial A collection of eight thin-line related to finance and business. The depict a stack of coins with a dollar sign, a document with a dollar sign, an upward trending graph over city buildings, and a bar chart with a plus sign. The bottom row coins and currency symbols, a calculator with a dollar sign, a document with a calculator and charts, and a person. Line decrease illustrations Financial set with charts and calculator finance business. A collection of eight thin-line related to finance and business. The depict a stack of coins with a dollar sign, a document with a dollar sign, an upward trending graph over city buildings, and a bar chart with a plus sign. The bottom row coins and currency symbols, a calculator with a dollar sign, a document with a calculator and charts, and a person
Free with trial A digital illustration depicting a Bitcoin crash. A glowing Bitcoin symbol is shown breaking apart with a downward trending line graph overlaid on a dark, grid-like background. The image represents financial loss, market volatility, and the risks associated with cryptocurrency investments. Suitable for illustrating articles about economic downturns, crypto market analysis, and investment strategies. Line decrease illustrations Bitcoin Crash: Market Downturn Concept. A digital illustration depicting a Bitcoin crash. A glowing Bitcoin symbol is shown breaking apart with a downward trending line graph overlaid on a dark, grid-like background. The image represents financial loss, market volatility, and the risks associated with cryptocurrency investments. Suitable for illustrating articles about economic downturns, crypto market analysis, and investment strategies.
Free with trial An empty corporate conference room featuring a large wooden table, office chairs, and a whiteboard displaying a hand-drawn graph indicating a downward trend in performance. Line decrease illustrations Modern Office Conference Room Showing Financial Loss Chart. An empty corporate conference room featuring a large wooden table, office chairs, and a whiteboard displaying a hand-drawn graph indicating a downward trend in performance
Free with trial A downward trending bar graph with a question mark is examined under a magnifying glass, symbolizing uncertainty and. Line decrease illustrations Decreasing Chart Under Magnifying Glass with Question Mark. A downward trending bar graph with a question mark is examined under a magnifying glass, symbolizing uncertainty and.
Free with trial Financial income expenses. Gear economy Vector. Money dollar control. Business optimization symbol. EPS 10. Line decrease vectors Financial income expenses. Gear economy Vector. Money dollar control. Business optimization symbol
Free with trial This vector collection features a diverse set of down arrow icons, presented in black and white. The assortment includes various styles such as filled, outlined, geometric, and curved designs, all pointing downwards. Ideal for indicating download, scroll, navigation, or other downward actions. Perfect for modern UI UX design, web applications, mobile apps, infographics, and digital presentations, offering versatile visual elements for user interfaces. Line decrease vectors Down Arrow Icons Set - Vector Collection for UI and Web Design. This vector collection features a diverse set of down arrow icons, presented in black and white. The assortment includes various styles such as filled, outlined, geometric, and curved designs, all pointing downwards. Ideal for indicating download, scroll, navigation, or other downward actions. Perfect for modern UI UX design, web applications, mobile apps, infographics, and digital presentations, offering versatile visual elements for user interfaces.
Free with trial A magnifying glass focuses on a dollar sign with a downward arrow, symbolizing cost reduction, economic downturn, or. Line decrease illustrations Cost Reduction Analysis Magnifying Glass on Downward Dollar. A magnifying glass focuses on a dollar sign with a downward arrow, symbolizing cost reduction, economic downturn, or.
Free with trial Percentage growth and decline icons. Percent arrow up and down flat style symbols. Vector illustration. Line decrease vectors Percentage growth and decline icons. Percent arrow up and down flat style symbols. Vector illustration
Free with trial Black and white graph with dollar signs and decreasing trend line on white background. Line decrease vectors Black map pin icon with white circle in center. Black and white graph with dollar signs and decreasing trend line on white background
Free with trial Outline vector graphic depicting a decline in business performance. Line decrease illustrations Declining Performance Gear, Man, Graph, Arrow. Business Downturn. Outline vector graphic depicting a decline in business performance.
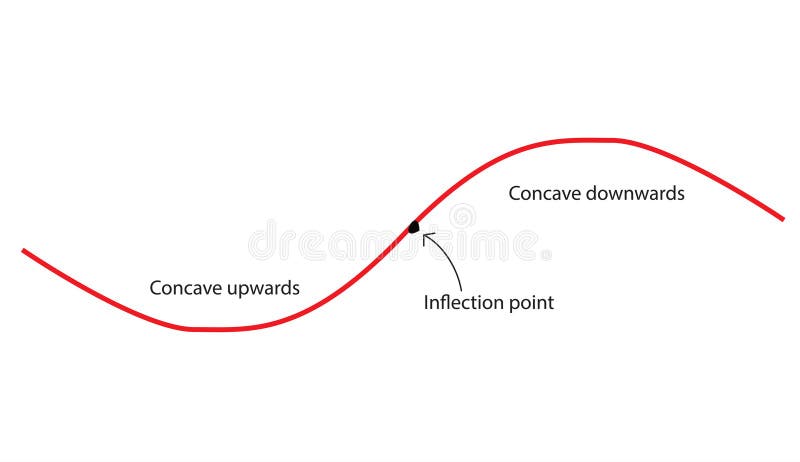
Free with trial Concavity of curve. Inflection point, concave down and concave up. Second derivative tangent lines of function. Line decrease vectors Concavity of curve
Free with trial A black and white minimalist line art illustration of a circular spiral design. The design consists of a series of curved lines arranged in concentric layers, creating a spiral pattern that rotates clockwise. The lines are thick and bold, forming a series of overlapping loops that decrease in size towards the center. The spiral has a hollow center creating a perfect circle. The entire design is rendered in solid black against a white background. The lines have a consistent thickness and maintain smooth curves throughout the spiral pattern. The illustration has a clean, geometric quality with sharp edges and precise line work. Line decrease vectors Circular spiral pattern in bold black lines with hollow center. A black and white minimalist line art illustration of a circular spiral design. The design consists of a series of curved lines arranged in concentric layers, creating a spiral pattern that rotates clockwise. The lines are thick and bold, forming a series of overlapping loops that decrease in size towards the center. The spiral has a hollow center creating a perfect circle. The entire design is rendered in solid black against a white background. The lines have a consistent thickness and maintain smooth curves throughout the spiral pattern. The illustration has a clean, geometric quality with sharp edges and precise line work.
Free with trial Collection of simple black vector icons representing financial charts, data analysis graphs, and business statistics. Includes trend arrows, magnifier, and settings symbols. Line decrease vectors Set of black business graph and chart icons for data analysis. Collection of simple black vector icons representing financial charts, data analysis graphs, and business statistics. Includes trend arrows, magnifier, and settings symbols
Free with trial This illustration depicts a financial concept with a bar graph showing a downward trend, alternating between green (profit) and red (loss) bars. A red line graph with an arrow indicates a significant decline. To the right, a stack of documents represents a profit and loss statement, with 'Profit' and 'Loss' clearly labeled. This visual is ideal for representing financial performance, business challenges, economic downturns, or the need for strategic adjustments. Line decrease vectors Declining Profit and Loss Statement with Downward Trend Graph. This illustration depicts a financial concept with a bar graph showing a downward trend, alternating between green (profit) and red (loss) bars. A red line graph with an arrow indicates a significant decline. To the right, a stack of documents represents a profit and loss statement, with 'Profit' and 'Loss' clearly labeled. This visual is ideal for representing financial performance, business challenges, economic downturns, or the need for strategic adjustments.
Free with trial A magnifying glass focuses on a downward trend graph and briefcase, symbolizing economic downturn analysis and market. Line decrease illustrations Economic Downturn Analysis Magnifying Glass on Market Decline. A magnifying glass focuses on a downward trend graph and briefcase, symbolizing economic downturn analysis and market.
Free with trial Doodle Graph icon. Blue pen hand drawn infographic symbol on a notepaper piece. Line art style graphic design element. Web button with shadow. Decline, save on expences concept. Line decrease vectors Doodle Graph icon
Free with trial The image displays a digital graphic of a single red arrow. The arrow starts from the top-left portion of the frame, curves downward in a smooth arc, and terminates in a point directed towards the bottom-right. The style resembles a simple, thick, hand-drawn line. The background is plain white, making the red arrow stand out clearly. This type of icon is commonly used to symbolize concepts such as. Line decrease vectors A simple graphic illustration of a red curved arrow indicating downward movement and direction Vector. The image displays a digital graphic of a single red arrow. The arrow starts from the top-left portion of the frame, curves downward in a smooth arc, and terminates in a point directed towards the bottom-right. The style resembles a simple, thick, hand-drawn line. The background is plain white, making the red arrow stand out clearly. This type of icon is commonly used to symbolize concepts such as
Free with trial A flat design vector illustration depicting a financial market data board or stock ticker. The black-bordered display features various stock symbols, numerical values like '$ ,80K', '$ ,22,50', and indicators of market performance. Prominently highlighted in red is the word 'LOSING', accompanied by a red downward arrow signifying a price drop, and a red downward triangle. Conversely, a green upward arrow indicates a price increase. This icon effectively visualizes concepts of financial loss, gain, market volatility, and investment trends, suitable for business, finance, and economic content. Line decrease illustrations Financial Market Data Board Icon with Loss and Gain Indicators. A flat design vector illustration depicting a financial market data board or stock ticker. The black-bordered display features various stock symbols, numerical values like '$ ,80K', '$ ,22,50', and indicators of market performance. Prominently highlighted in red is the word 'LOSING', accompanied by a red downward arrow signifying a price drop, and a red downward triangle. Conversely, a green upward arrow indicates a price increase. This icon effectively visualizes concepts of financial loss, gain, market volatility, and investment trends, suitable for business, finance, and economic content.
Free with trial A blue holographic graph showing a downward trend with bars and a line chart is projected over a dark conference table and chairs. Line decrease illustrations Holographic graph displaying insurance reimbursement delays over a conference table chart. A blue holographic graph showing a downward trend with bars and a line chart is projected over a dark conference table and chairs
Free with trial A prominent 3D metallic US dollar sign stands against a dynamic digital background featuring various financial charts and graphs. The background displays a fluctuating line graph and a colorful bar chart, symbolizing market trends, economic data, and investment performance. This image powerfully conveys concepts of finance, global economy, currency strength, stock market analysis, and wealth management in a modern, digital context. Ideal for illustrating reports, presentations, or articles related to business, banking, and financial growth. Line decrease illustrations US Dollar Symbol with Digital Financial Charts and Market Data. A prominent 3D metallic US dollar sign stands against a dynamic digital background featuring various financial charts and graphs. The background displays a fluctuating line graph and a colorful bar chart, symbolizing market trends, economic data, and investment performance. This image powerfully conveys concepts of finance, global economy, currency strength, stock market analysis, and wealth management in a modern, digital context. Ideal for illustrating reports, presentations, or articles related to business, banking, and financial growth.
Free with trial Simple vector design of a percent icon. Features a large diagonal slash with two hollow circles, one at the top left and one at the bottom right. The lines are bold and black, set against a white background, creating a minimalist and clean appearance. Line decrease vectors Percent outline icon, simple vector design. Simple vector design of a percent icon. Features a large diagonal slash with two hollow circles, one at the top left and one at the bottom right. The lines are bold and black, set against a white background, creating a minimalist and clean appearance.
Free with trial A minimalist black and white line drawing of a leaf design. The leaf is drawn with clean, continuous black lines on a white background. The leaf has five elongated oval-shaped segments arranged in a symmetrical pattern along a central stem. Each segment has subtle curved lines within them, creating a delicate, flowing texture. The leaf design is positioned diagonally, with the stem extending from the bottom left to the upper right of the frame. The segments decrease in size towards the tip, creating a natural tapering effect. The drawing style is simple and artistic, with no shading or texture fill, maintaining a clean, graphic quality. Line decrease vectors Leaf with five oval segments tapering along central diagonal stem. A minimalist black and white line drawing of a leaf design. The leaf is drawn with clean, continuous black lines on a white background. The leaf has five elongated oval-shaped segments arranged in a symmetrical pattern along a central stem. Each segment has subtle curved lines within them, creating a delicate, flowing texture. The leaf design is positioned diagonally, with the stem extending from the bottom left to the upper right of the frame. The segments decrease in size towards the tip, creating a natural tapering effect. The drawing style is simple and artistic, with no shading or texture fill, maintaining a clean, graphic quality.
Free with trial Blue heart with heartbeat line, upward and downward arrows suggesting change. Ideal for health tracking, fitness, wellness, analytics, growth, decline, and simple landing page. Line decrease vectors Heartbeat and Arrows Indicating Increase and Decrease in Health and Wellness Indicators. Blue heart with heartbeat line, upward and downward arrows suggesting change. Ideal for health tracking, fitness, wellness, analytics, growth, decline, and simple landing page
Free with trial A clean and minimalist black outline icon of a percentage symbol, isolated on a pure white background. This versatile graphic represents discounts, sales, interest rates, financial calculations, and statistical data. Ideal for web design, mobile applications, business presentations, marketing materials, infographics, and educational content. Its simple, modern aesthetic makes it perfect for conveying concepts of proportion, growth, and change in a clear and concise manner. Line decrease illustrations Minimalist Percentage Symbol Outline Icon. A clean and minimalist black outline icon of a percentage symbol, isolated on a pure white background. This versatile graphic represents discounts, sales, interest rates, financial calculations, and statistical data. Ideal for web design, mobile applications, business presentations, marketing materials, infographics, and educational content. Its simple, modern aesthetic makes it perfect for conveying concepts of proportion, growth, and change in a clear and concise manner.
Free with trial Sad face alongside a line graph showing downward trends, small airport icon, and flight imagery. Ideal for travel analysis, business performance, economy, transportation, tourism, crisis impact. Line decrease illustrations Declining Travel Trends Represented by Graph and Sad Face. Sad face alongside a line graph showing downward trends, small airport icon, and flight imagery. Ideal for travel analysis, business performance, economy, transportation, tourism, crisis impact
Free with trial Arrow Direction and Percentage Icons for Business Growth Concept. Line decrease illustrations Arrow Direction and Percentage Icons for Business Growth Concept
Free with trial Red and green candlestick chart shows a descending pattern against a black background, creating a dramatic financial illustration for use in economic or investment themed visuals. Line decrease illustrations Descending Chart Pattern with Red and Green Candlesticks on Black. Red and green candlestick chart shows a descending pattern against a black background, creating a dramatic financial illustration for use in economic or investment themed visuals
Free with trial A conceptual vector illustration depicting a severe economic downturn. The image features a grey bar chart with progressively shorter bars, symbolizing declining profits or performance. A bold red arrow points sharply downwards, representing a crash or significant loss, alongside a blue line graph also showing a negative trend. This graphic is ideal for illustrating concepts such as financial crisis, recession, stock market crash, business failure, bankruptcy, and negative growth. Perfect for financial reports, business presentations, news articles, and economic analysis infographics. Line decrease illustrations Economic Downturn and Financial Crisis Graph. A conceptual vector illustration depicting a severe economic downturn. The image features a grey bar chart with progressively shorter bars, symbolizing declining profits or performance. A bold red arrow points sharply downwards, representing a crash or significant loss, alongside a blue line graph also showing a negative trend. This graphic is ideal for illustrating concepts such as financial crisis, recession, stock market crash, business failure, bankruptcy, and negative growth. Perfect for financial reports, business presentations, news articles, and economic analysis infographics.
Free with trial Full screen icon sign symbol logo vector illustrations. Line decrease vectors Full screen icon sign symbol logo vector
Free with trial Full screen icon sign symbol logo vector illustrations. Line decrease vectors Full screen icon sign symbol logo vector
Free with trial Full screen icon sign symbol logo vector illustrations. Line decrease vectors Full screen icon sign symbol logo vector
Free with trial A striking 3D rendering depicts a significant financial market decline, symbolized by a bold red arrow sharply pointing downwards across a dark grey background. The scene includes a subtle line graph and bar charts in shades of red and grey, illustrating a negative trend in data. This image effectively conveys concepts of economic recession, stock market crash, business losses, and financial crisis. Ideal for articles, presentations, and reports discussing market downturns, investment risks, or economic challenges. Line decrease illustrations Financial Market Decline with Red Arrow Chart. A striking 3D rendering depicts a significant financial market decline, symbolized by a bold red arrow sharply pointing downwards across a dark grey background. The scene includes a subtle line graph and bar charts in shades of red and grey, illustrating a negative trend in data. This image effectively conveys concepts of economic recession, stock market crash, business losses, and financial crisis. Ideal for articles, presentations, and reports discussing market downturns, investment risks, or economic challenges.
Free with trial A studio shot features five clear glasses of varying sizes arranged in a row. Each glass is filled with a vibrant blue liquid, and their reflections are visible on the smooth, dark surface below. The glasses are progressively larger from left to right, showcasing a range of volumes. Line decrease illustrations Five glasses of varying sizes filled with blue liquid and reflecting on a surface water drink. A studio shot features five clear glasses of varying sizes arranged in a row. Each glass is filled with a vibrant blue liquid, and their reflections are visible on the smooth, dark surface below. The glasses are progressively larger from left to right, showcasing a range of volumes
Free with trial An abstract image featuring a radial pattern of black, white, and gray squares. The squares decrease in size as they approach the center, creating a visual effect of depth and perspective. The pattern evokes a sense of motion and can be used for backgrounds, textures, or to represent concepts like focus, distortion, or optical illusions. Line decrease illustrations Abstract Checkerboard Radial Pattern. An abstract image featuring a radial pattern of black, white, and gray squares. The squares decrease in size as they approach the center, creating a visual effect of depth and perspective. The pattern evokes a sense of motion and can be used for backgrounds, textures, or to represent concepts like focus, distortion, or optical illusions.
Free with trial Minus Button Grey Round Icon Vector Design Element for User Interface Design. Line decrease vectors Minus Button Grey Round Icon Vector Design Element for User Interface Design
Free with trial A dynamic, futuristic digital display showing a falling stock market chart. This detailed financial graph features glowing red candlestick patterns and line charts indicating a significant downward trend and high volatility. The image represents concepts like an economic crisis, bear market, financial recession, investment risk, and a stock market crash. It's an ideal visual for business reports, financial news, technology articles, and presentations on global economics, trading, or fintech, conveying a sense of urgency and downturn. Line decrease illustrations Stock Market Crash and Financial Downturn Graph. A dynamic, futuristic digital display showing a falling stock market chart. This detailed financial graph features glowing red candlestick patterns and line charts indicating a significant downward trend and high volatility. The image represents concepts like an economic crisis, bear market, financial recession, investment risk, and a stock market crash. It's an ideal visual for business reports, financial news, technology articles, and presentations on global economics, trading, or fintech, conveying a sense of urgency and downturn.
Free with trial A 3D rendered illustration of a stock market candlestick chart is shown against a light blue background. The chart displays a mix of red and green candlesticks, indicating price fluctuations. A prominent red arrow points downwards, signifying a market decline. A white zigzag line also charts a downward trend. To the right, a red exclamation mark and a red dot serve as a warning or alert symbol. Line decrease illustrations 3D Rendered Stock Market Candlestick Chart with Falling Red Arrow and Exclamation Mark finance. A 3D rendered illustration of a stock market candlestick chart is shown against a light blue background. The chart displays a mix of red and green candlesticks, indicating price fluctuations. A prominent red arrow points downwards, signifying a market decline. A white zigzag line also charts a downward trend. To the right, a red exclamation mark and a red dot serve as a warning or alert symbol
Free with trial This graphic illustration depicts a stark representation of declining business performance. It features a bar chart with three colorful bars (yellow, orange, green) suggesting varying data points, overlaid with three distinct lines in yellow, blue, and orange, all sharply descending downwards. A prominent red arrow points downwards, emphasizing the negative trend. A small yellow plus sign is also visible, potentially signifying a point of reference or a contrasting element. The clean white background isolates the graphical elements, making them ideal for conveying concepts of loss, recession, or negative growth. Line decrease illustrations Declining Business Graph with Downward Arrows. This graphic illustration depicts a stark representation of declining business performance. It features a bar chart with three colorful bars (yellow, orange, green) suggesting varying data points, overlaid with three distinct lines in yellow, blue, and orange, all sharply descending downwards. A prominent red arrow points downwards, emphasizing the negative trend. A small yellow plus sign is also visible, potentially signifying a point of reference or a contrasting element. The clean white background isolates the graphical elements, making them ideal for conveying concepts of loss, recession, or negative growth.
Free with trial A close-up shot of a smartphone displaying a stock market chart, showing fluctuating prices. The dark theme enhances the visual impact of the pink graph line, generated by AI for a modern and sleek aesthetic. This image is perfect for illustrating financial technology, mobile trading, and investmen. Line decrease illustrations Mobile Stock Market Chart. A close-up shot of a smartphone displaying a stock market chart, showing fluctuating prices. The dark theme enhances the visual impact of the pink graph line, generated by AI for a modern and sleek aesthetic. This image is perfect for illustrating financial technology, mobile trading, and investmen
Free with trial Orange Fruit with Minus Sign: Round Vector Icon, Cute, Pop Art, Minimalist. Line decrease vectors Orange Fruit with Minus Sign: Round Vector Icon, Cute, Pop Art, Minimalist
Free with trial Reduce icon set symbol of arrow down concept of reducing lowering green circle and outline style vector. Line decrease vectors Reduce icon set symbol of arrow down concept of reducing lowering green circle and outline style
Free with trial Two thick black hand-drawn zigzag arrows with sharp arrowheads pointing in opposite directions are isolated on a solid white background. Line decrease vectors Hand-drawn pair of black zigzag arrows pointing opposite directions on a clean white background illustration. Two thick black hand-drawn zigzag arrows with sharp arrowheads pointing in opposite directions are isolated on a solid white background
Free with trial A bar graph showing a downward trend with a red arrow indicating a decline. Line decrease illustrations Decreasing bar graph with downward arrow isolated on white background. A bar graph showing a downward trend with a red arrow indicating a decline
Free with trial Several dark, pointed arrow shapes are patterned diagonally across a light background. The arrows point downwards, suggesting a trend or direction. Line decrease illustrations Downward Trend Shown With Repeating Arrow Shapes on a Plain Background. Several dark, pointed arrow shapes are patterned diagonally across a light background. The arrows point downwards, suggesting a trend or direction.
Free with trial Speaker Reduce Volume Icon Radio Media Control Minus Sound Level Adjustment Adjust Music Loudness Button Black Graphic Line Outline Shape Sign Symbol. Line decrease vectors Speaker Reduce Volume Icon Radio Media Control Minus Sound Level Adjustment Adjust Music Loudness Button Black
Free with trial A close-up view of black financial and business chart icons arranged in a grid on a light background. Line decrease illustrations Close-up of financial and business chart icons on a grid finance charts. A close-up view of black financial and business chart icons arranged in a grid on a light background
Free with trial Gear with Arrow Pointing Down Symbolizing Settings and Reduction Processes. Line decrease vectors Gear with Arrow Pointing Down Symbolizing Settings and Reduction Processes
Free with trial Negative sign set. Minus symbol circle. Vector button icons. Remove element marks. Interface navigation label sets. EPS 10. Line decrease vectors Negative sign set. Minus symbol circle. Vector button icons. Remove element marks. Interface navigation label sets.
Free with trial Battery status set. Power level icon. Energy progress Vector. Outline charge symbol. Manual vector only. No autotrace used. EPS 10. Line decrease vectors Battery status set. Power level icon. Energy progress Vector. Outline charge symbol. Manual vector only. No autotrace used
Free with trial Arrow Up Down Icon North South Upward Downward Pointer Scale Rise Fall Elevator Sign Symbol Growth Scroll Gesture Position Navigation Location Sign. Line decrease vectors Arrow Up Down Icon North South Upward Downward Pointer Scale Rise Fall Elevator Sign Symbol Growth Scroll Gesture
Free with trial Downward arrow, swirling line with blue concentric circles, and percentage symbol suggest falling rates. Ideal for finance, economy, interest, discount, marketing statistics cost management. Flat. Line decrease vectors Declining Percentage Rate Represented by Downward Arrow and Percentage Symbol. Downward arrow, swirling line with blue concentric circles, and percentage symbol suggest falling rates. Ideal for finance, economy, interest, discount, marketing statistics cost management. Flat
Free with trial Illustration of a business activities. Line decrease vectors Illustration of a business activities
Free with trial Illustration of a business activities. Line decrease vectors Illustration of a business activities
Free with trial Illustration of a business activities. Line decrease vectors Illustration of a business activities
Free with trial Illustration of a business activities. Line decrease vectors Illustration of a business activities
Free with trial Illustration of a business activities. Line decrease vectors Illustration of a business activities
Free with trial Illustration of a business activities. Line decrease vectors Illustration of a business activities
Free with trial Illustration of a business activities. Line decrease vectors Illustration of a business activities
Free with trial A downward trend is shown on a graph. The graph is black and white. Line decrease illustrations A downward trend is shown on a graph
Free with trial A vibrant and modern illustration of a bar graph, featuring four bars of varying heights and colors: blue, green, orange, and red. The bars are positioned on a gray horizontal line, creating a sense of data comparison and visual hierarchy. This image is ideal for representing data, statistics, business reports, financial analysis, or any concept requiring visual data representation. The clean design and bright colors make it suitable for presentations, websites, and marketing materials. Line decrease illustrations Colorful Bar Graph Illustration. A vibrant and modern illustration of a bar graph, featuring four bars of varying heights and colors: blue, green, orange, and red. The bars are positioned on a gray horizontal line, creating a sense of data comparison and visual hierarchy. This image is ideal for representing data, statistics, business reports, financial analysis, or any concept requiring visual data representation. The clean design and bright colors make it suitable for presentations, websites, and marketing materials.
Free with trial A bright arrow graphically descends across a starry sky, suggesting a decline or downturn in a visually striking way. Line decrease illustrations Downward Arrow in Starry Space. A bright arrow graphically descends across a starry sky, suggesting a decline or downturn in a visually striking way
Free with trial Geometric layout using the Fibonacci golden grid features a series of green rectangles arranged according to the Fibonacci sequence. This sequence is often linked to the golden ratio, harmonizing aesthetics in design. Each rectangle's size is proportional, creating a visually balanced pattern. The largest rectangle is on the left, while smaller rectangles and squares progressively decrease in size toward the right. The consistent use of green color enhances uniformity, emphasizing the mathematical precision of the layout. Line decrease illustrations Minimal geometric layout using Fibonacci golden grid. Geometric layout using the Fibonacci golden grid features a series of green rectangles arranged according to the Fibonacci sequence. This sequence is often linked to the golden ratio, harmonizing aesthetics in design. Each rectangle's size is proportional, creating a visually balanced pattern. The largest rectangle is on the left, while smaller rectangles and squares progressively decrease in size toward the right. The consistent use of green color enhances uniformity, emphasizing the mathematical precision of the layout.
Free with trial 3D model of tax percentage sign. Suitable for financial articles, accounting presentations, tax related blog posts or business websites. 3D Rendering. Line decrease illustrations 3D model of tax percentage sign.
Free with trial Math plus minus icons. Addition subtraction Vector. Calculation symbol set. Negative positive buttons. Control signs. EPS 10. Line decrease vectors Math plus minus icons. Addition subtraction Vector. Calculation symbol set. Negative positive buttons. Control signs.
Free with trial Set of six black business charts icons showing growth and decline trends with arrows and bars in vector style clear and simple design calm. Generative AI. Line decrease vectors Business growth and decline charts arrows statistics bar graph icons vector illustration. Set of six black business charts icons showing growth and decline trends with arrows and bars in vector style clear and simple design calm. Generative AI
Free with trial A visual representation of declining trends, depicted by a graph with red and blue lines moving downwards, symbolizing a negative trajectory or market shift. Line decrease illustrations Downward trending graph with word trends. A visual representation of declining trends, depicted by a graph with red and blue lines moving downwards, symbolizing a negative trajectory or market shift
Free with trial Minus Sign in Circle, Subtraction Symbol, Round Black Icon, Mathematics Operation. Line decrease vectors Minus Sign in Circle, Subtraction Symbol, Round Black Icon, Mathematics Operation
Free with trial Stack of gold coins are arranged against a backdrop of a red descending graph line, signifying financial loss, economic downturn, and market challenges. Image is generated using AI. Line decrease illustrations Stack Of Coins With Falling Graph. Stack of gold coins are arranged against a backdrop of a red descending graph line, signifying financial loss, economic downturn, and market challenges. Image is generated using AI
Free with trial Abstract 3D render of a financial growth chart. The image features a series of vertical bars, some in teal and others in orange, representing data points on a graph. The bars increase in height towards the right, suggesting positive growth or progress. The chart is set against a dark background with a subtle grid pattern and a reflective surface, adding depth and visual interest. Suitable for illustrating financial reports, market analysis, or business trends. Line decrease illustrations Abstract Financial Growth Chart. Abstract 3D render of a financial growth chart. The image features a series of vertical bars, some in teal and others in orange, representing data points on a graph. The bars increase in height towards the right, suggesting positive growth or progress. The chart is set against a dark background with a subtle grid pattern and a reflective surface, adding depth and visual interest. Suitable for illustrating financial reports, market analysis, or business trends.
Free with trial A silver laptop sits on a light brown wooden surface. Its screen displays a dark background with a grid pattern and a prominent red line graph sharply declining from left to right. The red line is brightly lit, creating a strong visual contrast against the dark background. The overall mood is one of concern or warning, suggesting a negative trend or decline. The image is clean and simple, focusing, generated by AI. Line decrease illustrations Laptop Screen Showing Red Downward Trend Graph computer. A silver laptop sits on a light brown wooden surface. Its screen displays a dark background with a grid pattern and a prominent red line graph sharply declining from left to right. The red line is brightly lit, creating a strong visual contrast against the dark background. The overall mood is one of concern or warning, suggesting a negative trend or decline. The image is clean and simple, focusing, generated by AI.
Free with trial Abstract blue up and down arrow icons illustration set minimalist molecular grid design isolated on white background for technology business growth data analysis and finance ui ux. Line decrease vectors Abstract blue up and down arrow icons illustration set minimalist molecular grid design isolated on white background for. Technology business growth data. Abstract blue up and down arrow icons illustration set minimalist molecular grid design isolated on white background for technology business growth data analysis and finance ui ux
Free with trial Stacks of gold coins rise incrementally, aligning with a candlestick chart. The chart shows alternating red and green candlesticks, increasing in height and following an upward trend. This visual represents financial growth and market analysis. Candlesticks typically illustrate market price movements in trading, where red indicates a decrease and green an increase in value. Line decrease vectors Candlestick Chart & Gold Coins: Rising Stock Market Growth. Stacks of gold coins rise incrementally, aligning with a candlestick chart. The chart shows alternating red and green candlesticks, increasing in height and following an upward trend. This visual represents financial growth and market analysis. Candlesticks typically illustrate market price movements in trading, where red indicates a decrease and green an increase in value.