Free with trial Growth vector icon. Graph or diagram with arrow going up and down. Vector illustration. Line decrease vectors Growth vector icon. Graph or diagram with arrow going up and down. Vector
Free with trial A comprehensive set of minimalist linear icons depicting financial analytics and business trends, featuring stacks of coins and both upward and downward trending bar charts. Line decrease vectors Linear Business and Financial Growth Icon Set for Analytics, Investment, and Economic Trend Visualization. A comprehensive set of minimalist linear icons depicting financial analytics and business trends, featuring stacks of coins and both upward and downward trending bar charts.
Free with trial Set of 16 black and white graph icons in a 4x4 grid. Each icon depicts variations of bar charts with upward and downward arrows, suggesting growth or decline. Some include additional elements like magnifying glasses, checkmarks, and data points connected by lines. Icons vary slightly in design, representing different data trends with simple, bold lines on a white background, ideal for business and statistical representation. Line decrease vectors Graph icon set. Increase and decrease graph icon. Growth icon. Graph chart icons. Icon set. 16 icons. Set of 16 black and white graph icons in a 4x4 grid. Each icon depicts variations of bar charts with upward and downward arrows, suggesting growth or decline. Some include additional elements like magnifying glasses, checkmarks, and data points connected by lines. Icons vary slightly in design, representing different data trends with simple, bold lines on a white background, ideal for business and statistical representation.
Free with trial Arrows percent icons with up and down signs and percentage symbols featuring arrow, icon, symbol with up and graphics elements for illustrations. Line decrease vectors Arrows percent icons with up and down signs and percentage symbols featuring arrow
Free with trial A burlap sack filled with coins next to stacks of coins with a downward trending red line, symbolizing financial decline or economic downturn. Line decrease illustrations Financial downturn concept. A burlap sack filled with coins next to stacks of coins with a downward trending red line, symbolizing financial decline or economic downturn
Free with trial Up and down graph icon on black circle. Outline bar chart with uptrend and downtrend arrow symbol vector. Line decrease vectors Up and down graph icon on black circle. Outline bar chart with uptrend and downtrend arrow symbol
Free with trial A simple and clean minimalist outline of a rectangular shape with two horizontal lines inside, representing the subtract or minus symbol. This icon is perfect for use in user interfaces, websites, and applications where a clear and concise symbol is needed to indicate subtraction or removal. Line decrease vectors Minimalist Outline Rectangular Subtract Symbol Inside Shape Sign Icon. A simple and clean minimalist outline of a rectangular shape with two horizontal lines inside, representing the subtract or minus symbol. This icon is perfect for use in user interfaces, websites, and applications where a clear and concise symbol is needed to indicate subtraction or removal.
Free with trial A blue block sign with the word 'LOW' is stacked above the letter 'L'. Line decrease illustrations Low Level Blue Letter L with. A blue block sign with the word 'LOW' is stacked above the letter 'L'.
Free with trial A bold red arrow curves downwards, indicating a negative trend or a directional choice. This simple yet impactful graphic is isolated for clarity. Line decrease illustrations Red arrow pointing down on. A bold red arrow curves downwards, indicating a negative trend or a directional choice. This simple yet impactful graphic is isolated for clarity
Free with trial Conceptual image depicting real estate market analysis. A magnifying glass focuses on a brightly lit house model, surrounded by other house models and a rising graph, all set on a reflective surface. The scene suggests research, investment, and growth in the housing market. Ideal for illustrating articles or presentations on real estate trends, property valuation, and housing market forecasts. Line decrease illustrations Real Estate Market Analysis
Free with trial A blue pencil with a gold ferrule lies on a black surface next to a white arrow drawn with white chalk or pastel. Line decrease illustrations Blue Pencil and White Arrow. A blue pencil with a gold ferrule lies on a black surface next to a white arrow drawn with white chalk or pastel.
Free with trial An upward trending bar graph displayed on a laptop screen, illuminated against a backdrop of blurred city lights at night. Shows financial success and progress. Line decrease illustrations Financial Growth Chart on Laptop Screen at Night. An upward trending bar graph displayed on a laptop screen, illuminated against a backdrop of blurred city lights at night. Shows financial success and progress.
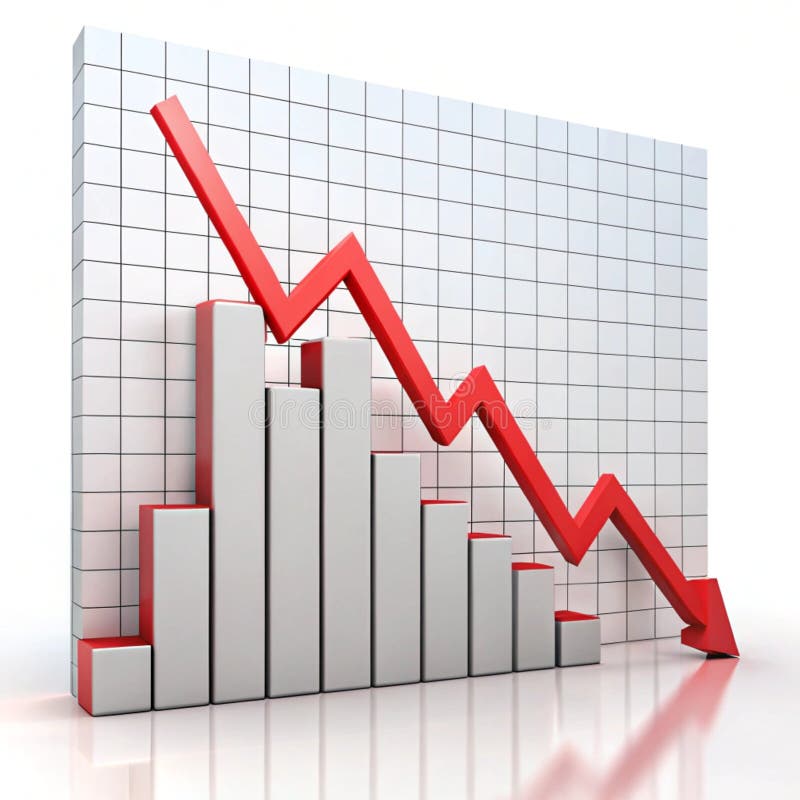
Free with trial A graph showing a downward trend on a grid background. 3D Rendering. Line decrease illustrations Declining stock market trend illustration. 3D Rendering. A graph showing a downward trend on a grid background. 3D Rendering
Free with trial Stylized illustration depicts a black, downward-trending arrow within a graph framework, set against a solid pastel yellow background. The image is suitable for conveying concepts related to market decline, financial downturns, or negative trends in various business or editorial contexts, lending itself well to presentations or reports. Line decrease illustrations Downward trend arrow graph illustrates market decline and business loss. Stylized illustration depicts a black, downward-trending arrow within a graph framework, set against a solid pastel yellow background. The image is suitable for conveying concepts related to market decline, financial downturns, or negative trends in various business or editorial contexts, lending itself well to presentations or reports
Free with trial A blue pencil with a gold ferrule and eraser lies on a black surface, next to a white arrow drawn with white chalk or pa. Line decrease illustrations Blue Pencil with White Arrow. A blue pencil with a gold ferrule and eraser lies on a black surface, next to a white arrow drawn with white chalk or pa.
Free with trial A series of four green geometric shapes are arranged pointing right on a white background. The shapes decrease in size from left to right, starting with a large, skewed square, followed by a smaller pentagon, a narrower pentagon, and ending with a small triangle. The arrangement creates a visual effect resembling an arrow or kite, suggesting directional movement. Line decrease illustrations Kite arrow. A series of four green geometric shapes are arranged pointing right on a white background. The shapes decrease in size from left to right, starting with a large, skewed square, followed by a smaller pentagon, a narrower pentagon, and ending with a small triangle. The arrangement creates a visual effect resembling an arrow or kite, suggesting directional movement.
Free with trial Abstract design featuring a detailed, layered flower pattern in shades of blue. The image conveys depth through the concentric arrangement of petal-like shapes that decrease in size towards the center, creating a spiraling, infinite effect. The smooth gradient transitions between lighter and darker blue tones enhance the visual appeal, reminiscent of a stylized sky or ocean scene. The overall composition is symmetrical, focusing attention on the central point and evoking a sense of harmony and balance. Line decrease vectors Luxury abstract blue sky color flower background design. Abstract design featuring a detailed, layered flower pattern in shades of blue. The image conveys depth through the concentric arrangement of petal-like shapes that decrease in size towards the center, creating a spiraling, infinite effect. The smooth gradient transitions between lighter and darker blue tones enhance the visual appeal, reminiscent of a stylized sky or ocean scene. The overall composition is symmetrical, focusing attention on the central point and evoking a sense of harmony and balance.
Free with trial The image shows a bar graph placed on top of an open financial report book. The bar graph displays data with blue bars of varying heights, and two lines are plotted across the bars, one red and one blue. The graph appears to be indicating trends or comparisons over time. The financial report book underneath has detailed tables and charts, suggesting a thorough analysis of financial data. Line decrease illustrations Bar graph on financial report. The image shows a bar graph placed on top of an open financial report book. The bar graph displays data with blue bars of varying heights, and two lines are plotted across the bars, one red and one blue. The graph appears to be indicating trends or comparisons over time. The financial report book underneath has detailed tables and charts, suggesting a thorough analysis of financial data
Free with trial Power consumption reduction icon, linear design, eps 10 file, easy to edit. Line decrease vectors Power consumption reduction icon, linear design
Free with trial Graph with a green arrow pointing upwards. The graph is labeled with numbers and the numbers are increasing. Line decrease illustrations Graph with a green arrow pointing upwards
Free with trial A sharp red arrow with a jagged line points downwards, indicating a decline or loss, isolated on a white background. Line decrease illustrations Red downward trend arrow isolated on white background. A sharp red arrow with a jagged line points downwards, indicating a decline or loss, isolated on a white background
Free with trial Bold red zigzag arrow pointing downward with sharp angles. Line decrease illustrations Red downward zigzag arrow icon. Bold red zigzag arrow pointing downward with sharp angles
Free with trial This graphic illustration depicts the concepts of stress, calmness, energy level, and mental load. The image features four distinct sections, each representing one of these aspects. The stress section is represented by a gauge with a needle pointing to a high level, indicating a sense of anxiety or overwhelm. The calmness section features a wavy line, symbolizing a peaceful and serene state. The energy level section is illustrated with a bar graph, showing a decrease in energy. The mental load section is represented by a gauge with a needle pointing to a high level, indicating a heavy mental burden. This illustration can be used to represent the importance of maintaining a balance between stress and calmness, and the impact it has on our mental health and well-being. Line decrease vectors Mental health A graphic illustration of stress, calmness, energy level, and mental load. This graphic illustration depicts the concepts of stress, calmness, energy level, and mental load. The image features four distinct sections, each representing one of these aspects. The stress section is represented by a gauge with a needle pointing to a high level, indicating a sense of anxiety or overwhelm. The calmness section features a wavy line, symbolizing a peaceful and serene state. The energy level section is illustrated with a bar graph, showing a decrease in energy. The mental load section is represented by a gauge with a needle pointing to a high level, indicating a heavy mental burden. This illustration can be used to represent the importance of maintaining a balance between stress and calmness, and the impact it has on our mental health and well-being.
Free with trial A visual representation of declining house values, symbolized by a house icon with downward arrows and a dollar sign, indicating economic downturn and financial loss. Line decrease vectors Vector art of house with downward arrows and dollar sign. A visual representation of declining house values, symbolized by a house icon with downward arrows and a dollar sign, indicating economic downturn and financial loss
Free with trial Simple double arrow icon, pointing both up and down, representing movement or options. Perfect for website or app interface design. Line decrease vectors Double Arrow Icon: Up and Down Direction Symbol. Simple double arrow icon, pointing both up and down, representing movement or options. Perfect for website or app interface design.
Free with trial Bar chart icon with downward arrow showing declining business performance, financial loss, recession, negative trend, market crash analytics and falling sales report. Line decrease vectors Bar chart icon with downward arrow showing declining business performance, financial
Free with trial Black Wi-Fi symbol composed of four semicircular arcs and a pointed bottom segment, set against a pale pink background. The arcs decrease in size from top to bottom, forming a cohesive and symmetrical design. This icon typically represents wireless internet connectivity. Line decrease vectors Semicircular Wi-Fi symbol with pointed bottom on pale pink. Black Wi-Fi symbol composed of four semicircular arcs and a pointed bottom segment, set against a pale pink background. The arcs decrease in size from top to bottom, forming a cohesive and symmetrical design. This icon typically represents wireless internet connectivity.
Free with trial A 3D render of a vibrant red arrow pointing downwards, visually representing decline, loss, or a stock market crash. Line decrease illustrations Red Arrow Down Stock Market Crash. A 3D render of a vibrant red arrow pointing downwards, visually representing decline, loss, or a stock market crash.
Free with trial A black industrial pipeline is entwined with green vines, symbolizing nature reclaiming technology. In the background, solar panels and white wind turbines populate the green field under a bright sun, contrasting with the fossil fuel infrastructure. Leaves swirl through the air, reflecting movement toward renewable energy sources. The scene depicts the transition from traditional energy to sustainable alternatives, underlining the harmonious blend of technology and nature for a greener future. Line decrease illustrations From Fossil Fuels to a Greener Future. A black industrial pipeline is entwined with green vines, symbolizing nature reclaiming technology. In the background, solar panels and white wind turbines populate the green field under a bright sun, contrasting with the fossil fuel infrastructure. Leaves swirl through the air, reflecting movement toward renewable energy sources. The scene depicts the transition from traditional energy to sustainable alternatives, underlining the harmonious blend of technology and nature for a greener future.
Free with trial A black industrial pipeline is entwined with green vines, symbolizing nature reclaiming technology. In the background, solar panels and white wind turbines populate the green field under a bright sun, contrasting with the fossil fuel infrastructure. Leaves swirl through the air, reflecting movement toward renewable energy sources. The scene depicts the transition from traditional energy to sustainable alternatives, underlining the harmonious blend of technology and nature for a greener future. Line decrease illustrations From Fossil Fuels to a Greener Future. A black industrial pipeline is entwined with green vines, symbolizing nature reclaiming technology. In the background, solar panels and white wind turbines populate the green field under a bright sun, contrasting with the fossil fuel infrastructure. Leaves swirl through the air, reflecting movement toward renewable energy sources. The scene depicts the transition from traditional energy to sustainable alternatives, underlining the harmonious blend of technology and nature for a greener future.
Free with trial Graph going down and up sign with green and red arrows vector. Bar chart symbol icon with arrow moving down and sales bar chart with arrow moving up. Line decrease vectors Graph going down and up sign with green and red arrows vector. Bar chart symbol icon with arrow moving down and sales bar chart
Free with trial A detailed bear figurine stands on a wooden surface, symbolizing a bearish trend in the stock market. The trend graph in the background visually represents market movements and fluctuations. Line decrease illustrations Bear Figurine on Wooden Surface with Stock Market Trend Graph in Background. A detailed bear figurine stands on a wooden surface, symbolizing a bearish trend in the stock market. The trend graph in the background visually represents market movements and fluctuations
Free with trial World map with a prominent red downward trend line indicating a global recession or financial market crash. Red arrows pointing downwards are superimposed over different continents, emphasizing a global economic downturn. The map is illuminated in shades of blue and purple against a dark background, enhancing the visual impact of the red elements. The composition suggests widespread economic decline across various regions. Line decrease illustrations Global recession and financial market crash shown by a declining red graph and arrows over a world map. World map with a prominent red downward trend line indicating a global recession or financial market crash. Red arrows pointing downwards are superimposed over different continents, emphasizing a global economic downturn. The map is illuminated in shades of blue and purple against a dark background, enhancing the visual impact of the red elements. The composition suggests widespread economic decline across various regions.
Free with trial Dollar price up and down icon in trendy style. USD growth and decline sign symbol vector. Line decrease vectors Dollar price up and down icon in trendy style. USD growth and decline sign symbol
Free with trial A simple yet effective graphic representing a negative trend or declining business chart, perfect for illustrating downward data or economic downturn. Line decrease vectors Negative Trend Graph, Decreasing Business Chart, Downward Data Illustration. A simple yet effective graphic representing a negative trend or declining business chart, perfect for illustrating downward data or economic downturn.
Free with trial Conceptual 3D rendering of a loss arrow pointing downwards. Line decrease illustrations Loss Arrow Down Financial Loss Business. Conceptual 3D rendering of a loss arrow pointing downwards.
Free with trial 3D icon featuring a silver metallic effect in the shape of a negative trend graph. Bars in descending order from left to right are accompanied by a downward-pointing arrow. The icon is framed in a rounded square, all elements sharing a polished, reflective surface that suggests a modern and sleek design. Line decrease vectors Negative Trend Graph 3D icon with silver metallic effect. 3D icon featuring a silver metallic effect in the shape of a negative trend graph. Bars in descending order from left to right are accompanied by a downward-pointing arrow. The icon is framed in a rounded square, all elements sharing a polished, reflective surface that suggests a modern and sleek design.
Free with trial A creative business and marketing illustration perfect for branding, presentations, and digital projects. Available in AI, EPS, PNG, SVG, and Figma. Line decrease vectors A sketchy style illustration showing a market failure. A creative business and marketing illustration perfect for branding, presentations, and digital projects. Available in AI, EPS, PNG, SVG, and Figma.
Free with trial Solid and outline icon of volume down design. Line decrease vectors Solid and outline icon of volume down
Free with trial A simple flat icon vector illustration of two hands adjusting a simple chart with a downturn arrow, symbolizing risk mitigation in a business setting. The simple chart with a downturn arrow is orange with dark gray elements, indicating loss control. White background. Minimalist style with sharp edges and no shadows. Orange and Gray color palette. Vector graphics with rounded corners. High. Line decrease illustrations Business Downturn Graph Two Hands Hold Downward Trend Chart. A simple flat icon vector illustration of two hands adjusting a simple chart with a downturn arrow, symbolizing risk mitigation in a business setting. The simple chart with a downturn arrow is orange with dark gray elements, indicating loss control. White background. Minimalist style with sharp edges and no shadows. Orange and Gray color palette. Vector graphics with rounded corners. High
Free with trial A 3D rendered blue arrow forms a jagged downward line, representing a declining trend or graph. The arrow is positioned diagonally, pointing towards the bottom right corner of the frame. The image is set against a clean white background, emphasizing the sharp descent. Line decrease illustrations Blue downward trending arrow graph on white background chart. A 3D rendered blue arrow forms a jagged downward line, representing a declining trend or graph. The arrow is positioned diagonally, pointing towards the bottom right corner of the frame. The image is set against a clean white background, emphasizing the sharp descent
Free with trial A 3D line graph showing a downward trend with a red arrow pointing downwards, indicating a decline in data or financial performance. The graph is set against a grid background with a professional and ultra-detailed quality. Line decrease illustrations Downward Trend Graph with Red Arrow. A 3D line graph showing a downward trend with a red arrow pointing downwards, indicating a decline in data or financial performance. The graph is set against a grid background with a professional and ultra-detailed quality.
Free with trial Arrow down and up percent outline icon on black circle. Percentage downward and upward arrows sign symbol vector. Line decrease vectors Arrow down and up percent outline icon on black circle. Percentage downward and upward arrows sign symbol
Free with trial A grid of black and white icons depicting financial charts with rising and falling trends, magnifying glasses with download arrows, and dollar signs. Line decrease vectors Collection of black and white icons representing financial charts and data analysis graph bar chart. A grid of black and white icons depicting financial charts with rising and falling trends, magnifying glasses with download arrows, and dollar signs
Free with trial Hand-drawn illustration of a bar graph with bars and a prominent arrow showcasing a downward trend. Concepts of decline, loss, or negative growth in various business and educational settings. Line decrease vectors Hand-Drawn Decreasing Bar Graph Illustration. hand-drawn illustration of a bar graph with bars and a prominent arrow showcasing a downward trend. Concepts of decline, loss, or negative growth in various business and educational settings
Free with trial A clean, minimalist vector illustration of a bar chart featuring three distinct columns. The columns are colored in vibrant orange, teal, and yellow, representing different data points or categories. The chart is set against a white background with a dark blue axis line, making it ideal for presentations, reports, and infographics focused on data visualization, business growth, or financial analysis. Line decrease vectors Simple Bar Chart with Three Columns. A clean, minimalist vector illustration of a bar chart featuring three distinct columns. The columns are colored in vibrant orange, teal, and yellow, representing different data points or categories. The chart is set against a white background with a dark blue axis line, making it ideal for presentations, reports, and infographics focused on data visualization, business growth, or financial analysis.
Free with trial A vibrant neon red arrow points downwards, indicating a decline or negative trend. The glowing line of the arrow is sharply defined against a dark, moody background. A subtle reflection of the neon light is visible on the textured dark surface below, adding depth and drama to the image. Line decrease illustrations Neon Red Downward Trend Arrow With Reflection On Dark Surface. A vibrant neon red arrow points downwards, indicating a decline or negative trend. The glowing line of the arrow is sharply defined against a dark, moody background. A subtle reflection of the neon light is visible on the textured dark surface below, adding depth and drama to the image
Free with trial Three distinct arrows, rendered in a sketchy, hand-drawn style, are positioned horizontally across the frame, all pointing directly downwards. The arrows vary slightly in size, with the leftmost being the smallest and the rightmost being the largest. Each arrow features a thick, black outline and subtle hatching within the shaft to suggest depth and shading. The overall composition is simple and. Line decrease vectors Three hand-drawn arrows point downwards on a white background. Three distinct arrows, rendered in a sketchy, hand-drawn style, are positioned horizontally across. Three distinct arrows, rendered in a sketchy, hand-drawn style, are positioned horizontally across the frame, all pointing directly downwards. The arrows vary slightly in size, with the leftmost being the smallest and the rightmost being the largest. Each arrow features a thick, black outline and subtle hatching within the shaft to suggest depth and shading. The overall composition is simple and
Free with trial A vivid red zigzag arrow is prominently displayed against a plain white background, pointing downwards. Line decrease illustrations Red zigzag arrow pointing downwards. A vivid red zigzag arrow is prominently displayed against a plain white background, pointing downwards
Free with trial Downfall icon vector image. Suitable for mobile apps, web apps and print media. Line decrease vectors Downfall icon vector image.
Free with trial A black arrow composed of a series of diminishing circles curves downward, ending in a solid triangular arrowhead. The arrow creates a sweeping arc from left to right, enhancing the dynamic motion of the design. The circles decrease in size as they approach the arrowhead, suggesting movement or progression. This minimalist graphic is set against a plain white background, emphasizing the boldness and clarity of the shapes. Line decrease illustrations Arrow with ball. A black arrow composed of a series of diminishing circles curves downward, ending in a solid triangular arrowhead. The arrow creates a sweeping arc from left to right, enhancing the dynamic motion of the design. The circles decrease in size as they approach the arrowhead, suggesting movement or progression. This minimalist graphic is set against a plain white background, emphasizing the boldness and clarity of the shapes.
Free with trial A neon orange graph on a black background shows a sharp decline, symbolizing financial loss or a negative trend. Line decrease illustrations Neon orange downward trending graph with arrow indicating financial decline on a black background. A neon orange graph on a black background shows a sharp decline, symbolizing financial loss or a negative trend
Free with trial Three coin stacks with dollar signs, showing growth, and a downward arrow indicating potential decline. Line decrease vectors A line drawing depicting three stacks of coins with dollar signs on top, showing financial growth. three coin stacks with dollar signs, showing growth, and a downward arrow indicating potential decline
Free with trial A person's open palm supports a glowing neon graph illustrating the relationship between cost and quality with upward and downward arrows. Line decrease illustrations Hand holding glowing cost quality graph palm open. A person's open palm supports a glowing neon graph illustrating the relationship between cost and quality with upward and downward arrows
Free with trial A vibrant 3D bar chart, featuring glossy blue and orange rectangular segments, illustrates data progression or comparison. The varying bar heights convey growth or statistical analysis. This modern graphic is ideal for business, finance, and analytical concepts, presented cleanly isolated on a transparent background. Line decrease vectors Glossy 3D bar chart showing data growth and statistics with blue and orange segments, perfect for business and finance presentatio. A vibrant 3D bar chart, featuring glossy blue and orange rectangular segments, illustrates data progression or comparison. The varying bar heights convey growth or statistical analysis. This modern graphic is ideal for business, finance, and analytical concepts, presented cleanly isolated on a transparent background.
Free with trial Chat arrow down vector icon set. black and white colors. EPS10. Line decrease vectors Chat arrow down icon. Chat arrow down vector icon set. black and white colors. EPS10
Free with trial Downward graph chart isolated on transparent background. Line decrease illustrations Downward graph chart
Free with trial A graph showing global sales growth trends on a printed document with multiple colored lines. Line decrease illustrations Global Sales Growth Chart on Document. A graph showing global sales growth trends on a printed document with multiple colored lines
Free with trial Colorful Charts and Graphs Data Visualization Infographic. Line decrease illustrations Colorful Charts and Graphs Data Visualization Infographic
Free with trial An eye-catching 3D rendering illustrates a stone dollar sign partially engulfed by crumbling debris as a red downward trending line pierces through, symbolizing financial decline and market instability. This conceptually rich image is perfect for illustrating economic downturns, investment risks, and business challenges. Line decrease illustrations Dollar Sign Breaking Downward Trend. An eye-catching 3D rendering illustrates a stone dollar sign partially engulfed by crumbling debris as a red downward trending line pierces through, symbolizing financial decline and market instability. This conceptually rich image is perfect for illustrating economic downturns, investment risks, and business challenges
Free with trial Depicts a 3D rendered arrow pointing downwards, symbolizing economic decline, stock market crash, or a negative trend. Line decrease illustrations Downward Trend Arrow Stock Market Crash. Depicts a 3D rendered arrow pointing downwards, symbolizing economic decline, stock market crash, or a negative trend.
Free with trial A creative business and marketing illustration perfect for branding, presentations, and digital projects. Available in AI, EPS, PNG, SVG, and Figma. Line decrease vectors A sketchy style illustration showing a market failure. A creative business and marketing illustration perfect for branding, presentations, and digital projects. Available in AI, EPS, PNG, SVG, and Figma.
Free with trial A chart with a red arrow pointing downward, isolated on a white background, representing financial decline or a negative trend. Line decrease illustrations Decreasing chart with red arrow isolated on white background. A chart with a red arrow pointing downward, isolated on a white background, representing financial decline or a negative trend
Free with trial Process reduction icon vector sign illustration. Line decrease vectors Process reduction icon vector
Free with trial Black and white vector logo of a simple house outline with stylized upward arrow and a small dollar sign icon, simple design, on a solid background, simple shapes, flat illustration style, simple lines, no shadows or gradients, symmetrical composition, centered, no text, high contrast, no color, high resolution, very detailed, high definition --chaos 30 --ar 16:9 --v 7 Job ID: cfd6ce0d-9e1a-412b-. Line decrease illustrations Dollar Sign with Arrows Showing Income and Expenses Under a Roof. black and white vector logo of a simple house outline with stylized upward arrow and a small dollar sign icon, simple design, on a solid background, simple shapes, flat illustration style, simple lines, no shadows or gradients, symmetrical composition, centered, no text, high contrast, no color, high resolution, very detailed, high definition --chaos 30 --ar 16:9 --v 7 Job ID: cfd6ce0d-9e1a-412b-
Free with trial A bar chart shows a decline, coupled with a sad face, conveying negative trends in a flat design style. Line decrease vectors Declining bar chart with a sad face symbolizing loss, downturn, or negative trends. A bar chart shows a decline, coupled with a sad face, conveying negative trends in a flat design style.
Free with trial The image features a heart shape composed of multiple concentric heart outlines. The hearts progressively decrease in size, creating a sense of depth and infinity. The design is monochromatic, with alternating black and white lines, giving it a striking and elegant appearance. This image symbolizes eternal love, affection, and the infinite nature of emotions. Line decrease vectors Infinite heart symbolizing eternal love. The image features a heart shape composed of multiple concentric heart outlines. The hearts progressively decrease in size, creating a sense of depth and infinity. The design is monochromatic, with alternating black and white lines, giving it a striking and elegant appearance. This image symbolizes eternal love, affection, and the infinite nature of emotions
Free with trial A photorealistic 3D render depicts a smartphone displaying a stock market trading analysis app. The screen shows a prominent red downward trending line graph overlaid on blue bar graphs. Surrounding the phone are 3D rendered dollar signs and bills, suggesting a financial context. The overall color scheme is dark with vibrant accents of red and blue in the graphs. The style is clean and modern,. Line decrease illustrations 3 D Stock Trading Analysis App Smartphone Displaying Red Downward Trend Graph. A photorealistic 3D render depicts a smartphone displaying a stock market trading analysis app. The screen shows a prominent red downward trending line graph overlaid on blue bar graphs. Surrounding the phone are 3D rendered dollar signs and bills, suggesting a financial context. The overall color scheme is dark with vibrant accents of red and blue in the graphs. The style is clean and modern,
Free with trial A detailed black and white knitting chart illustrating a complex stitch pattern. The grid contains a variety of standard symbols and abbreviations, such as 'k2tog' and 'ssk', which guide the knitter row by row. This type of graphic diagram is essential for creating intricate designs like lace, shawls, and sweaters. It's a perfect visual for craft blogs, DIY tutorials, knitting magazines, pattern books, and articles about handmade textiles and needlework. Line decrease illustrations Lace Knitting Pattern Chart with Symbols. A detailed black and white knitting chart illustrating a complex stitch pattern. The grid contains a variety of standard symbols and abbreviations, such as 'k2tog' and 'ssk', which guide the knitter row by row. This type of graphic diagram is essential for creating intricate designs like lace, shawls, and sweaters. It's a perfect visual for craft blogs, DIY tutorials, knitting magazines, pattern books, and articles about handmade textiles and needlework.
Free with trial Decline red stock chart illustration ch bearish, selloff downturn, plummet loss decline red stock chart. Line decrease illustrations Decline red stock chart
Free with trial A downward trending graph chart isolated on a white background, perfect for financial analysis. Line decrease illustrations Downward graph chart. A downward trending graph chart isolated on a white background, perfect for financial analysis
Free with trial A modern, hand-drawn illustration symbolizing a bear market. This creative doodle features a stylized purple bear, the financial metaphor for a declining market, surrounded by downward arrows, volatile stock chart lines, and a warning sign. The abstract, pastel-colored design effectively visualizes concepts of economic downturn, recession, financial crisis, and investment risk. This vector graphic is perfect for articles, blogs, presentations, and infographics related to finance, trading, economics, and stock market analysis. Isolated on a white background for versatile use. Line decrease vectors Bear Market Financial Concept Illustration. A modern, hand-drawn illustration symbolizing a bear market. This creative doodle features a stylized purple bear, the financial metaphor for a declining market, surrounded by downward arrows, volatile stock chart lines, and a warning sign. The abstract, pastel-colored design effectively visualizes concepts of economic downturn, recession, financial crisis, and investment risk. This vector graphic is perfect for articles, blogs, presentations, and infographics related to finance, trading, economics, and stock market analysis. Isolated on a white background for versatile use.
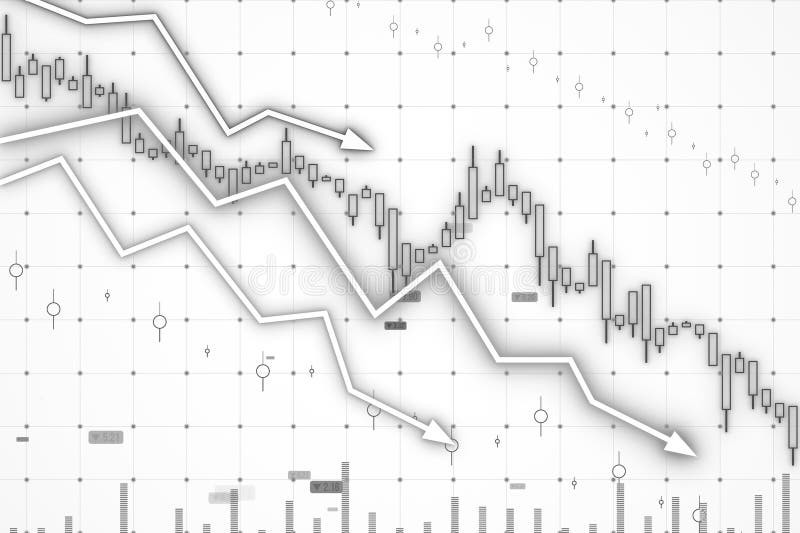
Free with trial Two different graphs with a downward trend. One is red and the other is white. Line decrease illustrations Two different graphs with a downward trend
Free with trial This illustration features a single, hand-drawn arrow pointing directly downwards. The arrow is rendered in a doodle or sketch style, characterized by its thick, uneven black lines and a slightly textured appearance. It conveys a sense of direction, emphasis, or movement towards a lower point. The simple black and white color scheme ensures versatility and a clean, minimalist aesthetic, making it. Line decrease vectors A hand-drawn doodle arrow points downwards on a clean white background. This illustration features a single, hand-drawn arrow pointing directly downwards. The arrow is rendered in a doodle or sketch style, characterized by its thick, uneven black lines and a slightly textured appearance. It conveys a sense of direction, emphasis, or movement towards a lower point. The simple black and white color scheme ensures versatility and a clean, minimalist aesthetic, making it