Free with trial Graph line icon. Column chart sign. Growth diagram symbol. Quality design element. Linear style graph chart icon. Editable stroke. Vector. Performance decrease vectors Graph line icon. Column chart sign. Vector. Graph line icon. Column chart sign. Growth diagram symbol. Quality design element. Linear style graph chart icon. Editable stroke. Vector
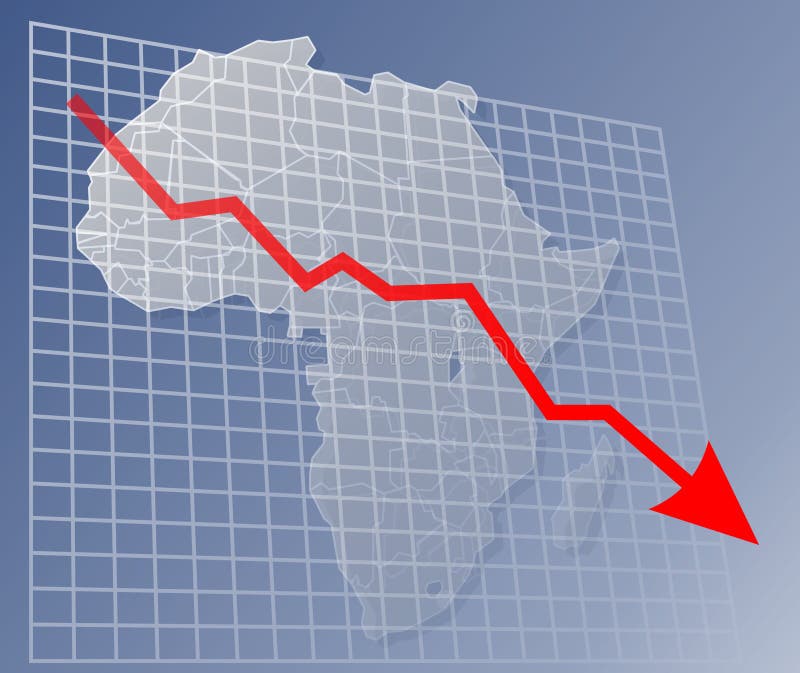
Free with trial Chart with downwards arrow over a map of Africa. Performance decrease illustrations Chart Africa down. Chart with downwards arrow over a map of Africa
Free with trial Concept profit red bar ladder blocks on spring spirals 3d. Performance decrease illustrations Concept profit red bar ladder blocks on spring spirals
Free with trial An image of a graphical pie chart, it could be useful for business concepts. Performance decrease illustrations Pie Chart 132. An image of a graphical pie chart, it could be useful for business concepts.
Free with trial Set chart graph icon positive, negative infographic, layered. Performance decrease vectors Set chart graph positive, negative infographic. Set chart graph icon positive, negative infographic, layered.
Free with trial An image of a glass graphical pie chart, it could be useful for business concepts. Performance decrease illustrations Glass Pie Chart 1. An image of a glass graphical pie chart, it could be useful for business concepts.
Free with trial Real estate falling chart with globe, 3d render, white background. Performance decrease illustrations Real estate falling chart with globe, 3d render
Free with trial Vector isometric illustration of a zero net energy building with the total amount of consumption energy used by the building is roughly equal to the amount of renewable energy created on the site. Performance decrease vectors Zero net energy building. Vector isometric illustration of a zero net energy building with the total amount of consumption energy used by the building is roughly equal to the amount of renewable energy created on the site.
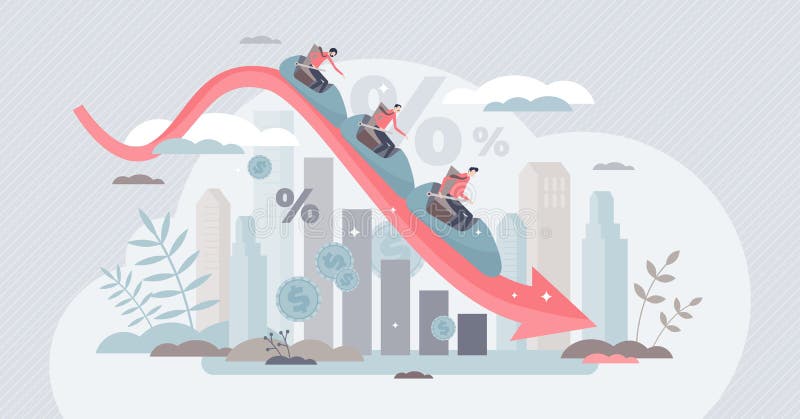
Free with trial Economic forecast with financial stock value prediction tiny person concept. Business analysis as falling roller coaster up and down vector illustration. Money crisis and global decrease recession. Performance decrease vectors Economic forecast with financial stock value prediction tiny person concept
Free with trial Problem and Solution red black word opposites. Performance decrease illustrations Problem and Solution Black Red Word Opposites. Problem and Solution red black word opposites
Free with trial An image of a graphical pie chart, it could be useful for business concepts. Performance decrease illustrations Pie Chart 122. An image of a graphical pie chart, it could be useful for business concepts.
Free with trial Business graph showing decreasing profit for dollar. Performance decrease illustrations Business graph
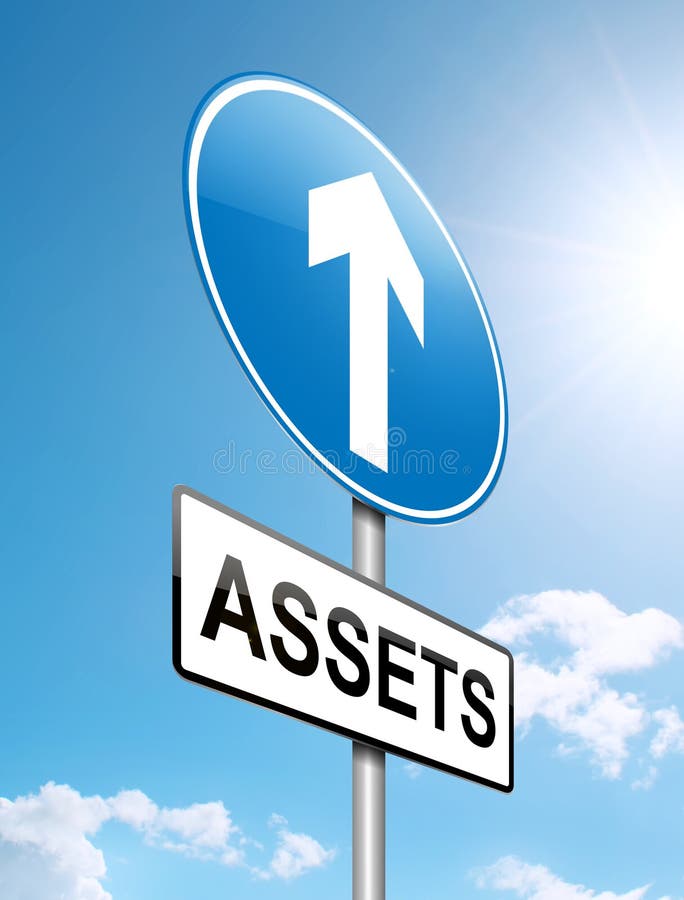
Free with trial Illustration depicting a roadsign with a falling assets concept. Sunlight and sky background. Performance decrease illustrations Assets concept.
Free with trial Business man confused stock market arrow. Sad businessman with graph indicating a regression. The concept of business failure, bankruptcy. Vector illustration. Performance decrease vectors Business man confused stock market arrow.Sad businessman
Free with trial Illustration of people avatar business plan concept. Performance decrease illustrations Illustration of people avatar business plan concept
Free with trial Business concept of financial blame and panic. Performance decrease illustrations Business Concept
Free with trial The graph shows the percent decrease. Performance decrease vectors Assembled diagram (down). The graph shows the percent decrease
Free with trial Real estate falling chart with globe, 3d render, white background. Performance decrease illustrations Real estate falling chart with globe, 3d render
Free with trial Stock market or crypto currency crash and going down, economic crisis or investing risk, volatility and fluctuation concept, businessman investor rodeo riding uncertainty decline red arrow graph. Performance decrease vectors Stock market or crypto currency crash and going down, economic crisis or investing risk, volatility and fluctuation concept
Free with trial Real estate falling chart, 3d render, white background. Performance decrease illustrations Real estate falling chart, 3d render
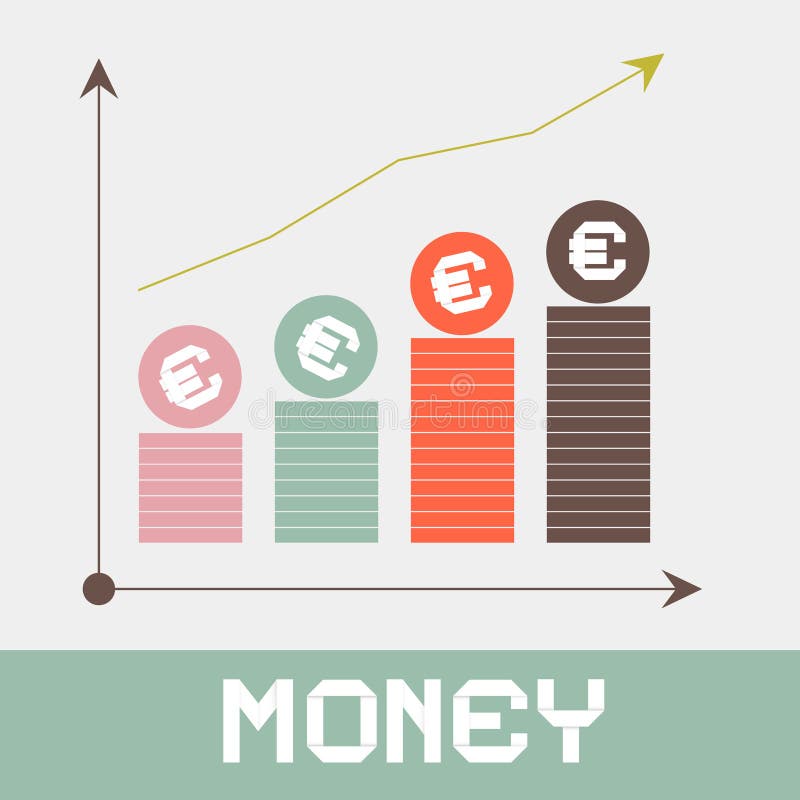
Free with trial Increase Money Graph Paper Retro Vector Illustration. Performance decrease vectors Increase Money Graph Paper
Free with trial Business concept vector illustration of businessman falling down on arrow graphic, business failure, crisis concept. Performance decrease vectors Businessman falling down from arrow graphic. Business concept vector illustration of businessman falling down on arrow graphic, business failure, crisis concept
Free with trial Modern non volatile autonomous house with a lawn and a swimming pool. Vector isometric illustration. Performance decrease vectors Modern non volatile autonomous house. Modern non volatile autonomous house with a lawn and a swimming pool. Vector isometric illustration.
Free with trial AI powered business optimization concept, Cost reduction and Quality control, Artificial Intelligence driven automation optimizes workflows, Improves quality, Reduces expenses in business operations. Performance decrease vectors AI powered business optimization concept
Free with trial A 3D red downward-trending arrow graph with the text "INTEREST RATES" above it, set against a textured beige background. Image. Performance decrease illustrations Interest Rates Downward Trend. A 3D red downward-trending arrow graph with the text "INTEREST RATES" above it, set against a textured beige background. Image
Free with trial Chart with donwards arrow over a map of Asia. Performance decrease illustrations Chart Asia down. Chart with donwards arrow over a map of Asia
Free with trial Businessman who used to have a lot of money. vector. Performance decrease vectors Businessman who used to have a lot of money
Free with trial Chart graph. Black Icon growth and downward with arrow isolated on background. Hologram positive, fall percentage. Design business concept direction growth, recession. Analysis. Vector illustration. Performance decrease vectors Chart graph. Black Icon growth and downward with arrow. Hologram positive, fall percentage. Design business. Vector illustration. Chart graph. Black Icon growth and downward with arrow isolated on background. Hologram positive, fall percentage. Design business concept direction growth, recession. Analysis. Vector illustration
Free with trial Energy icon set. It included electric, power, charge, ev, and more icons. Performance decrease vectors Energy icon set. It included electric, power, charge, and more icons.
Free with trial Assessment icons in line design. Assessment, data, analysis, compare, plan, analysis, testing, report, management isolated on white background vector Assessment editable stroke icons. Performance decrease vectors Assessment icons in line design. Assessment, data, analysis, compare, plan, analysis, testing, report, management
Free with trial Assessment icons in line design, blue. Assessment, data, analysis, compare, plan, analysis, testing, report, management isolated on white background vector Assessment editable stroke icons. Performance decrease vectors Assessment icons in line design, blue. Assessment, data, analysis, compare, plan, analysis, testing, report, management
Free with trial Concept of the effective cost management. Performance decrease illustrations Concept of effective cost management
Free with trial Businessman character design. Businessman fight with economy and financial crisis. Performance decrease vectors Businessman character design. Businessman with economy and finance. (Set of business people about economy and finance). Businessman character design. Businessman fight with economy and financial crisis.
Free with trial Data analytics ascending icon from user interface outline collection. Thin line data analytics ascending icon isolated on white background. Performance decrease vectors Data analytics ascending icon from user interface outline collection. Thin line data analytics ascending icon isolated on white
Free with trial Business positive arrow vector graph, set colorful. Performance decrease vectors Business positive arrow vector graph
Free with trial Statistics down icon isolated on elegant blue round button illustration. Performance decrease vectors Statistics down icon elegant blue round button illustration. Statistics down icon isolated on elegant blue round button illustration
Free with trial Graph line icons. Set of Chart presentation, Report, Increase growth graph icons. Analytics testing, Falling demand, Pie chart report. Calendar statistics, Stats. Ab testing, Increase sales. Vector. Performance decrease vectors Graph line icons. Set of Chart presentation, Report and Increase growth graph icons. Vector. Graph line icons. Set of Chart presentation, Report, Increase growth graph icons. Analytics testing, Falling demand, Pie chart report. Calendar statistics, Stats. Ab testing, Increase sales. Vector
Free with trial Graph line icon. Column chart sign. Growth diagram symbol. Quality design flat app element. Editable stroke Graph chart icon. Vector. Performance decrease vectors Graph line icon. Column chart sign. Vector. Graph line icon. Column chart sign. Growth diagram symbol. Quality design flat app element. Editable stroke Graph chart icon. Vector
Free with trial Checklist line icon. Graph chart sign. Growth diagram symbol. Colorful outline concept. Blue and orange thin line color Checklist icon. Vector. Performance decrease vectors Checklist line icon. Graph chart sign. Vector. Checklist line icon. Graph chart sign. Growth diagram symbol. Colorful outline concept. Blue and orange thin line color Checklist icon. Vector
Free with trial Analytics graph icon. Column chart sign. Growth diagram symbol. Dynamic shapes. Gradient design analytics graph icon. Classic style. Vector. Performance decrease vectors Analytics graph icon. Column chart sign. Vector. Analytics graph icon. Column chart sign. Growth diagram symbol. Dynamic shapes. Gradient design analytics graph icon. Classic style. Vector
Free with trial Column chart sign. Versus concept. Graph phone line icon. Growth diagram symbol. Line vs classic graph phone icon. Vector. Performance decrease vectors Graph phone line icon. Column chart sign. Vector. Column chart sign. Versus concept. Graph phone line icon. Growth diagram symbol. Line vs classic graph phone icon. Vector
Free with trial Statistics down icon isolated on shiny round buttons set illustration. Performance decrease vectors Statistics down icon shiny round buttons set illustration. Statistics down icon isolated on shiny round buttons set illustration
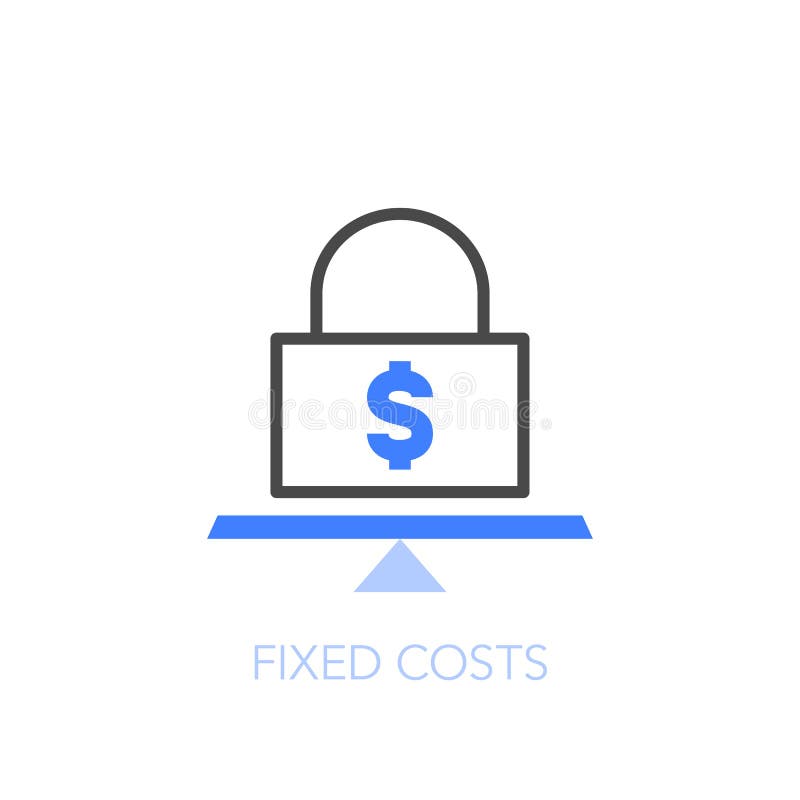
Free with trial Fixed costs symbol with a dollar symbol in a padlock on a balance scale. Easy to use for your website or presentation. Performance decrease vectors Fixed costs symbol with a dollar symbol in a padlock on a balance scale
Free with trial Graph line icon. Column chart sign. Growth diagram symbol. Quality design flat app element. Editable stroke Graph chart icon. Vector. Performance decrease vectors Graph line icon. Column chart sign. Vector. Graph line icon. Column chart sign. Growth diagram symbol. Quality design flat app element. Editable stroke Graph chart icon. Vector
Free with trial Checklist line icon. Graph chart sign. Growth diagram symbol. Quality design flat app element. Editable stroke Checklist icon. Vector. Performance decrease vectors Checklist line icon. Graph chart sign. Vector. Checklist line icon. Graph chart sign. Growth diagram symbol. Quality design flat app element. Editable stroke Checklist icon. Vector
Free with trial Businessman trying to push cost to minimum position illustration. Cost reduction strategy concept, eps10. Performance decrease vectors Businessman trying to push cost to minimum position illustration. Cost reduction strategy concept
Free with trial Bars descending graph vector line icon, sign, illustration on white background, editable strokes. Performance decrease vectors Bars descending graph vector line icon, sign, illustration on background, editable strokes
Free with trial Blocks growing bar diagram on white wall 3d. Performance decrease illustrations Blocks growing bar diagram on white wall
Free with trial Statistics down icon isolated on abstract halftone round button set. Performance decrease vectors Statistics down icon abstract halftone round button set. Statistics down icon isolated on abstract halftone round button set
Free with trial Graph laptop line icon. Gradient blur button with glassmorphism. Column chart sign. Growth diagram symbol. Transparent glass design. Vector. Performance decrease vectors Graph laptop line icon. Column chart sign. Gradient blur button. Vector. Graph laptop line icon. Gradient blur button with glassmorphism. Column chart sign. Growth diagram symbol. Transparent glass design. Graph laptop line icon. Vector
Free with trial Businessman holding magnifier glass with quality increasing graph and cost decreasing chart for business management focus and balance between cost and quality of product to get high profit and benefit. Performance decrease illustrations Businessman holding magnifier glass with quality increasing graph and cost decreasing chart for business management focus and
Free with trial Analytics graph line icon. Column chart sign. Growth diagram symbol. Quality design flat app element. Editable stroke Analytics graph icon. Vector. Performance decrease vectors Analytics graph line icon. Column chart sign. Vector. Analytics graph line icon. Column chart sign. Growth diagram symbol. Quality design flat app element. Editable stroke Analytics graph icon. Vector
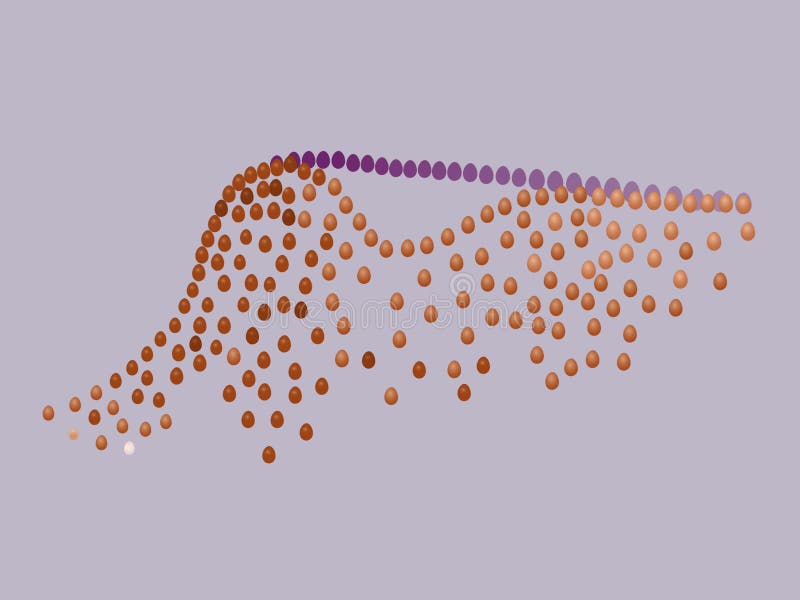
Free with trial CONCEPTUAL IMAGE. Egg Drop Production Curve Model. Performance decrease illustrations Illustration Model of Egg Drop Production in Laying Hens. CONCEPTUAL IMAGE. Egg Drop Production Curve Model
Free with trial Statistics, Trash bin and Targeting line icons set. Chat bubbles with quotes. Alarm clock, Computer keyboard and Report document signs. Organic product, Diagram graph symbols. Vector. Performance decrease vectors Statistics, Trash bin and Targeting icons set. Alarm clock, Computer keyboard and Report document signs. Vector. Statistics, Trash bin and Targeting line icons set. Chat bubbles with quotes. Alarm clock, Computer keyboard and Report document signs. Organic product, Diagram graph symbols. Vector
Free with trial Cost reduction or efficiency design concept. Businessman character punch hardly the punching bag with word `cost` on it. Metaphor vector illustration, Business template. Performance decrease vectors Cost reduction or efficiency design concept. Businessman character punch hardly the punching bag with word
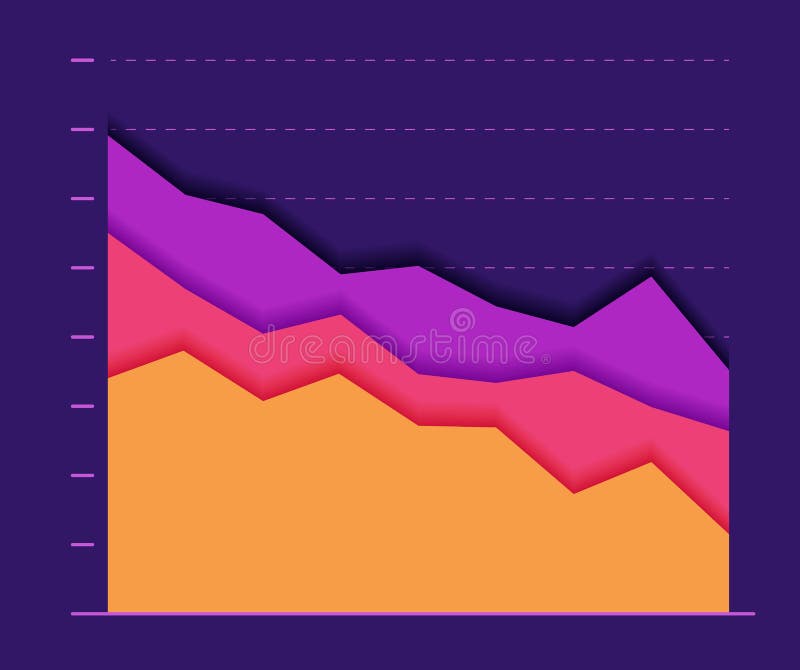
Free with trial Creative vector illustration of revenue, profit, expenses diagram showing infographic isolated on transparent background. Art design business planning template. Abstract concept graphic element. Performance decrease vectors Creative vector illustration of revenue, profit, expenses diagram showing infographic isolated on transparent background
Free with trial Creative vector illustration of revenue, profit, expenses diagram showing infographic isolated on transparent background. Art design business planning template. Abstract concept graphic element. Performance decrease vectors Creative vector illustration of revenue, profit, expenses diagram showing infographic isolated on transparent background
Free with trial Seo analytics, Diagram graph and Chemical formula signs. Chat bubbles. Flash memory, 24h service and Text message line icons set. Recovery usb, Call support, Chat bubble. Statistics. Vector. Performance decrease vectors Flash memory, 24h service and Text message icons set. Seo analytics, Diagram graph and Chemical formula signs. Vector. Seo analytics, Diagram graph and Chemical formula signs. Chat bubbles. Flash memory, 24h service and Text message line icons set. Recovery usb, Call support, Chat bubble. Statistics. Vector
Free with trial Statistics down icon isolated on flat exclusive button set. Performance decrease vectors Statistics down icon flat exclusive button set. Statistics down icon isolated on flat exclusive button set
Free with trial Statistics down icon isolated on eyeball blue round button. Performance decrease illustrations Statistics down icon eyeball blue round button. Statistics down icon isolated on eyeball blue round button
Free with trial Abstract Paper graph color line moving down. concept of collapse and fall. Modern design graphics on dark background. Vector illustration. Performance decrease vectors Abstract Paper graph color line moving down. concept of collapse and fall.
Free with trial Calendar graph line icon. Column chart sign. Growth diagram symbol. Quality design flat app element. Editable stroke Calendar graph icon. Vector. Performance decrease vectors Calendar graph line icon. Column chart sign. Vector. Calendar graph line icon. Column chart sign. Growth diagram symbol. Quality design flat app element. Editable stroke Calendar graph icon. Vector
Free with trial Creative vector illustration of revenue, profit, expenses diagram showing infographic isolated on transparent background. Art design business planning template. Abstract concept graphic element. Performance decrease vectors Creative vector illustration of revenue, profit, expenses diagram showing infographic isolated on transparent background
Free with trial A minimal style of a red down chart of the financial crisis, economic downturn, inflation, recession, bankruptcy concept. A business team with a leader pulling a tug of war to change graph direction. Performance decrease vectors Business team with a leader pulling a tug of war to change graph direction
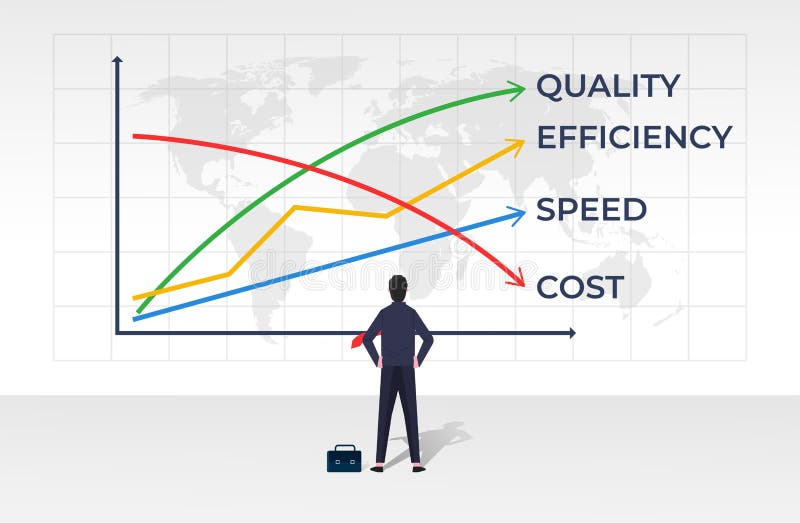
Free with trial Business concept design. Increased quality, efficiency and speed graph vector illustration, eps10. Performance decrease vectors Business concept design. Increased quality, efficiency and speed graph vector illustration
Free with trial Infographic diagram declining trend bar chart,illustration can be used as template in presentation,web banner design,business, economy,statistic flyer and slide. Performance decrease illustrations Infographic diagram declining trend bar chart,illustration can be used as template in presentation,web banner design,business
Free with trial Seo laptop, Documentation and Bitcoin chart icons simple set. Comparison table. Graph chart sign. Search engine, Project, Cryptocurrency statistics. Get report. Technology set. Pricing plan. Vector. Performance decrease vectors Seo laptop, Documentation and Bitcoin chart icons set. Graph chart sign. Vector. Seo laptop, Documentation and Bitcoin chart icons simple set. Comparison table. Graph chart sign. Search engine, Project, Cryptocurrency statistics. Get report. Technology set. Pricing plan. Vector
Free with trial Set of Recycling, Chemistry dna and Vip access line icons. Include Online question, Idea lamp, Energy drops icons. Seo statistics, Swipe up, Credit card web elements. Interview. Vector. Performance decrease vectors Set of Recycling, Chemistry dna and Vip access line icons. For design. Vector. Set of Recycling, Chemistry dna and Vip access line icons. Include Online question, Idea lamp, Energy drops icons. Seo statistics, Swipe up, Credit card web elements. Interview. Vector
Free with trial Percent percentage sign percentile symbol interest rate sale finance discount icon black red gold yellow green blue 3d rendering. Performance decrease illustrations Percent percentage sign percentile symbol interest rate sale finance discount icon black red gold yellow green blue 3d rendering
Free with trial Productivity loss icon. Performance decrease Vector. Failure process symbol. Professional system error graphic. EPS 10. Performance decrease vectors Productivity loss icon. Performance decrease Vector. Failure process symbol. Professional system error graphic.
Free with trial Negative Trend Line Icon, Outline Symbol for Market Loss, Financial Decrease, Warning Indicator, Performance Decline, and Risk. Assessment. Vector Sign Icon. Performance decrease vectors Negative Trend Line Icon, Outline Symbol for Market Loss, Financial Decrease, Warning Indicator, Performance Decline, and Risk. Assessment. Vector Sign Icon
Free with trial Twenty-five colorful icons depict various financial and business concepts related to growth and decline. Each icon combines elements like arrows, charts, coins, and gears in vibrant red, yellow, and blue colors. Labels such as "Chart Focus," "Growth Arrow," "Money Stock," "Market Decline," and "Data Analytics" accompany each icon, suggesting themes of financial analysis and performance metrics. Set against a white background with a maroon accent on the left that reads "Increase Decrease Icons," these symbols visually represent economic trends and business strategies. Performance decrease vectors Increase Decrease Icon Set - Business Growth Analytics, Up Down Arrows, Charts and Performance Statistics Vector Icons Collection. Twenty-five colorful icons depict various financial and business concepts related to growth and decline. Each icon combines elements like arrows, charts, coins, and gears in vibrant red, yellow, and blue colors. Labels such as "Chart Focus," "Growth Arrow," "Money Stock," "Market Decline," and "Data Analytics" accompany each icon, suggesting themes of financial analysis and performance metrics. Set against a white background with a maroon accent on the left that reads "Increase Decrease Icons," these symbols visually represent economic trends and business strategies.
Free with trial A red graph with arrows illustrating decrease and increase, representing data analysis and performance evaluation in business. Suitable for reports and presentations. Performance decrease vectors Vector art of red graph with arrow, illustrating decrease and increase, representing data analysis and performance evaluation in. A red graph with arrows illustrating decrease and increase, representing data analysis and performance evaluation in business. Suitable for reports and presentations
Free with trial A striking red downward arrow symbolizing decline and decrease in performance or value, perfect for finance, marketing, and business-related projects. Performance decrease illustrations Red Downward Arrow Symbol Representing Decrease in Performance or Value. A striking red downward arrow symbolizing decline and decrease in performance or value, perfect for finance, marketing, and business-related projects
Free with trial The image shows a red zigzag arrow pointing downward, which is commonly used to represent a decline, drop, or decrease in metrics such as stock prices, performance, or any downward trend. The sharp, jagged lines emphasize a rapid or significant descent. Performance decrease illustrations A bold downward zigzag arrow symbolizing decline or decrease in value or performance. The image shows a red zigzag arrow pointing downward, which is commonly used to represent a decline, drop, or decrease in metrics such as stock prices, performance, or any downward trend. The sharp, jagged lines emphasize a rapid or significant descent
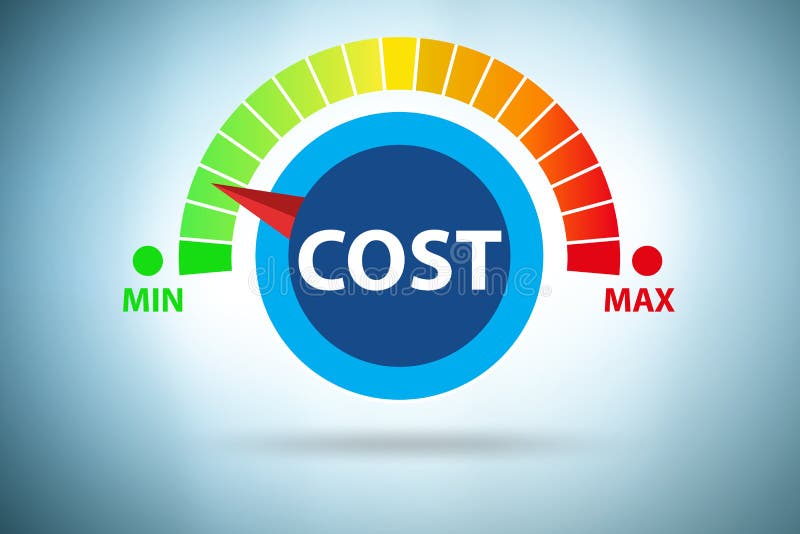
Free with trial Gauge with downward arrow indicates low performance or decrease in speed, economy, or quality. Performance decrease vectors Gauge with downward arrow indicates low performance or decrease in speed, economy, or quality
Free with trial This image shows a thick red zigzag arrow pointing downward, symbolizing a decline, drop, or reduction in trends such as stock prices, performance metrics, or other quantitative measures. The sharp angles and vibrant red color emphasize a significant decrease. Performance decrease illustrations A bold red downward zigzag arrow indicating a decline or decrease in values or performance. This image shows a thick red zigzag arrow pointing downward, symbolizing a decline, drop, or reduction in trends such as stock prices, performance metrics, or other quantitative measures. The sharp angles and vibrant red color emphasize a significant decrease
Free with trial Performance gauge dropping with an arrow indicating a decrease, reduction, or decline. Meter going down showing change or fluctuation. Performance decrease vectors Performance gauge dropping with an arrow indicating a decrease, reduction, or decline. Meter going down showing change or