Free with trial Loan Related and Investment Line Vector Icon. Investment, Percentage, Interest Rate. Low total cost icon vector image. Thin Outline Vector illustration isolated on background. Time decrease vectors Loan Related and Investment Line Vector Icon. Investment, Percentage, Interest Rate. Low total cost icon vector image.
Free with trial Loan interest rate doodle icon set. Hand drawn sketch doodle line style bank money loan interest rate icon for house, car discount percentage concept. Trendy cute element. Vector illustration. Time decrease vectors Loan interest rate doodle icon set. Hand drawn sketch doodle line style bank money loan interest rate icon for house
Free with trial The global energy market is a dynamic and complex system, heavily influenced by factors ranging from geopolitical events to technological advancements. This compelling visualization showcases the fluctuating price of a barrel of crude oil over time, revealing the dramatic boom and bust cycles characteristic of the industry. Observe the peaks and valleys, the periods of sustained growth, and the. Time decrease illustrations Visualizing Crude Oil Price Volatility A Deep Dive into the Boom and Bust Cycles of the Global Energy. The global energy market is a dynamic and complex system, heavily influenced by factors ranging from geopolitical events to technological advancements. This compelling visualization showcases the fluctuating price of a barrel of crude oil over time, revealing the dramatic boom and bust cycles characteristic of the industry. Observe the peaks and valleys, the periods of sustained growth, and the
Free with trial Loan Related and Investment Line Vector Icon. Investment, Percentage, Interest Rate. Low total cost icon vector image. Thin Outline Vector illustration isolated on background. Time decrease vectors Loan Related and Investment Line Vector Icon. Investment, Percentage, Interest Rate. Low total cost icon vector image.
Free with trial Loan Related and Investment Line Vector Icon. Investment, Percentage, Interest Rate. Low total cost icon vector image. Thin Outline Vector illustration isolated on background. Time decrease vectors Loan Related and Investment Line Vector Icon. Investment, Percentage, Interest Rate. Low total cost icon vector image.
Free with trial Loan Related and Investment Line Vector Icon. Investment, Percentage, Interest Rate. Low total cost icon vector image. Thin Outline Vector illustration isolated on background. Time decrease vectors Loan Related and Investment Line Vector Icon. Investment, Percentage, Interest Rate. Low total cost icon vector image.
Free with trial Loan Related and Investment Line Vector Icon. Investment, Percentage, Interest Rate. Low total cost icon vector image. Thin Outline Vector illustration isolated on background. Time decrease vectors Loan Related and Investment Line Vector Icon. Investment, Percentage, Interest Rate. Low total cost icon vector image.
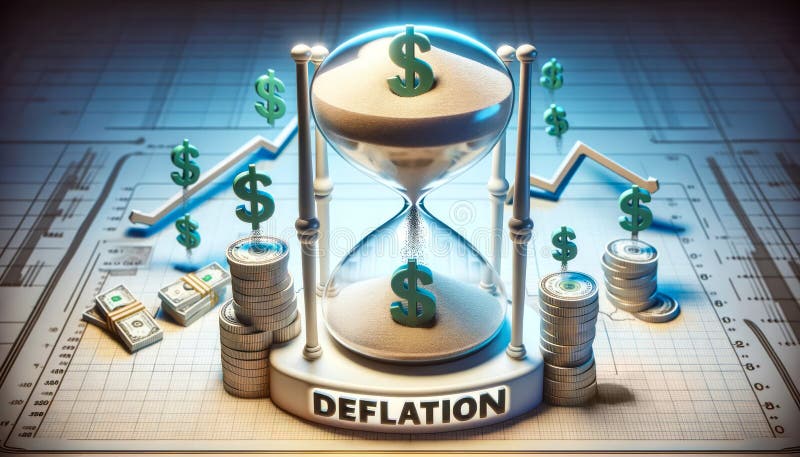
Free with trial Generated with the use of AI. Fading Currency Hourglass: DEFLATION Over Trickling Bills. Time decrease illustrations Fading Currency Hourglass DEFLATION Over Trickling Bills. Generated with the use of AI. Fading Currency Hourglass: DEFLATION Over Trickling Bills
Free with trial Generated with the use of AI. Diminishing Coin Sands: 'DEFLATION' Over Hourglass of Waning Value. Time decrease illustrations Diminishing Coin Sands DEFLATION Over Hourglass of Waning Value. Generated with the use of AI. Diminishing Coin Sands: 'DEFLATION' Over Hourglass of Waning Value
Free with trial Business and finance web icons set in duotone flat design. Pack pictograms with money, graph, businessman, piggy bank, justice, coins, handshake, exchange, cash, diamond, other. Vector illustration. Time decrease vectors Business and finance web icons set in duotone flat design. Pack pictograms with money, graph, businessman, piggy bank, justice
Free with trial Loan interest rate doodle icon set. Hand drawn sketch doodle line style bank money loan interest rate icon for house, car discount percentage concept. Trendy cute element. Vector illustration. Time decrease vectors Loan interest rate doodle icon set. Hand drawn sketch doodle line style bank money loan interest rate icon for house
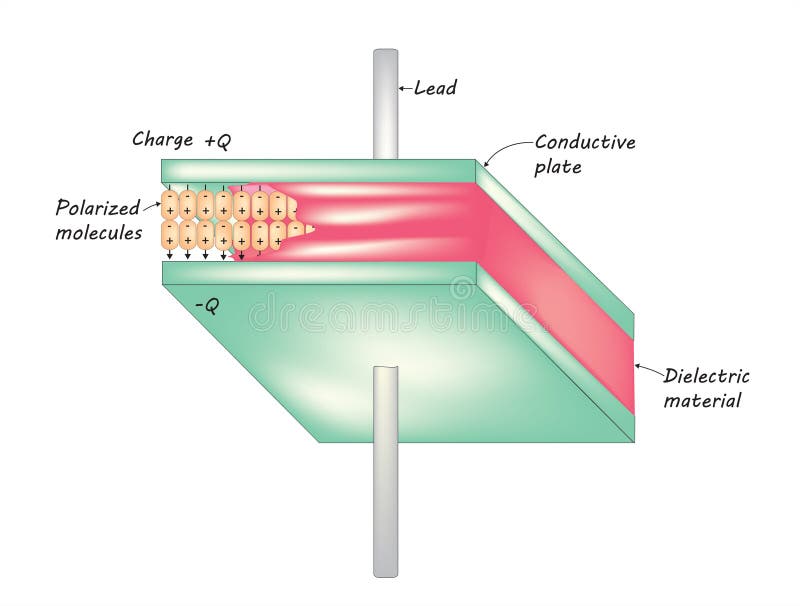
Free with trial A parallel plate capacitor is a simple electronic component used to store electrical energy in a circuit. It consists of two parallel conductive plates separated by a dielectric material. When a voltage is applied across the plates, an electric field is generated between them, causing electric charge to accumulate on the plates. The capacitance of the capacitor, denoted by C, is a measure of its ability to store charge per unit voltage and is determined by factors such as the area of the plates, the distance between them, and the properties of the dielectric material. Time decrease vectors Parallel plate capacitor
Free with trial Economic recession financial crisis hourglass declining graph coins bills money loss concept sand background modern banner Vector illustration. Time decrease vectors Economic recession financial crisis hourglass declining graph coins bills money loss concept sand background modern banner
Free with trial A simple line chart illustrates a decreasing trend with distinct dot markers representing data points. The design emphasizes the shift in values over time and aids in visualizing performance. Time decrease vectors Chart Displaying a Downward Trend in Data Analysis. A simple line chart illustrates a decreasing trend with distinct dot markers representing data points. The design emphasizes the shift in values over time and aids in visualizing performance.
Free with trial Trend stretching line chart illustration axis graph, scale plot, point x trend stretching line chart. Time decrease illustrations Trend stretching line chart
Free with trial Analysis shifting line chart illustration visualization movement, axis series, dynamic fluctuation analysis shifting line chart. Time decrease illustrations Analysis shifting line chart
Free with trial Scissors cutting, Certificate icons. Chef hat, Customer survey, Approved application line icons. Interest rate, gluten free. Linear set. Line icons set. Vector. Time decrease illustrations Chef hat, Customer survey, Approved application line icons. Scissors cutting, Certificate. Linear set Vector. Scissors cutting, Certificate icons. Chef hat, Customer survey, Approved application line icons. Interest rate, gluten free. Linear set. Line icons set. Vector
Free with trial Graph melting line chart illustration temperature plot, axis series, point slope graph melting line chart. Time decrease illustrations Graph melting line chart
Free with trial Dopamine fasting set. Techniques for mental rejuvenation and addiction combat. Mindful lifestyle changes promoting health. Flat vector illustration. Time decrease vectors Dopamine fasting set. Flat vector illustration. Dopamine fasting set. Techniques for mental rejuvenation and addiction combat. Mindful lifestyle changes promoting health. Flat vector illustration.
Free with trial Hand drawn charts and clock showing business growth and speed. Time decrease illustrations Business Growth Speed Concept. Hand drawn charts and clock showing business growth and speed
Free with trial Visualization shifting line graph illustration fluctuation increase, movement change, axis scale visualization shifting line graph. Time decrease illustrations Visualization shifting line graph
Free with trial People discussing progress report. Colleagues analysing charts and graphs with statistical data. Employees during presentation of business results. Teamwork with financial statistics, office meeting. Time decrease vectors Teamwork with financial statistics, office meeting. Employees during business presentation. People discussing progress report. Colleagues analysing charts and graphs with statistical data. Employees during presentation of business results. Teamwork with financial statistics, office meeting
Free with trial A candlestick chart showing a significant downward trend. The chart features black candlesticks indicating price fluctuations over time, with red, green, and orange lines tracing different moving averages. A bar graph at the bottom provides additional data. This image can be used to represent financial loss, market downturns, or economic recession. Time decrease illustrations Downward Trend Candlestick Chart. A candlestick chart showing a significant downward trend. The chart features black candlesticks indicating price fluctuations over time, with red, green, and orange lines tracing different moving averages. A bar graph at the bottom provides additional data. This image can be used to represent financial loss, market downturns, or economic recession.
Free with trial A vibrant graphic announcing a special price drop sale with a colorful awning and leaf design. Time decrease illustrations Special Price Drop Sale Announcement Design. A vibrant graphic announcing a special price drop sale with a colorful awning and leaf design
Free with trial A clean, minimalist bar chart illustration set against a solid green background. The chart features three white vertical bars of different heights, representing data points or progress over time. A simple white grid and axes are visible, indicating a clear visual representation of statistics. This versatile graphic is ideal for conveying concepts of business growth, financial analysis, market trends, statistical reporting, or educational content in a modern, easy-to-understand format. Perfect for presentations, infographics, websites, and applications. Time decrease vectors Minimalist Bar Chart Icon on Green Background. A clean, minimalist bar chart illustration set against a solid green background. The chart features three white vertical bars of different heights, representing data points or progress over time. A simple white grid and axes are visible, indicating a clear visual representation of statistics. This versatile graphic is ideal for conveying concepts of business growth, financial analysis, market trends, statistical reporting, or educational content in a modern, easy-to-understand format. Perfect for presentations, infographics, websites, and applications.
Free with trial Baby height chart with clouds measuring from zero to one hundred and fifty centimeters. Time decrease vectors Cartoon height chart measuring tool for kids with a cute sky theme. Baby height chart with clouds measuring from zero to one hundred and fifty centimeters
Free with trial Money crash on chart graph with arrow down, fail financial business invest. Fall dollar. Vector flat illustration. Time decrease vectors Money crash on chart graph with arrow down, fail financial business invest. Fall dollar. Vector illustration
Free with trial Three line graphs, data visualization, chart comparison. Time decrease vectors Three line graphs, data visualization, chart comparison
Free with trial Office supplies web icons set in duotone flat design. Pack pictograms with manager, presentation, contract, email, briefcase, brainstorm, coffee maker, call, file folder, other. Vector illustration. Time decrease vectors Office supplies web icons set in duotone flat design. Pack pictograms with manager, presentation, contract, email
Free with trial Business and finance web icons set in duotone flat design. Pack pictograms with money, graph, businessman, piggy bank, justice, coins, handshake, exchange, cash, diamond, other. Vector illustration. Time decrease illustrations Business and finance web icons set in duotone flat design. Pack pictograms with money, graph, businessman, piggy bank
Free with trial Vector isolated image embodying artificial intelligence and robots. Time decrease vectors Smart robot with a screen in the form of a graph. Vector isolated image embodying artificial intelligence and robots
Free with trial A 3D render of a bar chart displaying a significant downward trend. Blue bars of varying heights represent data points, intersected by a sharp orange line that clearly illustrates a decline over time. The dark, reflective surface below the chart suggests a digital display or a futuristic interface. This image is ideal for representing financial losses, market crashes, performance decline, or negative trends in various industries. Time decrease illustrations Downtrending Bar Chart with Orange Line on Dark Background. A 3D render of a bar chart displaying a significant downward trend. Blue bars of varying heights represent data points, intersected by a sharp orange line that clearly illustrates a decline over time. The dark, reflective surface below the chart suggests a digital display or a futuristic interface. This image is ideal for representing financial losses, market crashes, performance decline, or negative trends in various industries.
Free with trial This image displays a dynamic business analytics dashboard featuring both bar and line graphs. The bar chart illustrates varying percentages (15%, 50%, 75%, 85%), suggesting performance metrics or growth stages. The line chart, with its intersecting blue lines and data points, represents trends, fluctuations, and comparisons over time or across different categories. The clean, modern design makes it ideal for financial reports, business presentations, and data visualization concepts. Time decrease illustrations Business Growth and Performance Analysis with Bar and Line Charts. This image displays a dynamic business analytics dashboard featuring both bar and line graphs. The bar chart illustrates varying percentages (15%, 50%, 75%, 85%), suggesting performance metrics or growth stages. The line chart, with its intersecting blue lines and data points, represents trends, fluctuations, and comparisons over time or across different categories. The clean, modern design makes it ideal for financial reports, business presentations, and data visualization concepts.
Free with trial Stock market graph displaying downward trend with red indicators. Generative AI. Time decrease illustrations Stock market graph displaying downward trend with red indicators
Free with trial A set of twelve minimalist data visualization icons, featuring charts, graphs, and other data-related symbols. Perfect for presentations, reports, and dashboards, showcasing data analysis and growth trends. The clean design ensures readability and professional appeal. Time decrease illustrations Data Visualization Icons
Free with trial Financial concept image featuring a blue bar chart with a red downward arrow, illustrating decline, recession, or loss over time. Ideal for presentations, reports, infographics, economic forecasts, and business documentation. Clean, clear, and professional visual, created ai. Time decrease illustrations Business bar chart showing financial decline with downward arrow. Financial concept image featuring a blue bar chart with a red downward arrow, illustrating decline, recession, or loss over time. Ideal for presentations, reports, infographics, economic forecasts, and business documentation. Clean, clear, and professional visual, created ai.
Free with trial A vibrant 3D rendering featuring a black minus and percentage sign combination, set against a playful, irregularly shaped pink background with a bright green border. The icon is prominently displayed on a dark, textured surface, creating a modern and eye-catching visual. This graphic effectively symbolizes discounts, sales, price reductions, and special offers, making it ideal for e-commerce promotions, marketing campaigns, financial presentations, or any content related to savings and deals. Time decrease illustrations Vibrant 3D Minus Percentage Icon for Discount and Sale Promotions. A vibrant 3D rendering featuring a black minus and percentage sign combination, set against a playful, irregularly shaped pink background with a bright green border. The icon is prominently displayed on a dark, textured surface, creating a modern and eye-catching visual. This graphic effectively symbolizes discounts, sales, price reductions, and special offers, making it ideal for e-commerce promotions, marketing campaigns, financial presentations, or any content related to savings and deals.
Free with trial Bar graph depicts a downward trend in data, using various colors to illustrate the decline effectively. Time decrease illustrations Graph illustrating data trends showing a steady decline over time. Bar graph depicts a downward trend in data, using various colors to illustrate the decline effectively.
Free with trial Stock market chart showing a downward trend with red and green candlesticks indicating price fluctuations. A moving average line overlays the candlesticks. Volume bars at the bottom correlate with trading activity, mostly red, suggesting higher selling pressure. Vertical axis shows price levels, and horizontal axis depicts time. The chart originates from Cendlewe (Bearits). Candlestick shapes and colors represent price movements over time, with red indicating a decrease and green an increase. Time decrease illustrations Dynamic stock market chart shows downward trend with red and green candlesticks and volume bars. Stock market chart showing a downward trend with red and green. Stock market chart showing a downward trend with red and green candlesticks indicating price fluctuations. A moving average line overlays the candlesticks. Volume bars at the bottom correlate with trading activity, mostly red, suggesting higher selling pressure. Vertical axis shows price levels, and horizontal axis depicts time. The chart originates from Cendlewe (Bearits). Candlestick shapes and colors represent price movements over time, with red indicating a decrease and green an increase.
Free with trial Loan line icons. Settings gear, Message, Inflation icons. Set of Investment, Interest rate and Percentage diagram linear icons. Car leasing, analytics plan, Credit card percent and loan rate. Vector. Time decrease vectors Loan line icons. Set of Investment, Interest rate and Percentage diagram icons. App line icons. Vector. Loan line icons. Settings gear, Message, Inflation icons. Set of Investment, Interest rate and Percentage diagram linear icons. Car leasing, analytics plan, Credit card percent and loan rate. Vector
Free with trial Shopping basket with a decreasing percentage sign above, symbolizing a reduction in price. Time decrease vectors Shopping basket displaying decreasing percentage sign representing price reduction. Shopping basket with a decreasing percentage sign above, symbolizing a reduction in price
Free with trial A detailed blue candlestick chart depicting stock market price fluctuations and trends over time Ideal for illustrating financial concepts market analysis and investment strategies The graphic is clean modern and visually engaging. Time decrease illustrations Blue Financial Chart Candlestick Graph Showing Stock Market Trend Analysis. A detailed blue candlestick chart depicting stock market price fluctuations and trends over time Ideal for illustrating financial concepts market analysis and investment strategies The graphic is clean modern and visually engaging
Free with trial Loan line icons. Social media: share, comment, like icons. Set of Interest rate, Investment and Percentage diagram linear icons. Car leasing, analytics plan, Credit card percent and loan rate. Vector. Time decrease vectors Loan line icons. Set of Investment, Interest rate and Percentage diagram icons. Social media icons. Vector. Loan line icons. Social media: share, comment, like icons. Set of Interest rate, Investment and Percentage diagram linear icons. Car leasing, analytics plan, Credit card percent and loan rate. Vector
Free with trial Set of Investment, Interest rate and Percentage diagram linear icons. Design shape elements. Loan line icons. Car leasing, analytics plan, Credit card percent and loan rate. Vector. Time decrease vectors Loan line icons. Set of Investment, Interest rate and Percentage diagram icons. Design elements. Vector. Set of Investment, Interest rate and Percentage diagram linear icons. Design shape elements. Loan line icons. Car leasing, analytics plan, Credit card percent and loan rate. Vector
Free with trial Car Loan icon Flat set in black and white color outline vector. Time decrease vectors Car Loan Icon for Auto Financing, Vehicle Purchase, and Financial Services Illustrations. Car Loan icon Flat set in black and white color outline vector
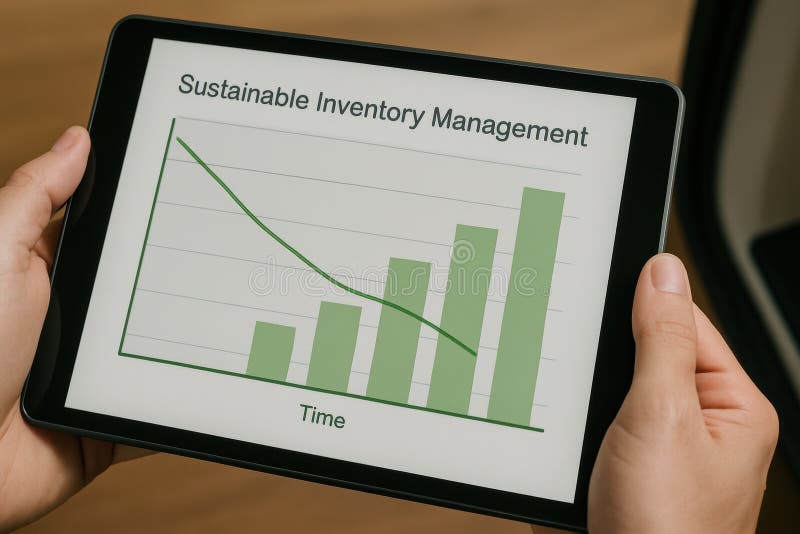
Free with trial A detailed graph displaying sustainable inventory management trends on a tablet device. This image highlights data analytics for business strategy and efficiency. Time decrease illustrations Sustainable Inventory Management Graph on Tablet Device for Business Analytics and Strategy. A detailed graph displaying sustainable inventory management trends on a tablet device. This image highlights data analytics for business strategy and efficiency
Free with trial This 3D rendering showcases a vibrant bar chart illustrating business growth and financial performance. The colorful cylinders represent data points, rising to show increasing success. A line graph adds additional information about trends over time. Time decrease illustrations Colorful 3D Bar Chart with Growth Graph Showing Business Success and Financial Data. This 3D rendering showcases a vibrant bar chart illustrating business growth and financial performance. The colorful cylinders represent data points, rising to show increasing success. A line graph adds additional information about trends over time.
Free with trial Crisp autumn air, vibrant hues of yellow and orange leaves, and a faded price tag with a downward arrow�'this image perfectly captures the essence of seasonal sales and discounts. The visual interplay of the bold autumnal colors and the fading price tag evokes a sense of bargain hunting and the excitement of finding fantastic deals. This is the perfect time to stock up on those cozy sweaters,. Time decrease illustrations Autumn Leaves and Fading Prices Embrace the Seasonal Savings and Discounts Generative AI. Crisp autumn air, vibrant hues of yellow and orange leaves, and a faded price tag with a downward arrow�'this image perfectly captures the essence of seasonal sales and discounts. The visual interplay of the bold autumnal colors and the fading price tag evokes a sense of bargain hunting and the excitement of finding fantastic deals. This is the perfect time to stock up on those cozy sweaters,
Free with trial Square Format Infographic Poster Bold Typography Charts 1 Upscaled 4X clean composition. Featuring square, format, infographic. Neutral, commercial-friendly, with room for copy. Time decrease illustrations Square Format Infographic Poster Bold Typography Charts 1 Upscaled 4X clean composition
Free with trial Financial chart displaying a series of candlestick patterns on a digital screen, used for stock data analysis. The chart features vertical bars in orange against a blue background with grid lines. Each candlestick represents price movements within a specific time frame, showcasing market trends. The background includes a blurred assortment of lights and other graphical elements, indicating a financial data interface, likely used for investment portfolio analysis and trading activities. Time decrease illustrations Financial Chart And Stock Data Analysis For Investment Portfolio. Candle Stick Graph For Trade. Financial chart displaying a series of candlestick patterns on a digital screen, used for stock data analysis. The chart features vertical bars in orange against a blue background with grid lines. Each candlestick represents price movements within a specific time frame, showcasing market trends. The background includes a blurred assortment of lights and other graphical elements, indicating a financial data interface, likely used for investment portfolio analysis and trading activities.
Free with trial Credit and loan icons collection is a vector illustration with editable stroke. Time decrease vectors Credit and loan icons collection is a vector illustration with editable stroke.
Free with trial Electric power, Charge station and Electricity price inflation set. Design shape elements. Energy line icons. Eco energy, efficiency consumption and saving electricity line icons. Vector. Time decrease illustrations Energy line icons. Electric power, Charge station and Electricity price inflation set. Design elements. Vector. Electric power, Charge station and Electricity price inflation set. Design shape elements. Energy line icons. Eco energy, efficiency consumption and saving electricity line icons. Vector
Free with trial Loan interest rate doodle icon set. Hand drawn sketch doodle line style bank money loan interest rate icon for house, car discount percentage concept. Trendy cute element. Vector illustration. Time decrease vectors Loan interest rate doodle icon set. Hand drawn sketch doodle line style bank money loan interest rate icon for house
Free with trial Loan interest rate doodle icon set. Hand drawn sketch doodle line style bank money loan interest rate icon for house, car discount percentage concept. Trendy cute element. Vector illustration. Time decrease vectors Loan interest rate doodle icon set. Hand drawn sketch doodle line style bank money loan interest rate icon for house
Free with trial Loan interest rate doodle icon set. Hand drawn sketch doodle line style bank money loan interest rate icon for house, car discount percentage concept. Trendy cute element. Vector illustration. Time decrease vectors Loan interest rate doodle icon set. Hand drawn sketch doodle line style bank money loan interest rate icon for house
Free with trial Loan interest rate doodle icon set. Hand drawn sketch doodle line style bank money loan interest rate icon for house, car discount percentage concept. Trendy cute element. Vector illustration. Time decrease vectors Loan interest rate doodle icon set. Hand drawn sketch doodle line style bank money loan interest rate icon for house
Free with trial The image shows a candlestick stock chart on a black background, depicting price movements with green and red candlesticks. Suitable for finance and business concepts. Generative AI. Time decrease illustrations Stock market candlestick chart isolated on black background for financial and business concepts. The image shows a candlestick stock chart on a black background, depicting price movements with green and red candlesticks. Suitable for finance and business concepts. Generative AI
Free with trial Set line Old hourglass with sand, Arrow, Location, Layers, Clock, Intersection point and icon. Vector. Time decrease illustrations Set line Old hourglass with sand, Arrow, Location, Layers, Clock, Intersection point and icon. Vector
Free with trial This captivating image evokes a sense of summer savings and financial prudence. A sun umbrella provides a dappled shade, highlighting a mesmerizing bokeh effect created by the interplay of light and shadow. Within the shaded area, a series of diminishing dollar coins are arranged, visually representing the potential for accumulating savings over time. The gradual decrease in size of the coins. Time decrease illustrations Summer Savings A Sun Umbrella Casts a Shade Over Diminishing Dollar Coins Creating a Bokeh Effect for a. This captivating image evokes a sense of summer savings and financial prudence. A sun umbrella provides a dappled shade, highlighting a mesmerizing bokeh effect created by the interplay of light and shadow. Within the shaded area, a series of diminishing dollar coins are arranged, visually representing the potential for accumulating savings over time. The gradual decrease in size of the coins
Free with trial Dropping carbon emissions represented by a 3D graph, set against corporate buildings of the future. Corporate carbon reduction. Time decrease illustrations Dropping carbon emissions represented by a 3D graph, set against corporate buildings of the future. Corporate carbon
Free with trial Scissors cutting, Artificial intelligence icons. Chef hat, Customer survey, Approved application line icons. Interest rate, gluten free. Linear set. Line icons set. Vector. Time decrease illustrations Chef hat, Customer survey, Approved application line icons. Scissors cutting, Artificial intelligence Vector. Scissors cutting, Artificial intelligence icons. Chef hat, Customer survey, Approved application line icons. Interest rate, gluten free. Linear set. Line icons set. Vector
Free with trial Loan Related and Investment Line Vector Icon. Investment, Percentage, Interest Rate. Time decrease vectors Loan Related and Investment Line Vector Icon. Investment, Percentage, Interest Rate
Free with trial Loan Related and Investment Line Vector Icon. Investment, Percentage, Interest Rate. Time decrease vectors Loan Related and Investment Line Vector Icon. Investment, Percentage, Interest Rate
Free with trial Loan Related and Investment Line Vector Icon. Investment, Percentage, Interest Rate. Time decrease vectors Loan Related and Investment Line Vector Icon. Investment, Percentage, Interest Rate
Free with trial Loan Related and Investment Line Vector Icon. Investment, Percentage, Interest Rate. Time decrease vectors Loan Related and Investment Line Vector Icon. Investment, Percentage, Interest Rate
Free with trial Loan Related and Investment Line Vector Icon. Investment, Percentage, Interest Rate. Time decrease vectors Loan Related and Investment Line Vector Icon. Investment, Percentage, Interest Rate
Free with trial Loan Related and Investment Line Vector Icon. Investment, Percentage, Interest Rate. Time decrease vectors Loan Related and Investment Line Vector Icon. Investment, Percentage, Interest Rate
Free with trial Loan Related and Investment Line Vector Icon. Investment, Percentage, Interest Rate. Time decrease vectors Loan Related and Investment Line Vector Icon. Investment, Percentage, Interest Rate
Free with trial Loan Related and Investment Line Vector Icon. Investment, Percentage, Interest Rate. Time decrease illustrations Loan Related and Investment Line Vector Icon. Investment, Percentage, Interest Rate
Free with trial Loan Related and Investment Line Vector Icon. Investment, Percentage, Interest Rate. Time decrease vectors Loan Related and Investment Line Vector Icon. Investment, Percentage, Interest Rate
Free with trial Loan Related and Investment Line Vector Icon. Investment, Percentage, Interest Rate. Time decrease vectors Loan Related and Investment Line Vector Icon. Investment, Percentage, Interest Rate
Free with trial Loan Related and Investment Line Vector Icon. Investment, Percentage, Interest Rate. Time decrease vectors Loan Related and Investment Line Vector Icon. Investment, Percentage, Interest Rate
Free with trial Loan Related and Investment Line Vector Icon. Investment, Percentage, Interest Rate. Time decrease vectors Loan Related and Investment Line Vector Icon. Investment, Percentage, Interest Rate
Free with trial Loan Related and Investment Line Vector Icon. Investment, Percentage, Interest Rate. Time decrease vectors Loan Related and Investment Line Vector Icon. Investment, Percentage, Interest Rate
Free with trial Loan Related and Investment Line Vector Icon. Investment, Percentage, Interest Rate. Time decrease vectors Loan Related and Investment Line Vector Icon. Investment, Percentage, Interest Rate
Free with trial Loan Related and Investment Line Vector Icon. Investment, Percentage, Interest Rate. Time decrease vectors Loan Related and Investment Line Vector Icon. Investment, Percentage, Interest Rate
Free with trial Loan Related and Investment Line Vector Icon. Investment, Percentage, Interest Rate. Time decrease vectors Loan Related and Investment Line Vector Icon. Investment, Percentage, Interest Rate
Free with trial Loan Related and Investment Line Vector Icon. Investment, Percentage, Interest Rate. Time decrease vectors Loan Related and Investment Line Vector Icon. Investment, Percentage, Interest Rate
Free with trial This infographic illustrates a crucial aspect of data analysis: recognizing and interpreting downward trends. The chart clearly displays a decreasing arrow, highlighting a negative slope and a reduction in value over time. Understanding these downward trends is critical in various fields, from finance and business to investment and market analysis. The visual representation aids in quickly. Time decrease illustrations Analyzing Downward Trends in Data A Comprehensive Guide to Understanding Decreasing Charts and Graphs in Business. This infographic illustrates a crucial aspect of data analysis: recognizing and interpreting downward trends. The chart clearly displays a decreasing arrow, highlighting a negative slope and a reduction in value over time. Understanding these downward trends is critical in various fields, from finance and business to investment and market analysis. The visual representation aids in quickly
Free with trial In a virtual space, a 3D graph displaying decreasing carbon emissions stands against modern corporate buildings. Corporate carbon reduction. Time decrease illustrations In a virtual space, a 3D graph displaying decreasing carbon emissions stands against modern corporate buildings